М У Й і': ' i - * i Í Í - ' / '■ S * :
e 'T * t» , »
i f ¥ l t Л ./-40 1 J"' /:ЛІ ‘
*Шё}
MULTICRITERIA ABC CLASSIFICATION WITH AHP METHOD; AN APPLICATION
A THESIS
SUBMITTED TO THE FACULTY OF MANAGEMENT AND
GRADUATE SCHOOL OF BUSINESS ADMINISTRATION OF BILKENT UNIVERSITY
IN PARTIAL FULFILLMENT OF THE REQUIREMENTS FOR THE DEGREE OF
MASTER OF BUSINESS ADMINISTRATION
EMRAH ERDİNÇ ANKARA, DECEMBER, 1996
иь
i f )
• t ' I sj О ^
I certify that I have read this thesis and in my opinion it is fully adequate, in scope and quality, as a thesis for the degree of Master of Business Administration.
j , r
r f.
Assistant Prof Dr. Erdal ErelI certify that I have read this thesis and in my opinion it is fully adequate, in scope and quality, as a thesis for the degree of Master of Business Administration.
Assistant Prof Dr. Jay Ghosh
I certify that I have read this thesis and in my opinion it is fully adequate, in scope and quality, as a thesis for the degree of Master of Business Administration.
Assistant P/of Dr. Ümit Yüceer
Approved for the Graduate School of Business Administration.
\
İÜ
ABSTRACT
MULTICRITERIA ABC CLASSIFICATION WITH AHP METHOD: AN APPLICATION
BY
EMRAH ERDİNÇ
SUPERVISOR: ASSISTANT PROF. DR. ERDAL EREL DECEMBER, 1996
The traditional ABC classification is an inventory management technique that is applied by many companies in different industries. The method classifies the items in the inventory as class A. B. and C. The classification enables the managers to exert different levels of control on each class according to their importance for the company. Class A is constituted of the most important items and class C is constituted of the least important ones. Class B items have intermediate importance for the company.
The Traditional ABC Classification method uses only one criterion in order to classify the items, however management may need to consider multiple criteria. The Multicriteria ABC Classification method provides a solution to this problem. This method also enables the managers to incorporate their judgments into the analysis. In this thesis both the traditional and the multicriteria ABC classification methods are applied to the inventory of a Turkish pharmaceutical company and the results are compared. The Analytic Hierarchy Process (AHP) technique is utilized in order to conduct the multicriteria inventory classification.
Keywords: Inventory management, Traditional ABC classification. Multicriteria ABC classification. Analytic Hierarchy Process
ÖZET
AHP METODUYLA ÇOK KRİTERLİ ENVANTER SINIFLAMASI: BİR UYGULAMA
EMRAH ERDİNÇ
TEZ YÖNETİCİSİ: YRD. DOÇ. DR. ERDAL EREL ARALIK, 1996
Klasik ABC sınıflaması değişik endüstrilerde bir çok firma tarafından uygulanan bir envanter yönetimi tekniğidir. Metot envanterdeki maddeleri A, B ve C olarak sınıflandırır. Sınıflandırma, yöneticilere her sınıfı firmaya olan önemine göre değişik derecelerde kontrol etme olanağı sağlar. Sınıf A en önemli maddelerden, sınıf C ise en az öneme sahip olan maddelerden oluşmuştur. Sınıf B maddelerinin firma için orta derecede önemi vardır.
Klasik ABC sınıflama metodu maddeleri sınıflandırmak için sadece bir kriter kullanır, ancak yönetimin birden çok kritere ihtiyacı olabilir. Çok kriterli ABC sınıflaması bu probleme bir çözüm getirmektedir. Bu metot ayrıca yöneticilerin kendi yargılarını da analizde kullanmalarına olanak sağlamaktadır. Bu tezde hem klasik hem de çok kriterli ABC sınıflama metotları bir Türk ilaç firmasının envanterine uygulanmış ve sonuçlar karşılaştırılmıştır. Çok kriterli envanter sınıflamasının uygulaması için Analitik Hiyerarşi Süreci (AHS) tekniği kullanılmıştır.
Anahtar sözcükler: Envanter yönetimi. Klasik ABC sınıflaması. Çok kriterli ABC sınıflaması. Analitik Hiyerarşi Süreci
ACKNOWLEDGEMENTS
I would like to thank Assistant Prof. Dr. Erdal Erel for his supervision and valuable comments throughout the study. I would also express may gratitude to Assistant Prof Dr. Jay Ghosh and Assistant Prof Dr. Ümit Yüceer for their comments about the thesis.
TABLE OF CONTENTS
ASTRACT...i
ÖZET...ii
ACKNOWLEDGEMENTS... iii
1. INTRODUCTION...1
1.1 Purpose and Scope of the Thesis...2
1.2 Outline of the Thesis... 2
2. LITEILATURE SURVEY... 4
3. DESCRIPTION OF THE METHODS... 6
3.1 ABC Inventory Classification Method... 6
3.2 Analytic Hierarchy Process... 8
3.2.1 The Hierarchic Design of Analytic Hierarchy Process...9
3.2.2. Pairwise Comparisons...10
3.2.3 Consistency of the Pairwise Comparison Matrix...13
3.2.4. Calculation of the Priorities:... ;...15
3.2.5. Application of AHP to Multicriteria Inventory Classification:... 15
4. AN APPLICATION OF ABC CLASSIFICATION TO THE INVENTORY... 17
OF A TURKISH PHARMACEUTICAL COMPANY 4.1 Turkish Pharmaceutical Industry...17
4.2 Company Information...19
4.3 The Hierarchic Design and the Explanation of Criteria Used in the Study...21
4.4 The Multicriteria ABC Classification... 24
4.5 The Comparison of the Results of Traditional and Multicriteria Inventory... 26
Classification Methods 4.6 Chi Square Goodness of Fit Test... 29
5. DECISION SYSTEMS FOR INVENTORY ITEMS... 34
5.1 Order-Point, Order-Quantity (s,Q) System... 35
5.2 Order-Point, Order-up-to-Level (s,S) System... 35
5.3 Periodic Review, Order-up-to- Level (R,S) System... 36
5.5 Establishing Safety Stocks for Individual Items... 36
5.5.1 The Usage of a Common Factor...37
5.5.2 The Usage of Shortage Costs...37
5.5.3 The Usage of Service Considerations...37
5.5.4 The Usage of Effects of Disservice on Future Demand... 38
5.5.5 The Usage of Aggregate Considerations... 38
5.6 Establishment of the Value of Reorder Point (s)... 38
5.7 Discussion on Class A Item s... 38
5.8 Discussion on Class B Items... 39
5.9 Discussion on Class C Items... 39
6. SUMMARY AND CONCLUSION... 40
APPENDIX A ... 43
APPENDIX B ...50
LIST OF TABLES
Table 1. The Percentages of ABC Inventory Classification Method...7
Table 2. Pairwise Comparison Matrix...12
Table 3. The Pairwise Comparison Scale...12
Table 4. The Random Indexes for Reciprocal Matrices of Different Orders... 14
Table 5. Imports and Exports of Pharmaceutical Products (in millions of dollars)...18
Table 6. The Comparison of Chemical Compounds and Packaging Material... 20
Table 7. The Criteria used in the Study... 23
Table 8. The Pairwise Comparison Matrix...24
Table 9. The Priorities of the Seven Criteria... 25
Table 10. The Distribution of Chemical Compounds and Packaging Material... 26
Table 11. Cumulative Percentages of Items and Weighted Scores...28
Table 12. Comparison of the Results of two ABC Classification Methods...28
Table 13. Probabilities for Contingency Table... 29
Table 14. Observed and Expected (in Parentheses) Values...30
Table 15. Observed and Expected (in Parentheses) Values for the Second Study... 32
LIST OF FIGURES
Figure. 1. The Hierarchical Design...11
Figure. 2. The Hierarchic Design used in the study... 17
Figure. 3. The Result of Traditional ABC Classification... 22
Figure. 4. The main menu of the MCIC-AHP program... 44
Figure. 5. The criteria names... 45
Figure. 6. Entering pairwise comparisons...45
Figure. 7. The pairwise comparison matrix, eigen vector and the consistency indices... 46
Figure. 8. The criteria and their priorities... 46
Figure. 9. Saving the criteria list in to a text file... 47
Figure. 10. Example of an inventory file... 47
Figure. 11. Loading of the inventory file... 48
Figure. 12. Two options for ABC classification...48
1. INTRODUCTION
In this rapidly changing and highly competitive business environment, effective inventory management is a major competitive advantage. A wide range of organizations ranging from hospitals to military establishments have to deal with inventories consisting of thousands of different items. In order to manage their inventories, organizatioris have to spend enormous amount of money. In 1979, Herron reported that for many firms inventory costs are nearly equal to the before tax operating profits [1]. Even with a small reduction in the inventory costs, firms can divert significant amount of money to more beneficial investments.
Inventories are not only important because of the costs associated with them, but they are also important because of the adverse effects of stockouts. The consequences of a stockout occasion are lost sales, profit, and goodwill. Moreover, future demand will also be negatively effected because of the company's disservice.
The aim of the inventory management methods is to aid the managers in their efforts to maintain a high level of customer service, at the lowest possible cost. ABC Classification method is one of the inventory management tools, that is widely applied by a lot of companies in different industries [2]. In this method items in the inventory are classified as Class A, B or C. The rationale behind this method is to exert different levels of control on each class, since the importance and costs associated with each class are different.
1.1 Purpose and Scope of the Thesis
The purpose of this thesis is to apply both the traditional and multicriteria ABC classification methods to the inventory of a Turkish pharmaceutical company, and to compare the results of these two techniques.
The pharmaceutical industry is a process industry so the number of items held in the inventory is less than the number of items held in the inventories of many fabrication/assembly industries. However, many items in the inventories of drug manufacturing firms are perishable. There are a lot of items that need to be stored in temperature controlled rooms, and this increases the carrying costs of these items. Furthermore, the level of competition in the pharmaceutical industry is extremely high, and this results in high disservice costs.
The multicriteria ABC classification will be performed by the usage of Analytic Hierarchy Process (AHP) method. In this method the classification is accomplished by the usage of several criteria that are specified by the production planning and inventory management chief of the pharmaceutical company.
In the traditional ABC classification method, only one criterion (annual dollar usage) is used in order to classify the items, in the inventory. This method will also be applied to the same inventory and the results of these two methods will be compared. Finally information will be provided about the different management techniques for Class A, B, and C items.
1.2 Outline of the Thesis
The second chapter reviews the related literature. The third chapter explains the traditional ABC classification method, and the AHP technique. Moreover, the application of AHP to multicriteria inventory classification will also be discussed in this chapter.
In the fourth chapter detailed information will be provided about the application of both the traditional, and multicriteria ABC classification methods to the inventory of a Turkish pharmaceutical company. The results of the two methods will be compared, and a statistical analysis will be conducted.
In the fifth chapter periodic review, continuous review techniques and the four most common inventory control methods will be introduced. Moreover, different decision criteria for each class of items in the inventory will be discussed. Furthermore, different approaches about the determination of safety stocks will also be explored.
The final chapter consists of a general summary, and discussion of the findings that are revealed by the thesis.
2. LITERATURE SURVEY
Some of the earliest studies about classification were conducted by Vilfredo Pareto[3]. In 18'th century he found that the majority of the income (80%) in a country is received by a small percentage (20%) of the population[2]. Pareto Principle is that few have the greatest importance, white many have little importance in a group. This principle is also known as 80- 20 rule. Pareto thought that 80-20 rule could hold in many situations, but he could not prove that his principle could be generalized [4].
In 1940's, H. Ford Dickie created ABC Inventory Classification Method by using the Pareto Principle[2]. The ABC classification method enables the managers to divide inventory items in to three classes as A, B and C, so that different degrees of control can be exerted on each class. This technique is universally applied by many companies in service and manufacturing industries, however it has an important limitation.
Traditional ABC Classification Method uses only one criterion (annual dollar usage) in order to determine the items in each, class, however management may need to consider other criteria in order to conduct an ABC analysis[5,6]. In some cases the results of traditional method can be misleading due to ,the omission of significant factors.
Because of the limited capability of the traditional method, researchers investigated new methods for inventory classification. In 1985, Flores and Whybark[4] proposed the usage of multiple criteria in order to conduct ABC analysis. In the study Flores and Whybark also applied their method to a Mexican manufacturing firm and discussed their findings.
In 1992 Partovi and Burton criticized the bi-criteria matrix approach proposed by Flores and Whybark. They stated that the approach of Flores and Whybark was to use standard ABC analysis on each of two criteria and then combine the two single criterion ABC groupings through the usage of joint criteria matrix[6]. Partovi and Burton determined two limitations of the bi-criteria matrix approach. They urged that there were no obvious way to extend the procedure to more than two criteria and the weights of different criteria were assumed to be equal [6].
In order to overcome these limitations Partovi and Burton proposed the usage of Analytic Hierarchy Process for ABC analysis. They used seven criteria, that are price, obsolescence, lead time, substitutability, repairability, criticality and demand. Partovi and Burton also applied their method to a pharmaceutical company in Philadelphia and discussed their findings. The results indicated that the usage of the proposed AHP based multicriteria inventory classification method substantially reduced downtime and average inventory investment, but increased the ordering costs marginally[6].
The Analytic Hierarchy Process (AHP), that is utilized in order to conduct multicriteria ABC classification, is a theory for modeling unstructured problems in the economic, social, and management sciences [7]. It has found application opportunities in a wide range of areas from deciding which car to buy to conducting muliicriteria inventory classification [5,6].
Thomas L. Saaty originally developed AHP in 1972 to solve a specific problem in contingency planning. Later he applied the theory to generate an investment plan for Sudan. AHP evolved continuously by various applications such as R&D management and portfolio selection.
In 1994 Partovi and Hopton published a paper that demonstrates the usage of AHP to conduct a multicriteria ABC analysis. In this study they also used AHP in order to allocate order quantity among vendors[5].
3. DESCRIPTION OF THE METHODS
3.1 ABC Inventory Classification Method
An inventory system should aid the manager to specify when an order is to be placed for an item and how many units to order. However, generally it is not practical to exert intensive control on each item because, thousands of different items are held in inventories and all of these items need to be monitored steadily. The ABC method provides a solution to this problem. The method divides inventory items in to three classes as A, B, and C by the help of Pareto's Principle.
Class A is constituted of the most important items for the company. Class B items possess secondary importance and finally Class C represents the least important items in the inventory. The application of ABC classification ensures the managers to adopt different inventory management techniques for each class. The most important items (Class A) deserve sophisticated control methods, while Class C receives the least attention.
In the traditional ABC inventory classification method only one criterion is used in order to determine the items in class A, B, and C. This criterion is the annual dollar usage (Dy) and it is calculated by multiplying the unit cost (v) and annual demand (D); After this calculation, the items are ranked in descending order according to their annual dollar usages.
The observation of the data at this step will reveal that the minority of items accounts for a large dollar volume, and the majority of items accounts for a small dollar volume. Generally
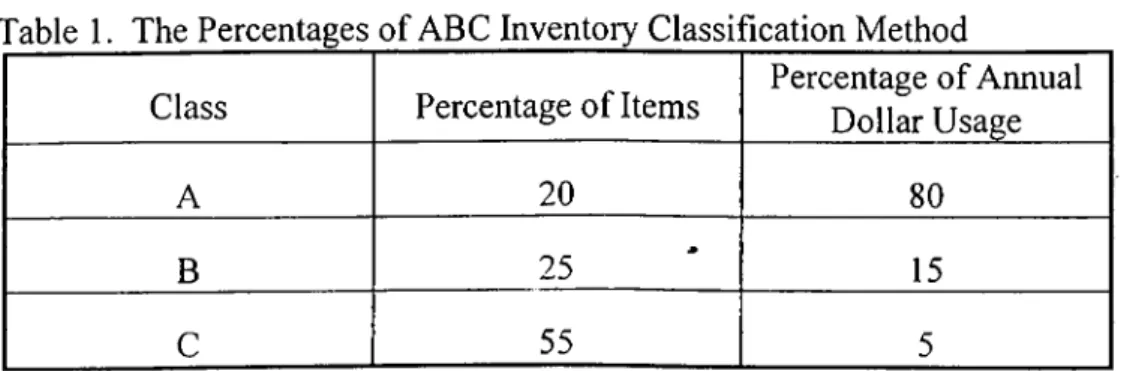
15% to 20% of items represent 70% to 80% of the total value of the inventory. These items that are at the top of the list are labeled as Class A items. The subsequent 25%-30% of the items represent 15%-20% of the total value and are classified as Class B items. Finally Class C is constituted by the rest of the items in the inventory.
The classification of the items in an inventory can be accomplished by using the percentages given in Table l.[9].
Table 1. The Percentages of ABC Inventory Classiliication Method
Class Percentage of Items Percentage of Annual Dollar Usage
A 20 80
B 25 15
c
55 5By grouping items in an inventory as Class A, B, and C, the management has the opportunity to exert more control over the most valuable inventory. Two general rules are identified about the ABC method [9]:
1. Have plenty of low value items, so that they can be available when needed.
2. Loosen control on Class C items and exert more control on high value items, due to their high payoff possibilities.
Some application opportunities of ABC method for each class are given below [9]:
Class A: These items represent the 70% to 80% of the total inventory value, so they must be controlled tightly. The records should be accurate, detailed and updated continuously. Order points and order quantities should be determined accurately and reviewed frequently. The management should receive reports regularly. Moreover, ways of decreasing inventory
should be investigated and lead time should be decreased by establishing good relationship with the suppliers.
Class B: These are the items that are not as important as the Class A items, however they represent 15 to 20% of the total inventory value. Management should exert intermediate controls on these items, and the order points should be reviewed quarterly.
Class C: These items are the ones that represent a small percentage of annual dollar usage, but approximately half of the items in the inventory. They deserve the simplest controls such as periodic review. The two-bin system may be appropriate for these items. At this point it is important to note that although they are low value items, their absence can cause the production to stop. Because of this reason large inventories and order quantities are needed to avoid stockouts.
3.2 Analytic Hierarchy Process
Human beings have developed measurement scales in a wide range of areas but the attempts to establish measurement scales for social values have usually failed. For example, we can not measure happiness, environmental quality or health. People have judgments about social values but no universally accepted measurement scale is generated[7]. AHP technique is a method that enables people to deal with judgments that have not been quantified.
Analytic Hierarchy Process (AHP) is a theory for modeling unstructured problems in the economic, social, and management sciences [7].
AHP method enables the users to cope with intangible data. The technique uses pairwise comparison judgments as the main input and is able to quantify the judgments of the people. Pairwise comparisons are used because people can be more accurate in their judgments by
comparing two factors at a time. Thomas L. Saaty also reported that the users found the process of pairwise comparisons to be easy and natural[7].
The tests of the method showed that the estimates successfully approximated the actual answers that were known. In one of the tests an experienced air traveler was asked to make pairwise comparisons of the distances of six different cities from Philadelphia. He conducted the pairwise comparisons by thinking only about the airplane boredom. The experiment revealed that the estimates of the distances successfully approximated the real distances of the six cities from Philadelphia. In many other tests experimenters showed that the results of the method complied with the actual values.
3.2.1 The Hierarchic Design of Analytic Hierarchy Process
A hierarchy is an abstraction of the structure of a system to study the functional interactions of its components and their impacts on the entire system [7]. The fundamental idea behind the hierarchic design is originated from the phases of human perception. Decomposition and synthesis are the two stages of human perception. When people encounter complex systems they first decompose the complexity into small parts. At the second stage, called synthesis, human beings realize the relations between these small parts.
The construction of a hierarchy is the decomposition of the complex system into small parts. Experience and knowledge in the problem area are indispensable in order to attain a well-constructed hierarchy. By this way, a good model of reality can be achieved. At this stage the decision maker should identify the important factors that are relevant to the particular problem.
A hierarchy is constituted of several levels. The ultimate goal is placed at the top. The criteria and sub criteria are placed in a descending order and they constitute the subsequent
levels. It is important to note that the entities at each level can only influence the ones at the upper level, and they should be independent of each other.
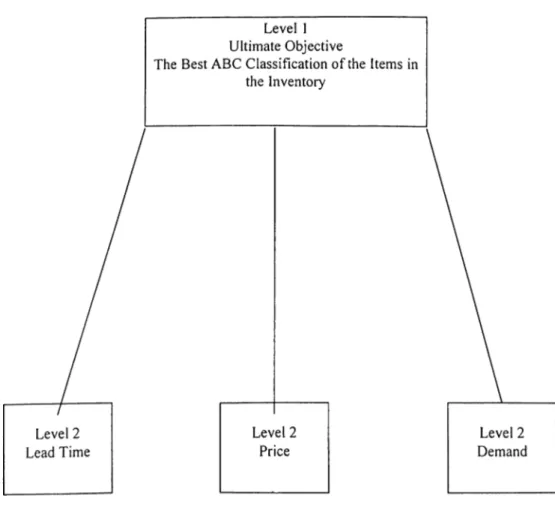
An example of a hierarchy is given in Figure 1. The ultimate objective is to attain the best ABC classification of items in the inventory[6], and it is influenced by three criteria that are price, annual demand, and lead time. These three criteria influence the ultimate objective.
3.2.2. Pairwise Comparisons
Pairwise comparison is a powerful tool to quantify judgments, because it enables the user to focus on two objects at a time. Establishing a pairwise comparison matrix is the synthesis stage of human perception. At this phase the user compares two entities according to their influence to another entity at the upper level. Pairwise comparison matrix is established by comparing all of the entities in a level with each other one by one.
As an example we can construct the pairwise comparison matrix of tliree factors by their influence to the overall objective. In Figure 1. we have identified three criteria as price, demand and lead time and the ultimate objective as the best ABC classification of the items in the inventory. The matrix should be constructed by the judgments of people who may or may not be experts but they should be familiar with the problem [7].
We can represent the price with C l, demand with C2, and lead time with C3. The relative strength of the criteria according to their contribution to the overall goal is indicated by ajj. The term aij gives the importance of criterion Cj, relative to the importance of criterion Cj.
Figure 1. The Hierarchical Design
'able 2. Pairwise Comparison Matrix
Criterion Cl Ci Cn
Cl 1 ai2 ai3
Ci a2l 1 a23
Cn asi a32 1
For example ai2 represents significance of criterion 1 relative to criterion 2. The diagonal of the matrix is constituted of 1 's because each criterion is equally important when compared to itself. If we denote the strength of criterion one as wi, and that of criterion two as W2 than ai2 can also be written as wi/w2· It is also important to note that the matrix is symmetric around the diagonal. For instance, if ai2 is 4 than a2i should be its reciprocal 1/4.
ajj = wi/wj, aji = wj/wi, and ajj = l/ay for i,j = 1,... , n
In order to determine the relative strengths of criteria Thomas L. Saaty suggests to use a scale from one to nine. The definition of the scale is given in Table 3.
Tables. The Pairwise Comparison Scale.
Scale Definition
1 Equal importance
3 Weak importance
5 Strong importance
7 Very strong importance
9 Absolute importance
2,4,6,8 represent the intermediate levels of importance between adjacent judgments.
For example, if the value of ai2 is 5 then it means that the price of the item is strongly important than the annual demand of the item, in order to attain best ABC classification.
3.2.3 Consistency of the Pairwise Comparison Matrix
In the measurement process consistency can not always be attained. Even when we use measuring instruments, errors can be observed and these errors often lead to inconsistency. When there is inconsistency we can observe that criterion A is more important than criterion B, and criterion B is more important than criterion C, however criterion C is more important than criterion A. This result reveals that there is a violation of transivity principle.
Another principle that is related to consistency is proportionality. For example if object A is two times heavier than object B and object B is three times heavier than object C, than object A must be six times heavier than object C. Inconsistency in the measurement process is always a result of the violation of proportionality principle. Moreover, it can also be a consequence of the violation of both proportionality and transivity principles.
Perfect consistency in the measuring process is very difficult to achieve, especially when we are dealing with personal judgrpents. In this study a procedure that is suggested by Saaty will be applied. For this purpose a method is utilized in order to measure how seriously the principle of consistency is violated.
The maximum eigenvalue approach provides us a measure of departure from consistency. The maximum eigenvalue (^max) of a positive reciprocal matrix should be equal to the order of that matrix (n) for perfect consistency. Inconsistency increases as the value of >.|,iax diverges from n [7,11,12].
The value of maximum eigenvalue (7.max) is found as follows[7j:
1) Multiply the pairwise comparison matrix by the solution vector. This calculation will result in an other vector.
2) Divide the first component of this vector by the first component of the solution vector.
3) Divide the second component of the vector by the second component of the solution vector and continue this process for all components of the two vectors. This process will provide another vector.
4) Take the sum of the components of this vector and divide the sum by the number of components of the vector.
The degree of the violation of consistency can also be measured by the use of Consistency Index.
Consistency Index (Cl): (A-max -n) / (n-1)
Another representation of consistency is the Consistency Ratio. This ratio is calculated by dividing consistency index by the Random Index (RI) of a same order matrix.
Consistency Ratio (CR): Cl / RI
Where RI is the consistency index of a randomly generated perfectly consistent reciprocal matrix. The Random Indexes for reciprocal matrices of different orders are given in Table 4. These values are determined by Oak Ridge National Laboratory and Wharton School[7].
'able 4. The Random Indexes for Reci
Di'oca!
Matrices of Different; Orders.n
1
2
3
4
5
6
7
8
9
10 11
12
13 14 15
RI
0.00 0.00 0.58 0.90 1.12 1.24 1.32 1.41 1.45 1.49 1.51 1.48 1.56 1.57 1.59
A consistency ratio of 0.10 or less is determined as acceptable by Saaty. When this ratio exceeds 0.10 then the pairwise comparison matrix should be improved by better judgments.
3.2.4. Calculation of the Priorities:
The priorities of the criteria are obtained by calculating the eigenvector of the pairwise comparison matrix with the largest eigenvalue.
There are four methods to compute the principal eigenvector of a pairwise comparison matrix[7]. The methods normalize the results so that the priorities add up to unity.
Method 1: Take the sum of the elements in each row, and normalize resulting values. In order to normalize, take the sum of the values and divide each one by this sum. Saaty has shown that this method provides the crudest results.
Method 2: Take the sum of the elements in each column of the pairwise comparison matrix. Then take the reciprocals of these sums and divide each reciprocal by the sum of the reciprocals. This method provides better results than the first one.
Method 3; Take the sum of the elements of each column, and divide the elements of each column by the sum of that column. Then add the elements in each resulting row and divide this sum by the number of elements in the row. This method provides a good approximation to the actual values.
Method 4: Multiply the n elements in each row and than take the n'th root. Finally normalize the resulting numbers. Saaty has shown that this method also provides good results.
3.2.5. Application of AHP to Multicriteria Inventory Classification:
In order to conduct a multicriteria inventory classification by AHP technique, firstly the hierarchic representation of the situation is generated. Secondly the priorities for the criteria
are computed. Thirdly the values of each criterion for every inventory item are determined and finally the weighted averages of these values are taken for each inventory item.
In this process it is important to note that each criterion has a different measurement unit. In order to take the weighted averages these units should be converted into a common scale. The values of each criterion for the inventory items are converted in to a 0-1 scale by the use of the following formula:
C-i'Cmin ! Cmax'Cmin
Where: C, is the value of that criterion for the i'th inventory item Cmin is the minimum value of that particular criterion . Стах is the maximum value of that particular criterion
The weighted scores for each inventory item are calculated by using these converted criteria values and the priorities of each criterion. After this step, the weighted scores are sorted in descending order and the items are labeled as Class A, В or C according to predetermined percentages. Class A is constructed of the items that possess the highest weighted scores. Likewise the items that have lowest weighted scores constitute Class C.
4 . AN APPLICATION OF ABC CLASSIFICATION TO THE INVENTORY OF A TURKISH PHARMACEUTICAL COMPANY
The aim of this chapter is to provide the details of the application of multicriteria inventory classification method to a Turkish pharmaceutical company. The data is obtained from the records of the particular firm. Moreover, judgments of the managers are acquired by the utilization of interviews and questionnaires.
4.1 Turkish Pharmaceutical Industry
Pharmaceutical industry produces the medical and veterinary chemical compounds, in compliance with the pharmaceutical technology and scientific standards. It is shown by the code 3522 in the International Standard Industrial Classification of All Economic Activities Index (ISIC Rev.2).
The number of chemical compounds that is used in the pharmaceutical industry is exceeding 2000[13]. The pharmaceutical products can be classified in 15 headings according to their pharmaceutical forms. Some of the examples are pills, injection products, granules, suspensions, capsules, and syrups.
The pharmaceutical industry is dependent on research and development activities. The cost of a new drug is exceeding 250 million dollars and the introduction of a new drug requires 10 to 12 years after the discovery of the efficient conipound[14]. Even the most powerful companies can introduce one or two new drugs in one year because of these high
costs. The companies of United States, England, Italy, Germany, France, Switzerland and Japan are among the most powerful ones in the industry. It is important to note that most of these companies are multinationals.
Turkish pharmaceutical industry is consisted of multinational and Turkish companies. Some examples of multinationals are Pfizer, Roche, Bayer, Merck and Glaxo. Eczaciba§i, Fako, and Atabay are some examples of Turkish firms. The R&D activities of Turkish pharmaceutical industry are not sufficient and Turkish companies have to import most of the chemical compounds that they use for production.
The value of pharmaceutical products that Turkey imports is exceeding the value of pharmaceutical products that Turkey exports as shown below:
'able 5. Imports and Exports of P' larmaceutical Products (in millions of dollars)[15
1992 1993 1994 1995 Imports 302.9 371.6 339.3 520.7 Percentage in Manufacturing Industry 1.60% 1.48% 1.75% 1.71% Exports 44.7 73.0 72.3 53.2 Percentage in Manufacturing Industry 0.33% 0.51% 0.43% 0.26%
The production value (production quantity * selling price) in pharmaceutical industry in the first half of 1996 (January-June) is 52.184.375000000 TL [16].
4.2 Company Information
The company of concern is a newcomer to the pharmaceutical industry. Currently the firm produces relatively unsophisticated drugs except antibiotics. The market share of the company is around 1%.
An ABC analysis has not been conducted in the company, so all of the items in the inventory are receiving the same attention by the management. The inventory status is determined continuously by the utilization of the transactions reporting method, and the management is using the order point order quantity (s,Q) inventory control method. Safety stocks, reorder points and order quantities are determined for most of the items.
The inventory of the company consists of 320 items. 104 of the items are chemical compounds and 216 of the items are packaging materials. The packaging materials are mainly labels, boxes, bottles, tubes, separators, prospectuses, shrink folios, PVC folios and aluminum folios.
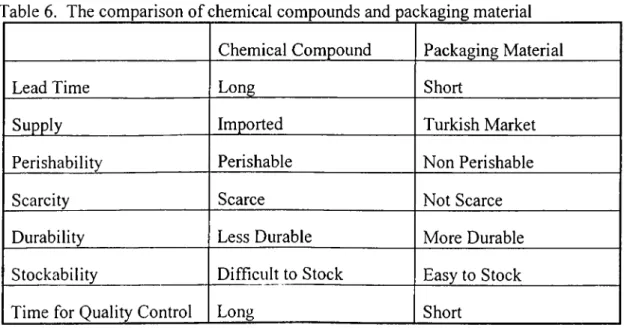
There are remarkable differences between chemical compounds and packaging materials. The lead time of chemical compounds is considerably higher than that of the packaging materials. There are two reasons of this phenomenon. First of all the chemical compounds are generally imported from abroad, so their lead times are longer than that of the packaging materials, which are supplied from the Turkish market. Moreover, the quality control of the chemical compounds takes considerably more time than that of the packaging materials.
Another difference between these two types of items is that the chemical compounds are perishable items, while the packaging materials are highly durable. The perishability of the chemical compounds also imposes serious difficulties in the storing process. Most of the chemical compounds are sterile and the sterility of the components should be protected. Moreover they are sensible to heat, light and humidity. Some of these items should be stored
in temperature controlled rooms. The differences between the two types of items are given in Table 6. in condensed form.
Table 6. The comparison of chemical compounds and packaging material Chemical Compound Packaging Material
Lead Time Long Short
Supply Imported Turkish Market
Perishability Perishable Non Perishable
Scarcity Scarce Not Scarce
Durability Less Durable More Durable
Stockability Difficult to Stock Easy to Stock
Time for Quality Control Long Short
Throughout the study the name of the firm, and the names of inventory items are disguised due to confidentiality reasons.
The next section describes the hierarchic design that is used for the application of the AHP technique. Furthermore, the explanations of the criteria are also given at this part of the study. Section 4.4 presents the pairwise comparison matrix, and outcomes of the AHP technique including the Consistency Ratio and the priorities (weights) of the criteria. Section 4.5 provides the details of the application of traditional ABC classification method for the same inventory. A comparison of the results of traditional and multicriteria inventory classification techniques are also given at this section. Finally in the last section the chi square goodness of fit test is applied.
4.3 The Hierarchic Design and the Explanation of Criteria Used in the Study
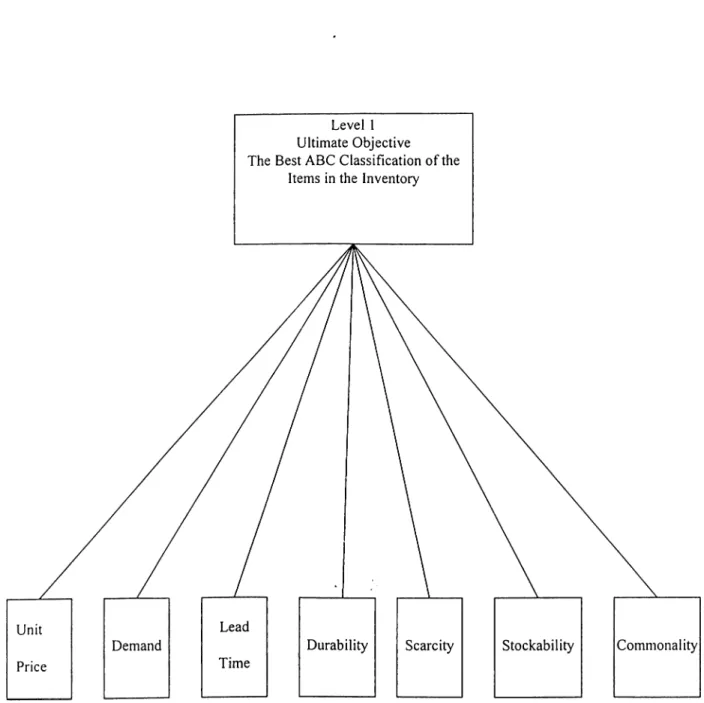
The hierarchic design that is used in the study is established by interviews and discussions with the chief of the Production Planning and Inventory Control department. The criteria are determined as lead time, durability, annual demand, scarcity, commonality, unit cost and stockability (Figure 2).
Lead time is the number of days elapsing between the decision to order and the placement of the item on the shelf. The chemical compounds are generally imported from abroad so their lead times are longer than that of the packaging materials. Another fact that contributes to long lead times is that, the quality controls of chemical compounds take more time than that of packaging materials.
Durability is an important criterion since the shelf life limitation of chemical compounds imposes serious difficulties on the inventory management efforts. In the study the most durable items will take the value of 1, while the least durable ones will take the value 5.
Annual demand shows the number of units demanded of a particular item in one year.
Scarcity represents the difficulties encountered in the process of ordering an item. The items that are imported abroad are generally more scarce than the ones that are not imported. Furthermore, the chemical compounds that are sensitive to temperature are scarce items due to strict transportation requirements. These items are generally the most scarce ones and they take a value of 5.
Most of the chemical compounds and some of the packaging materials are used in the production of several drugs. Therefore, a stock-out occasion related to these items can interrupt the production of many drugs. Commonality is a measure that shows in how many
Figure 2. The Hierarchic Design Used in the Study
different products a particular item is used. One example of common items is starch, which is used in the formulation of most of the pills.
Unit cost is another important criterion in the classification of inventory items. In this study the unit costs are given in dollars because of the high depreciation rate of Turkish Lira.
Stockability represents the difficulty of storing an item. Perishability of the chemical compounds is a major problem in the pharmaceutical industry. The perishable items must be preserved in controlled conditions. Most of the chemical compounds are sensitive to light and moisture so they should be stored in moisture controlled conditions. Moreover, some compounds are sensitive to heat, that requires storage in temperature controlled rooms. Furthermore, the items that require large storage spaces also cause stockability problems.
able 7. The Criteria used in the Study
Index Criterion 1 Unit Price 2 Demand 3 Lead Time 4 Durability ■ 5 Scarcity 6 Stockability 7 Commonality 23
The next step after the determination of the criteria is the construction of the pairwise comparison matrix. The matrix is constructed by the judgments of the Production Planning and Inventory Management Department chief. A questionnaire is used for this purpose.
The determination of the priorities of the criteria and the calculation of consistency indicators are performed by the MCIC - AHP program. This program is generated by H. Altay Güvenir and the details of the usage procedure are provided in Appendix A.
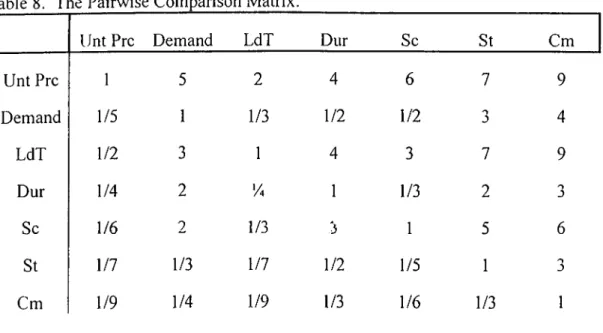
The pairwise comparison matrix constructed by the judgments of the manager is presented in Table 8.
4.4 The Muiticriteria ABC Classification
Table 8. T1le Pairwise Comparison Matrix.
lint Prc Demand LdT Dur Sc St Cm
Unt Prc 1 5 2 4 6 7 9 Demand 1/5 1 1/3 1/2 1/2 4 LdT 1/2 3 1 4 3 7 9 Dur 1/4 2 '/4 1 1/3 2 '■> Sc 1/6 2 1/3 3 1 5 6 St 1/7 1/3 1/7 1/2 1/5 1 J Cm 1/9 1/4 1/9 1/3 1/6 1/3 1
The interpretation of this matrix is as follows. For example, when we consider unit price and demand, we see that unit price is strongly important than demand in order to attain the best ABC classification (The value of al2 is 5 and the value of a21 is 1/5).
The Eigen vector of the matrix is calculated as < 0.377, 0.079, 0.253, 0.083, 0.140, 0.043, 0.025>. Moreover, the consistency indicators are also computed by the MCIC - AHP program.
^max" 7.442 Cl = 0.074 CR =0.056
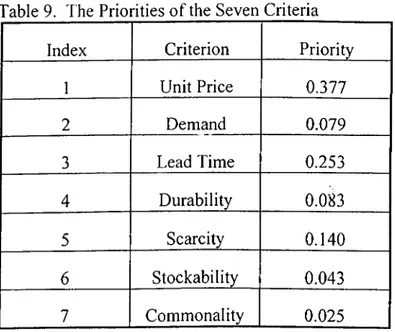
As the value of consistency ratio is less than 0.10 the matrix is considered to be consistent. The priorities of the criteria are calculated by the program as follows;
Table 9. The Priorities of the Seven Criteria
Index Criterion Priority
1 Unit Price 0.377 2 Demand 0.079 3 Lead Time 0.253 4 Durability 0.083 5 Scarcity 0.140 6 Stockability 0.043 7 Commonality 0.025
Finally the weighted scores for each item are computed by the procedure that was explained in section 3.2.5. The scores of every item for each criterion are normalized and the weighted averages of these converted values are taken by using the priorities (weights).
At the last step the items are sorted in descending order according to their weighted averages. The classification of items as Class A, B or C is performed according to the percentages given in Table 1. The first 20% of the items are classified as Class A, and the
subsequent 25% of items are classified as Class B. The list of items that are classified and their classes are given in Appendix B.
4.5 The Comparison of the Results of Traditional and Multicriteria Inventory Classification Methods
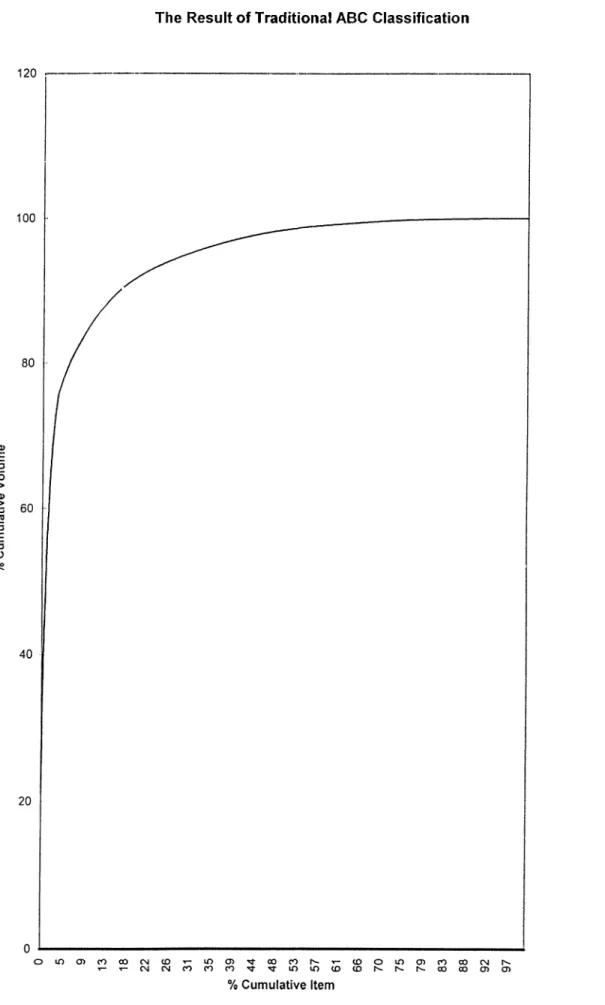
The traditional ABC classification is conducted by sorting the items in descending order according to their annual dollar usages. In order to ensure a good comparison between two methods, the same percentages in the multicriteria analysis are applied. As a result, sixty-four items constitute Class A, eighty items constitute Class B, finally one hundred and sixty-seven items constitute Class C. The graphical representation of the result of traditional ABC classification is shown in Figure 3.
The interviews held by the managers of the company revealed that they were giving more importance to the chemical compounds than the packaging materials because of the reasons in Table 6. The investigation of the results of the multicriteria and traditional ABC classification methods reveals that the former complies better with the ideas of the managers. In the multicriteria method the Class A is constituted of only chemical compounds, and Class C is constituted of only packaging materials. However, in the traditional method both chemical compounds and packaging material are seen in all of the classes.
fable 10. The distribution ol' chemical compounds and packaging material Traditional Method Multicriteria Method Class A 28 Chemical Compound 36 Packaging Material 64 Chemical Compound 0 Packaging Material Class B 19 Chemical Compound 61 Packaging Material 40 Chemical Compound 40 Packaging Material Class C 57 Chemical Compound 119 Packaging Material 0 Chemical Compound 176 Packaging Material 26
The Result of Traditional ABC Classification
Figure 3. The result of Traditional ABC Classification
In the multicriteria classification 20% of the items that constitute Class A, represent 60% of the cumulative score. However, the examination of the results of traditional classification reveals that the Class A items constitute 91% of the cumulative annual dollar usage. The cumulative percentages of items and scores are provided in Table 11.
Table 11. Cumulative Percentages of Items and Weighted Scores
Class % Cumulative % Cumulative % Cumulative
Item Dollar Volume Weighted Score
A 20 91.79 60.18
B 25 5.77 33.65
C 55 2.43 6.15
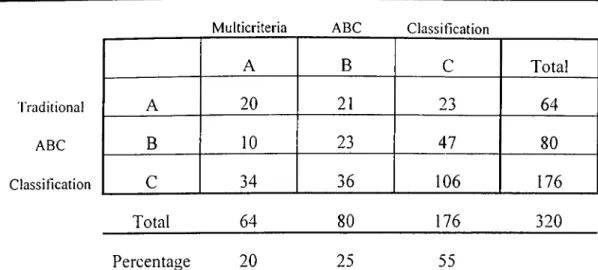
When we examine the number of items that are classified in different groups by the two ABC classification methods we observe that the methods provided very different results. The number of items that are labeled as Class A by both of the methods is only twenty out of sixty- four items. Twenty-one of the items which were classified as Class A by the traditional method are classified as Class B by the multicriteria method, and twenty-three of them are classified as Class C. The same trend is also seen in the Classes B, and C. The number of items that are classified in the same and different groups are shown in Table 12.
Table 12. Comparison of the Results of two ABC Classification Methods.
Multicriteria ABC Classification
A B
c
Total Traditional A 20 21 23 64 ABC B 10 23 47 80 Classificationc
34 36 106 176 Total 64 80 176 320 Percentage 20 2555
28The reason of the different results by the two methods is the usage of seven criteria in the Multicriteria ABC Classification Method, while there is only one criterion in the Traditional method. It is also important to note that the judgments of the managers are incorporated in to the analysis by AHP technique in the multicriteria ABC classification, while in the traditional method the classification is based on annual dollar usage.
4.4 Chi Square Goodness of Fit Test
The aim of this section is to investigate statistically, if the multicriteria inventory classification method can be used in order to conduct an ABC classification. Table 10. is mainly a contingency table, and it involves multinominal count data classified on two dimensions[17j.
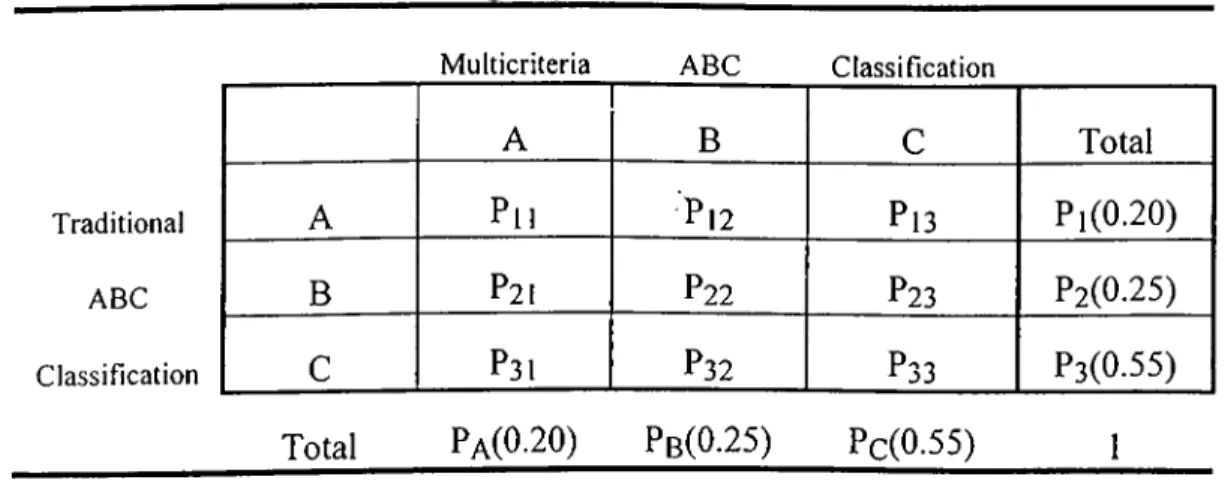
We can reconstruct Table 12. by considering probabilities instead of numbers.
Table 13. Probabilities for Contingency Table
Multicriteria ABC Classification
A B C Total
Traditional A Pll P12 Pi3 Pl(0.20)
ABC B P21 P2 2 P23 P2(0.25)
Classification
c
P31 P32 P33 P3(0.55)Total Pa(0.20) Pb(0.25) Pc(0.55) 1
The total probabilities of each row and column are called marginal probabilities. The marginal probability Pa is the probability that an item will be classified as Class A by Multicriteria ABC Classification. Likewise the marginal probability Pi is the probability that an item will be classified as Class A by Traditional ABC classification.
The aim of this test is to determine if two methods of ABC classification are dependent. In case of independency we know that P(AnB)= P(A)P(B). Under the hypothesis of independency we can conclude that:
Pi i= PiPa Pi2 = PiPb
and so forth.
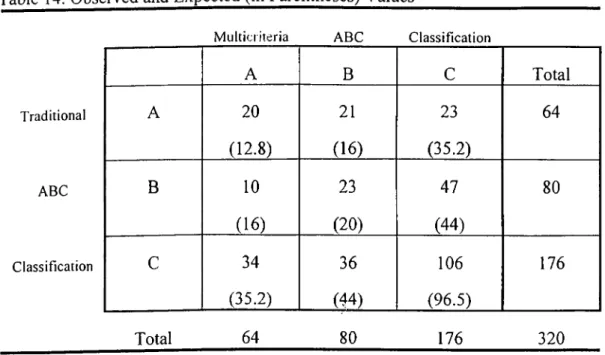
If we multiply the probabilities associated with each cell by the number of items in the inventory we can find the expected values in each cell. The expected values are given in Table 14.
Table 14. Observed and Expected (in Parentheses) Values
Multicriteria ABC Classification
A B C Total Traditional A 20 21 23 64 (12.8) (16) (35.2) ABC B 10 23 47 80 (16) (20) (44) Classification
c
34 36 106 176 (35.2) (44) (96.5) Total 64 80 176 320The hypotheses that we will test are as follows:
Hq: The two methods of ABC classification are independent
The test is undertaken by comparing the observed and expected values by the following formula:
χ2=[ηι 1 - E(ni i)]2 / E(ni i) + [ni2 - E(ni2)]2 / E(ni2) + ... + [033 - E(n33)]2 / E(n33)
Large values of imply that the observed and expected values do not agree and therefore that the hypothesis of independence is false[17]. When we substitute the values in Table 12. to the above formula the result is as follows:
Χ2= 15.1756
For Alpha = 0.05 and degrees of freedom = 4 the hypothesis of independence is rejected since,
15.1756 >9.48773
The null hypothesis is rejected, so we conclude that the two methods of ABC classification are dependent. This result shows that the multicriteria inventory classification method with AHP technique can be used in order to conduct an ABC Classification.
The test is repeated for two times by changing the proportions of Class A, B and C items in the inventory.
In the second study the percentages of items in each class are as follows:
15% of items are classified as Class A (48 items) 30% of items are classified as Class B (96 items) 55% of items are classified as Class C (176 items)
Multicriteria ABC Classification
Table 15. Observed and Expected (in Parentheses) Values for the second study
A B C Total Traditional A 14 18 16 48 (7.2) (14.4) (26.4) ABC B 10 32 54 96 (14.4) (28.8) (52.8) Classification C 24 46 106 176 (26.4) (52.8) (96.8) Total 48 96 176 320 X2 = 15.1126
For Alpha = 0.05 and degrees of freedom = 4 the hypothesis of independence is rejected since,
15.1126 >9.48773
Like the first test the null hypothesis is rejected and it is concluded that the two methods of ABC classification are dependent.
In the third study the percentages of items in each class are as follows:
25% of items are classified as Class A (80 items) 20% of items are classified as Class B (64 items) 55% of items are classified as Class C (176 items)
Multicriteria ABC Classification
Table 16. Observed and Expected (in Parentheses) Values for the third study
A B C Total Traditional A 24 24 32 80 (20) (16) (44) ABC B 14 12 38 64 (16) ( 12.8) (35.2) Classification
c
42 28 106 176 (44) (35.2) (96.8) Total 80 64 176 320 Χ2= 11.0333For Alpha = 0.05 and degrees of freedom = 4 the hypothesis of independence is rejected since,
11.0333 >9.48773
In this test the null hypothesis is rejected, like the two previous tests. So we can conclude that the two methods of ABC classification are dependent and the multicriteria inventory classification method with AHP technique can be used in order to conduct ABC classification.
5. DECISION SYSTEMS FOR INVENTORY ITEMS
In the last decades we have witnessed the emergence of a highly competitive business environment. In this rapidly changing world the companies are compelled to give more importance to the customer satisfaction. They are striving to ensure customer satisfaction by adopting new ideas in a wide range of activities from production to marketing.
One of the most important aspects of customer satisfaction is to provide the demanded products on time. In the case of a stockout, there are two possibilities, backordering or lost sales. However, in our ferociously competitive business environment the possibility of backordering is diminishing. Consequently a stockout of only one item in the inventory is likely to cause lost sales, profit and goodwill for the company.
In order to manage the inventory effectively the answers of the following three questions should be investigated[l].
1) How often should the inventory status be determined? 2) When should a replenishment order be placed?
3) How large should the replenishment order be ?
Continuous review and the periodic review are the answers for the first question. Implementation of the continuous review method ensures the managers to know the stock status at any time. Transactions reporting is a form of continuous review at which the records are updated for each transaction (shipment, receipt etc.).
In the periodic review method the stock status is determined intermittently at every R time unit. There are some advantages and disadvantages of periodic review, when compared to the former one. If periodic review is applied the workload on the staff of the recruitment department is predictable, moreover the possibility of detecting spoilage of slow moving items increases. On the other hand, the advantage of continuous review is that management can provide same level of customer service with less safety stock, compared to the periodic review.
In order to provide answers to the second and third questions, inventory control methods were generated. The four most common ones are described below.
5.1 Order-Point, Order-Quantity (s,Q) System
Management needs to adopt continuous review in order to apply this system. When the inventory position (onhand + on order - backorder - committed) drops to the reorder point s or lower a fixed quantity Q is ordered. When compared to the (s,S) systems this system is a simple one with less likelihood of error. It also ensures the supplier to predict the production requirements.
5.2 Order-Point, Order-up-to-Level (s,S) System
Continuous review is also required for this system. When the inventory position drops to the reorder point s or lower, a quantity is ordered in order to raise the inventory position to the predetermined point S. This system is a complex one, and it requires a substantial computational effort.
5.3 Periodic Review, Order-up-to- Level (R,S) System
This system is applied by raising the inventory position to order up to level S at every R unit of time. The carrying costs are higher in this system than in the continuous review systems.
5.4 (R,s,S) Systems
The inventory position is checked at every R unit of time. If it is at or below the reorder point s than it is raised to the order up to level S. If the inventory position is above the reorder point no action is taken. This system requires a significant computational effort, and it is difficult to understand by the stock clerk.
5.5 Establishing Safety Stocks for Individual Items
Effective inventory management requires the managers to strive with probabilistic demand. When the demand is probabilistic sophisticated methods are required to avoid stockouts. A common approach to avoid stockouts is the establishment of safety stocks. Safety stocks can be established by using different methods.
5.5.1 The Usage of a Common Factor
In this method the safety stock is determined by the usage of a common time supply. For example, an item is ordered when the inventory position minus the forecasted lead time demand falls to the level of one month time supply.
5.5.2 The Usage of Shortage Costs
In order to apply this method, management must find a way to measure the cost of a shortage. This is a challenging task for the management. Some common approaches are stated below.
5.5.2.1 Specified Fixed Cost (Bi) per Stockout Occasion
The basic assumption about this method is that, a fixed cost is associated with each stockout occasion. This cost is not effected from the magnitude and the duration of the stockout.
5.5.2.2 Specified Fractional Charge (B2) per Unit Short
In this approach a fraction of the unit value is assumed to be the shortage cost per item. For example when shortage is prevented by over time production this method may be applicable.
5.5.2.3 Specified Fractional Charge (B3) per Unit Short per Unit Time
The duration of the stockout occasion is also taken in to account in this method.
5.5.3 The Usage of Service Considerations
This method requires the introduction of a constraint called service level. An example of the usage of this constraint may be minimizing the carrying costs of an item, while satisfying 95% of the demand from the stock. Specified ready rate is an other measure of service. It is the fraction of time during which the net stock is positive [1]. Likewise specifying an average time between stockout occasions is an other approach about service considerations.
5.5.4 The Usage of Effects of Disservice on Future Demand
This model makes the future demand a function of the service at the present time. Although it is very difficult to generate the functional form, Peters and Waterman stated that a lot of firms are using this idea implicitly by providing extremely high levels of service to their customers.
5.5.5 The Usage of Aggregate Considerations
The management specifies the safety stocks, using a given budget. They try to provide best possible aggregate service across a population of items [1].
5.6 Establishment of the Value of Reorder Point (s)
The reorder point (s) is determined by the formula below
s = Xg + Safety stock
Where Xg is the forecasted demand over a replenishment lead time, in units.
5.7 Discussion on Class A Items
Class A is constituted of most important items in the inventory. The costs of replenishment, carrying and shortages are substantially high for these items, so they must be controlled tightly. Highly sophisticated control systems are justified because of the relative importance of these items compared to class B, and C.
Decision rules based on mathematical models aid the managers in their efforts to control these items, however managers should also incorporate their knowledge and experience in decision making process. Frequent managerial intervention is necessary due to the high
payoff possibilities. The top management should be informed frequently about the situation of Class A items.
Transactions reporting system is a prerequisite to manage Class A since high safety stocks are substantially costly for this class. Moreover, the possibility of stockout should be decreased by the accurate determination of order point and order quantities.
Effective management of class A items also requires successful forecasting of demand levels. The lead time and its variability are also important and they may be influenced by negotiating with the suppliers.
5.8 Discussion on Class B Items
The items that constitute Class B are the ones with medium importance for the company. The selection of appropriate inventory control method is dependent on the internal and external environment of the particular company in consideration. However, (s,S) system may not be suitable for this class, because of the computational difficulties [1]. Order point, order quantity (s,Q) system may be more appropriate for this class if continuous review is applied.
5.9 Discussion on Class C Items
Approximately 50% of the items are labeled as Class C in the inventory. These are the least important items for the company, however a stockout of these items may cause a delay in the production process.
The carrying and replenishment costs are not high for these items, so management can not attain savings that can justify substantial costs associated with complex inventory control methods. Simple control procedures are applied to these items, and high safety stocks are established in order to avoid stockouts.
6. SUMMARY AND CONCLUSION
Effective inventory management is a prerequisite for success in this highly competitive business environment. The management has to attain a high level of customer service at the lowest possible cost.
In order to achieve this goal items in the inventory should be controlled tightly. Sophisticated inventory management methods ensure the managers to decrease the costs associated with inventory items, while attaining an adequate level of customer service. However, in an inventory there is thousands of items with different characteristics, and costs associated with them. When sophisticated control methods are applied, their cost may be higher than the achieved payoff for some items. So applying highly sophisticated methods to all items in the inventory is not practical, and financially feasible.
ABC classification provides a solution to this problem. It is based on Pareto principle that, a small number of items in a group represents a substantial proportion of the total value of that group. In this method the items in an inventory are classified as Class A, B or C according to their importance. Class A items are the most important ones and they deserve the tightest control, while class C items are the least important items.
The traditional ABC classification uses only one criterion (annual dollar usage) in order to classify the items in the inventory, however management may need to consider more than one criteria in their analysis. Multicriteria inventory classification method enables the managers to use more than one criteria, and to incorporate their judgments in to the analysis.
In this study, both the traditional and multicriteria ABC inventory classification methods are applied to the inventory of a Turkish pharmaceutical company. The multicriteria inventory classification is conducted by the utilization of Analytic Hierarchy Process technique.
In order to apply multicriteria inventory classification method, firstly, the hierarchy for the particular problem is designed. Secondly, the pairwise comparison matrix is constructed, and the priority of each criterion is determined. Thirdly by using the priorities, weighted average of criteria scores for each item are calculated. Finally, the weighted scores are sorted in descending order and items are classified as Class A, B, or C.
The traditional ABC classification method is also applied to the same inventory, and the results of two methods are compared. In this method annual dollar usage is the criteria used in order to classify the items in the inventory.
The chi-square goodness of fit test is conducted in order to test statistically, if the multicriteria inventory classification method can be used in order to conduct an ABC classification. In our original analysis 20% of items were labeled as Class A, 25% of items were labeled as Class B, and 55% of items were classified as Class C. The result of the test was the rejection of the null hypothesis that the two methods of ABC classification were independent. .
The test was repeated for two times, with different proportions of items in each class. In both of the tests the null hypothesis was again rejected. Consequently it was concluded that the multicriteria inventory classification can be used in order to conduct an ABC classification.
The interviews held by the employees and the managers of the Production Planning and the Inventory Management department revealed that they were considering the chemical compounds to be more important than the packaging material. The examination of the results of two ABC classification methods revealed that the multicriteria ABC classification method complies better with the thoughts of the managers, than the traditional method.
Currently the company is not utilizing an ABC analysis, however the usage of this method can help the managers to attain a high level of customer service at the lowest possible cost. The multicriteria ABC analysis should be applied to the inventory of the company immediately, and different levels of controls should be exerted on different classes. The safety stocks, order quantities, and order up to level values should be determined scientifically.
This thesis provides some further research opportunities for the researchers interested in this subject. The multicriteria ABC classification method utilized in this study can be compared with the other multicriteria methods. Moreover, the comparision of multicriteria ABC classification method with the traditional technique can be extended by the application of both methods to different companies and industries.
APPENDIX A
The MCIC-AHP PROGRAM [18]
MCIC-AI'IP (Multicriteria Inventory Classifier using Analytic Hierarchy Process) is a computer program, which is written by H. Altay Güvenir and Nuray Güvenir. The program enables the user to conduct an ABC classification by using both the AHP technique and the traditional method.
The MCIC-AHP program runs on IBM PC compatible computers and is written in the Pascal (Turbo Pascal version 6.0) programming language[18]. The program is consisted of two subprograms called AHP and ABC. The AHP subprogram calculates the priorities and the consistency indices. The user enters the criteria and the pairwise comparisons as inputs. There is an option to save the resulting prioiity vector in to a text file. This file can be used for further calculations.
ABC subprogram uses the priority vector, that was saved in to a text file, and a text file containing the inventory to be classified. There are some requirements for the inventory file in order to be used as input. It must be a text file and each line must correspond to an item. ABC enables the user to conduct a multicriteria classification or a traditional one. The user can also apply both of the classification methods for the same inventory.
A text editor called EDIT is provided in order to enable the user to create or modify the necessary files. The editor is a user friendly menu driven program, which can also be used