ENGINEERING FACULTY
INTERNATIONAL JOURNAL OF FOOD ENGINEERING RESEARCH
(IJFER)
BOSTAN Kamil, Istanbul Aydın University, TR KAHRAMAN Sibel, Istanbul Aydın University, TR
BAYSAL Gülay, Istanbul Aydın University, TR CABA TACER Zeynep, Istanbul Aydın University, TR
ZENGİN Hatice, Istanbul Aydın University, TR ÖZTÜRK Mustafa, Sakarya University, TR CABAROĞLU Turgut, Çukurova University, TR
HALKMAN Kadir, Ankara University, TR MURAT Mehmet, Atatürk University, TR KULA Osman, Adana Bilim ve Teknoloji University, TR
AYAR Ahmet, Sakarya University, TR ÖZPINAR Haydar, Istanbul Aydın University, TR
VARLIK Candan, Istanbul Aydın University, TR
ADVISORY BOARD
Dr. Mustafa AYDIN
Istanbul Aydın University, Istanbul, TR
Honarary Editors
Prof. Dr. Hasan SAYGIN - Istanbul Aydın University, Istanbul, TR
Prof. Dr. Ahmet Metin GER - Istanbul Aydın University, Istanbul, TR
Editor-in-Chief
Prof. Dr. Güner ARKUN
İstanbul Aydın University, Faculty of Engineering
Department of Food Engineering
Florya Yerleşkesi, İnönü Caddesi, No. 38, Küçükçekmece, İstanbul, Turkey
Phone: +90 212 411 61 00
Fax: +90 212 425 57 59
E-mail: [email protected]
Editorial Board
Prof. Dr. Şükrü KARATAŞ -Istanbul Aydın University, Istanbul, TR
Prof. Dr. Jozef L KOKINI - University of Illinois, USA
Prof. Dr. Ali DEMİRCİ -University of Penn State USA
Prof. Dr. Zeynep ÜSTÜNOL -Michigan State University, USA
International Journal of Food Engineering Research (IJFER) is peer-reviewed journal which provides a platform for publication of original scientific research and applied practice studies. Positioned as a vehicle for academics and practitioners to share field research, the journal aims to appeal to both researchers and academicians.
Publication Period
Published twice a year April and October
Academic Studies Coordination Office (ASCO) Administrative Coordinator
Gamze AYDIN
Technical Editor
Merve KELEŞ
ISSN: 2149-5777
April 2017 Year: 3 Number: 1
Printed by
Armoninuans Matbaa Yukarıdudullu, Bostancı Yolu Cad. Keyap Çarşı B-1 Blk. No: 24 Ümraniye/İSTANBUL
Tel: 0216 540 36 11 Fax: 0216 540 42 72 E-mail: [email protected]
Aims and Scope
International Journal of Food Engineering Research (IJFER) is an international , peer-reviewed journal devoted to the publication of high quality original studies and reviews concerning a broad and comprehensive view of fundamental and applied research in food science&technology and their related subjects as nutrition, agriculture, food safety, food originated diseases and economic aspects.
IJFER is an international periodical published twice a year (April and October). The journal is published in both print and electronic format.
Istanbul Aydın University Faculty of Engineering has started to publish an
international journal on Food Engineering, denoted as “International Journal of
Food Engineering Research (IJFER)”. We have especially selected the scientific
areas which will cover future prospective food engineering titles such as Food
Processing, Food Preservation, Novel Technologies, Food Safety, Food Quality
etc. and their related subjects as nutrition, food and health, agriculture, economic
aspects and sustainability in food production.
We have selected only a few of the manuscripts to be published after a peer
review process on many submitted studies. Editorial members aim to establish an
international journal IJFER, which will be welcomed by Engineering Index (EI) and
Science Citation Index (SCI) in short period of time.
Editor in Chief
Prof. Dr. Güner ARKUN
CONTENTS
Investigation of Lead, Cadmium, Arsenic and Mercury in Some Seafood From Black Sea and Marmarasea by ICP-MASS Spectrometry
Gizem İNAL ERDEM, Haydar ÖZPINAR... 1 Chestnut Flour and Applications of Utilization
Merve METE, Dilek DÜLGER ALTINER... 9 The Effect of Processing Technologies on Lycopene in Tomatoes (Lycopersicon esculentum L.) Nahide TÜRÜT, Güner ARKUN...17 Examination of Some Chemical and Functional Properties of Carob and Soy Flours and Usage of Them in Bakery Products
INVESTIGATION OF LEAD, CADMIUM, ARSENIC AND
MERCURY IN SOME SEAFOOD FROM BLACK SEA AND
MARMARA SEA BY ICP-MASS SPECTROMETRY
Gizem İNAL ERDEM
1, Haydar ÖZPINAR
2*Abstract
Over the last 200 year our planet has been under a threat due to industrilization and environmental pollution. Accordingly, all the species living in our environmentally polluted planet is potentially a majör source of health risk. This situation is also directly leading to making the seafood and other species of waterborne is contaminated with the industrial pollutants such as heavy metals. The contaminated foods are suitable for the dissemination of these carcinogenic chemicals through the consumers. Heavy metals are the members of the third or higher rows of the periodic scale. In the present time, there are many heavy metals more than 60 such as lead, cadmium, chromium, cobalt, copper, nickel, mercury and zinc. The objective of this study was to analyze Pb, Cd, Hg, As in a total of 150 seafoods (10 shrimp, 10 calamari, 10 octopus, 10 mussel, 10 acorn, 10 mackerel, 10 coral, 10 sea bream, 10 whiting, 10 sole, 5 horse mackerel, 5 anchovy, 5 sardine, 5 bluefish, 5 gray mullet, 5 turbot, 5 red mullet, 5 coral, 5 bream, 5 butts fish) from Marmara Sea (n=75) and Black sea (n=75) by using Inductively Coupled Plasma-Mass Spectrometer ICP-MS according to the criterias by both Turkish Food Codex Declaration About Maximum Limits of Contaminants in Food Products (Declaration No: 2008/26) and NMKL 186 International method. The results revealed that the lead levels in both horse mackerel (0,385 ppm) and mullet (0,387 ppm) , and the mercury levels in both red mullet (1,707 ppm) and sea bream (1,098 ppm) from the Black sea were found to be higher, whereas the lead levels in both sardine (0,417 ppm) and butts fish (0,843 ppm) from Marmara Sea were higher than the upper limits as declared by Turkish Food Codex. In the mussels collected from Marmara Sea, the cadmium levels were found to be nearly close to the upper limit, which was 1 ppm. Also, it was provided that all the samples contained arsenic. However, no comment was performed since the Turkish Food Codex does not indicate any upper limit for itself. In Conclusion, this study provided that the seafoods collected from both Black sea and Marmara Sea significantly included heavy metals, including lead, mecury, cadmium, and arsenic. This situation leads to a significant foodborne health riskfor the public health and the Turkish consumers.
Keywords: heavy metal, fish, blacksea, cadmium, arsenic, mercury, lead, ICP-MS
1 İstanbul Aydın University, Department of Food Safety and Nutrition
E-mail: [email protected]
2* E-mail: [email protected] (Corresponding author)
1. Introduction
The environmental levels of chemicals have risen steadily with human population growth, urbanization, and continued worldwide industrialization. All these toxic and inevitable polutants adversely affect the species, threat the human health, and lead to a harmful situation which the nature is not able to overcome [1]. The heavy metals are considered to be extremely toxic elements that have negative impacts on
chemical and physiological processes especially in aquatic organisms and humans. There is raising concern regarding the undesired health effects of different metals. Thus, their control, uptake, bioaccumulation, storage and elimination are important for the human health [2].
Heavy metal toxicity can produce serious chronic conditions such as autism, chronic fatigue syndrome, depression, multiple sclerosis, and other
serious disorders [3]. Zinc, copper, chromium, iron and manganese are essential to body function in small amounts. But, if these metals accumulate in the body in higher concentrations, then serious damages can develop. The major heavy metals associated with poisoning of humans are lead, mercury, arsenic and cadmium. Heavy metal poisoning may occur as a result of industrial exposure, air or water pollution, and foods [4]. Excessive accumulation of dietary heavy metals such as Cd, Cr, and Pb in the human body may be a result of consumption of fishes and other seafoods [5-7]. Seafood is a valuable food in the human nutrition because it consists of protein, fats, vitamins, and minerals. Therefore, seafood has numerous health benefits. For example, recent studies have indicated that regular consumption of seafood can decrease the risk of heart attack, stroke, obesity, and hypertension. Seafood also provides essential nutrients such as omega-3 fatty acids [8].
In the recent years, the levels of heavy metals in fish have been investigated in different parts of the world. Most of these studies concentrated mainly on the heavy metals in muscles, liver, kidneys, heart, gonads, bone, digestive tract and brain [9,10]. Official regulatory institutions of many countries are responsible for inspection of seafood products for heavy metal residues, also including checks for proper labeling and documentation, sensory evaluations (e.g., visual, olfactory), and laboratory screening for other contaminants such as PCBs, toxins, and microbial pathogens [7,11]. Maximum levels have been set for certain contaminants in order to protect public health in the EU in the year 2006 (EU Commission Regulation: 852/2004/EC, 853/2004/EC, 854/2004/EC ve 882/2004/EC), as well as the guidelines set down by the Ministry of Agriculture, Fisheries and Food, the Turkish Food Codex in Turkey as of 2010 [12,13].
In this study, we investigated Pb, Cd, Hg, As in a total of 150 seafoods (10 shrimp, 10 calamari, 10 octopus, 10 mussel, 10 acorn, 10 mackerel, 10 coral, 10 sea bream, 10 whiting, 10 sole, 5 horse mackerel, 5 anchovy, 5 sardine, 5 bluefish, 5 gray
mullet, 5 turbot, 5 red mullet, 5 coral, 5 bream, 5 butts fish) from Marmara Sea (n=75) and Black sea (n=75) by using Inductively Coupled Plasma-Mass Spectrometer ICP-MS according to the criterias by both Turkish Food Codex Declaration About Maximum Limits of Contaminants in Food Products (Declaration No: 2008/26) and NMKL 186 International method.
2. Material and Methods
Sampling
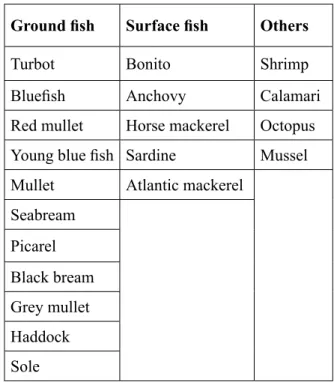
During the year 2015, a total of 150 seafoods (10 shrimp, 10 calamari, 10 octopus, 10 mussel, 10 acorn, 10 mackerel, 10 coral, 10 sea bream, 10 whiting, 10 sole, 5 horse mackerel, 5 anchovy, 5 sardine, 5 bluefish, 5 gray mullet, 5 turbot, 5 red mullet, 5 coral, 5 bream, 5 butts fish) from Marmara Sea (n=75) and Black sea (n=75) was collected. The samples were taken to the laboratory in the a sample carry case (JPB, UK) at 4°C. Then, the analysis was started in the same day (Table 1).
Table 1. Sampling data
Ground fish Surface fish Others
Turbot Bonito Shrimp
Bluefish Anchovy Calamari
Red mullet Horse mackerel Octopus Young blue fish Sardine Mussel Mullet Atlantic mackerel
Seabream Picarel Black bream Grey mullet Haddock Sole
Sample preparation
The collected samples were initially homogenized using blender (Interscience, Germany). Subsequently, the homogenized sample was burned in a microwave device (CEM, USA) before the analysis in the Coupled Plasma-Mass Spectrometer (ICP-MS). A 0.2-0.5 g of the burned sample was weighed (MS104TS Mettler Toledo, Turkey) in a vessel. Then, 5 ml of Nitric acid (HNO3) (Merck, Turkey) and 2.5 ml hydrogen peroxide (H2O2) (Merck, Turkey) were pipetted into the sample, respectively. The mixture was then re-burned in microwave device for 70°C/15 min, 85°C/10 min, 105°C/10 min, 110°C/5 min, 120°C/5 min, and finally 130°C/5 min, respectively. After that, the vessel was allowed for cooling in the room conditions for a while. After cooling, the solution in the burned vessel was transferred to a 25 ml flask. Then, deionized water was poured on to it till the final volume in the flask became 25 ml.
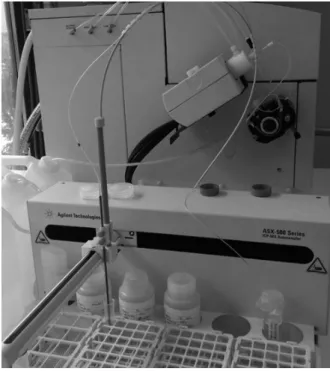
Analysis of Pb, Cd, Hg, and As by ICP-MS The analysis of Pb, Cd, Hg, and As in the seafood samples was performed by using ICP- MS Agilent 7700X (Agilent, Turkey) according to the Guidelines of NMKL 186 (2007) instructions. Before starting the analysis, calibration blank solution, calibration standards, sample blank, control standards, and control samples were all prepared accordingly. Then, a 10 ml of the solution in the 25 ml flask was put into a 10 ml propylen tube. All the solutions were placed in to the ICP-MS device. The reading was started, completed, and the results were automatically processed by the software.
Figure 1. ICP-MS device 3. Results
In this study, a total of 150 seafood samples from Marmara Sea (n=75) and Black sea (n=75) was analysed for the presence of Pb, Hg, Cd and As by using ICP-MS device according to the Guidelines of NMKL 186 (2007) procedures.
Heavy metal levels in the analyzed seafood samples from Black Sea
The Hg level in red mullet (1.707 ppm>1 ppm) and black bream (1.098 ppm>0,5 ppm), and the Pb level in Horse mackerel (0.358 ppm>0.3 ppm) and mullet (0.387 ppm>0.3 ppm) were found to be higher than the limits declared by the Turkish Food Codex. It was also determined that all the fish samples from Black Sea included As higher than the limit given by the China (0.15 ppm). Also, Hg was not detected in the other seafoods such as shrimp, calamari, octopus, and mussel samples, while the average levels of Cd, Pb, and As were found as 0.245 ppm, 0.347 ppm and 32.932 ppm, respectively. These data were seen to be lower than the upper limits of Turkish Food Codex, excluding the As level given as 0.15 ppm by China.
Heavy metal levels in the analyzed seafood samples from Marmara Sea
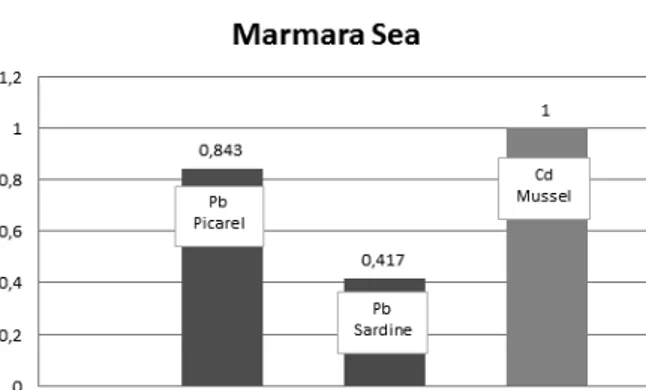
The Pb level in sardine (0.417 ppm>0.3 ppm) and picarel (0.843 ppm>0.5 ppm) were found to be higher than the limits declared by the Turkish Food Codex. It was also determined that all the seafood samples from Marmara Sea included As higher than the limit given by the China (0.15 ppm).
However, Hg was not detected in the other seafoods such as shrimp, calamari, octopus, and mussel samples, while the average levels of Cd, Pb, and As were found as 0.384 ppm, 0.440 ppm and 30.824 ppm, respectively. Only mussel samples contained Cd close to the upper limit by the Turkish Food Codex as 1 ppm.
Overall results
The results, higher than the upper limits of the Turkish Food Codex and China, belonging to the levels of heavy metals present in the analyzed seafoods were tabulated in Table 2 and Figure 2. Accordingly,
Table 2. The levels exceeding the upper limits in
the analyzed seafoods
Origin Ground/Surface Type (ppm)Hg (ppm)Cd (ppm)Pb As (ppm)
Black Sea Ground fish Red mullet 1.707 - -All above Chineese limit 0.500 ppm Mullet - - 0.387 Black bream 1.098 - -Surface
fish Horse mackerel - - 0.358
Marmara Sea Ground fish Picarel - - 0.843 Surface fish Sardine - - 0.417 Others Mussel - 1.000
Figure 2. Comparison of overlimit results of the
seafoods from Black Sea and Marmara Sea
4. Discussion and Conclusions
In this study,we investigated the presence of major heavy metals such as Hg, Pb, Cd and As in a total of 150 seafood samples from Marmara Sea (n=75) and Black sea (n=75) by using ICP-MS device according to the Guidelines of NMKL 186 (2007) procedures.
The results revealed that Hg level in red mullet (1.707 ppm>1 ppm) and black bream (1.098 ppm>0,5 ppm), and the Pb level in Horse mackerel (0.358 ppm>0.3 ppm) and mullet (0.387 ppm>0.3 ppm) from Black Sea, and that in sardine (0.417 ppm>0.3 ppm) and picarel (0.843 ppm>0.5 ppm) from Marmara Sea were found to be higher than the limits declared by the Turkish Food Codex. All the fish samples were found to be contaminated with As over the upper tolerable limit as 0.15 ppm by China. The other seafoods such as shrimp, calamari, octopus, and mussel were free of Hg, and had low levels of Pb and Cd except for the mussel samples from Marmara Sea (1 ppm). The
As levels in all other seafoods were significantly higher than the upper limit set out by China. Heavy metals are significant environmental pollutants and their toxicity is an increasing issue significant for ecological, evolutionary, nutritional and environmental reasons. Various public health measures are undertaken to control and prevent metal toxicity at various levels, such as occupational exposure, accidents and environmental factors. Thus, metal toxicity is dependent on the döşe and duration of exposure, i.e. acute or chronic. [14].
Arsenic (As) is a protoplastic poison. It affects primarily the sulphydryl group of cells causing malfunctioning of cell respiration, cell enzymes and mitosis[15-17]. Lead (Pb) creates toxicity in living cells in the organisms following ionic mechanism and that of oxidative stress [18]. Mercury (Hg) is extremely toxic element and bioaccumulative[18]. Cadmium (Cd) is the seventh most toxic heavy metal as per ATSDR ranking [19,20].
The literature has showed that the level of As in foods ranges from 0.020 to 0.140 ppm. An adult person may be exposed to 0.050 ppm As a day. The Environmental Protection Agency of the United States of Amerika (EPA) issued some upper limits for As in the year 2006. According to the criteria, this limit in water has been restricted with 0.010 ppm. However, there has been no limit for water in Turkey yet. Similarly, many countries have not set down any limit for major heavy metals in all types of foods. For instance, the limit for As in water in the USA was set as 0.010 ppm while it has not been made for other foods. China has determined the upper limit for As in water as 0.150 ppm. The United Kingdom ruled 1 ppm for As in infant foods (rice products) for those younger than 54 months. In the New Zealand and Austrilia, a STO also known as EOS published a report dated on the year 2012 regarding the upper acceptable limits for As in fish and other seafoods as 2 ppm, respectively (http://ecan.govt.nz/publications/Reports/heavy-metals-fish-shellfish-2012-survey.pdf). Based on
this reference value, our fish samples from the Black Sea ranged in between 0.729-68.288 ppm whereas those for the Marmara Sea was in a range of 0.504-65.554 ppm. The highest As levesl were found in shrimp, calamari and octopus samples. Among the analyzed fish samples the highest frequency for As was detected as 30.682 ppm in the red mullet samples only from the Black Sea. As compared to the international upper limits for As, our samples were highly contaminated with As. Lead metal causes toxicity in living cells by following ionic mechanism and that of oxidative stress [21]. Our study provided that the Pb leves in the samples from Black Sea and Marmara Sea were 0-0.539 ppm and 0-0.843 ppm, respectively. According to our results, the seadfoods from Marmara Sea included Pb higher that Black Sea. Among the analyzed foods, the other seafoods such as shrimp, calamari, octopus and mussel had reasonable Pb levels less than the limits as declarated by Turkish Food Codex, except for As levels as compared to China’s limit (0.15 ppm). On the other hand, mullet (0.387 ppm) and horse mackerel (0.385) from Black Sea, and sardine (0.417 ppm) exceed over the tolerable upper limit of Pb (0.300 ppm). Our study revealed that the Marmara Sea was exposed to a much Pb pollution worse than Black Sea. These foods are concern of a public health risk for the consumers.
Our study indicated that the Hg leves in the examined seafoods exhibited interesting differences. Amon the samples from Marmara Sea the Hg levels were ranged in 0 to 0.564 ppm. The average of these measurements were higher than the acceptable level as given by the Turkish Food Codex. The fishes which contained Hg higher than the limits were determined to red mullet (1.707 ppm) and black bream (1.098 ppm). However, any Hg was not detected in shrimp, calamari, octopus and mussel samples. According to the statistical facts issued by American Food and Drug Administration (FDA), our samples had the Hg higher than the limits by FDA and other international authorities.
Our study showed that all the analyzed seafoods did exhibit any potential risk for the consumers because the Cd leves among all the samples were less than the tolerable level as declared by the International authorities, as well as the Turkish Food Codex. The Cd leves in Black sea and Marmara sea were given as 0-0.626 ppm and 0-1 ppm. The highest level was observed as 1 ppm in the mussel samples collected from Marmara sea. In conclusion, we showed that certain fish samples and other seafoods from Black sea and Marmara sea included harmful heavy metals such as Pb, Cd, Hg and As in a various levels of contamination. Thus, the consumers are under rish if they consume them in excesss amounts.
CONFLICT OF INTEREST
The authors declare that there are no conflicts of interest.
REFERENCES
[1] Kayhan FE. (2006): Su Ürünlerinde Kadmiyumun Biyobirikimi ve
Toksisitesi. E.U. Journal of Fisheries & Aquatic Sciences, 23, 1-2, 215–220. [2] Çağlanırmak N., Hepçimen A.Z.
(2010): Ağır Metal Toprak Kirliliğinin Gıda Zinciri ve İnsan Sağlığına Etkisi. Akademik Gıda, 8,2, 31-35.
[3] Kaya Y., Duyar HA., Erdem ME. (2004): Balık Yağ Asitlerinin İnsan Sağlığı İçin Önemi. E.U. Journal of Fisheries & Aquatic Sciences, 21,3-4, 365-370. [4] Oehlenschlager, J. (2000): Identifying
Heavy Metals in Fish. In: Safety
and Quality Issues in Fish Processing (Ed. Bremmer, H.A.) pp. 95-108. Woodhead Publishing Limited. Cambridge, England.
[5] Charya NS, Kamalaa CT, Rajb DSS. (2008): Assessing risk of heavy
metals from consuming food grown on sewage irrigated soils and food chain transfer. Ecotoxicology and Environmental Safety, 69,3, 513–524. [6] ÖİKR. (2014): T. C. Kalkınma
Bakanlığı Onuncu kalkınma Planı Su Ürünleri 2014-2018, ISBN 978-605- 4667-67-3, Ankara.
[7] Bat L, Kaya Y, Öztekin HC. (2014): Heavy Metal Levels in the Black Sea Anchovy (Engraulis encrasicolus) as Biomonitor and Potential Risk of Human Health. Turkish Journal of Fisheries and Aquatic Sciences, 14: 845-851.
[8] Cabré E, Mañosa M, Gassull MA.(2012): Omega-3 fatty acids and inflammatory bowel diseases - a systematic review. Br J Nutr, 107, Suppl 2, 240–252.
[9] Levesque H.M., Moon T.W.., Campbell P.C.G., Hontela A. (2002): Seasonal variation in carbohydrate and lipid metabolism of Yellow perch
(Perca flavescens) chronically exposed to metals in the field. Aquatic Toxicol, 60,257-267.
[10] El-Moselhy Kh.M., Othman AI, Abd El-Azema H et al. (2014):
Bioaccumulation of heavy metals in some tissues of fish in the Red Sea, Egypt. Egyptian Journal of Basic and Applied Sciences, 1,2, 97–105.
[11] Savaş H. (2010): Kaynağından sofraya su ürünlerinden gıda güvenliği.
YUNUS Araştırma Bülteni Yıl 10 Sayı 1 Mart 2010.
[12] Love DC, Rodman S, Neff RA, et al. (2011): Veterinary Drug Residues in Seafood Inspected by the European Union, United States, Canada, and
Japan from 2000 to 2009. Environ. Sci. Technol.,45,7232–7240.
[13] Jaishankar M, Tseten T, Anbalagan N et al. (2014): Toxicity, mechanism and health effects of some heavy metals. Interdiscip Toxicol, 7, 2, 60–72. [14] Francesconi K.A., Kuehnelt D. (2004):
Determination of arsenic species: a critical review of methods and applications, 2000-2003. Analyst., 129,5,373-395.
[15] Guha Mazumder DN (2008): Chronic arsenic toxicity & human health. Indian J Med Res. 128, 4, 436-447. [16] Choi BS, Choi SJ, Kim DW et al.
(2010): Effects of repeated seafood consumption on urinary excretion of arsenic species by volunteers. Arch Environ Contam Toxicol. 58,1,:222-229. [17] Wadhwa N, Mathew BB, Jatawa S et
al. (2012): Lipid peroxidation:
mechanism, models and significance. Int J Curr Sci.3, 29–38.
[18] Chen CW, Chen CF, Dong CD. (2012): Distribution and Accumulation of Mercury in Sediments of Kaohsiung River Mouth, Taiwan. APCBEE
Procedia. 1, 153–158.
[19] Järup L. (2003): Hazards of heavy metal contamination. British Medical Bulletin, 68, 167–182.
[20] Irfan M, Hayat S, Ahmad A et al. (2013): Soil cadmium enrichment: Allocation and plant physiological manifestations. Saudi J Biol Sci.20,1,1-10.
[21] Hosseini SV, Sobhanardakani S,
Miandare HK et al. (2015): Determination
of toxic (Pb, Cd) and essential (Zn, Mn) metals in canned tuna fish produced in Iran. J Environ Health Sci Eng. 13,59. DOI 10.1186/s40201-015-0215-x.
BIOGRAPHIES OF AUTHORS GİZEM İNAL ERDEM
Gamze Benlikurt received her B. Sc. in Food Engineering Department. Following that, she completed her M.Sc. degree in Food Safety Department of İstanbul Aydın University in İstanbul, Turkey. In her thesis study, she intestigated the presence of some major heavy metals in fish and other seafoods by using ICP-MS according to the Guidelines by NMKL 186 (2007).
HAYDAR ÖZPINAR
Prof. Dr. Haydar Özpinar received his veterinary degree from Ankara University in Turkey in 1978. That same year he began to work as research assistant in Istanbul University. Soon after he received a Ph. D. scholarship from German Academic Exchange Program DAAD, and in 1984 he finished his Ph. D. at the Department of Nutrition Physiology of Ludwig Maximilians University in Munich, Germany. After that, he returned to the Department of Nutrition and Nutritional Disease at Veterinary Faculty of Istanbul University. During his scientific career he received quite a few scholarships including those from European Union, DAAD, Alexander von Humboldt Foundation and USA Fulbright. In 2004, he achieved a Fulbright scholarship, and went to University of California Davis, CA, USA. Until 2008, he studied in nutrition, immunology and genetics. He was also involved in a NIH Project. He is currently the director of Institute of Natural and Applied Sciences, a full-time faculty member at Food Engineering Department of Istanbul Aydın University, and also Chair of Food Safety Department.
1. Introduction
Enrichment of foods is the addition of one or more nutrition items that are insufficient or absent and is to improve the properties. Research for the investigation of functional, nutritious and sensory quality of properties is increasing day by day. Main purpose of the production of food is to provide people with healthy and happy lives delivering safe and high nutrition value foods. Recent adaptation of people for a healthy and balanced life style and increased awareness have added strength to improvements in functional food market.
Therefore, there are studies going on for development of alternative flour additives and for usage of them in foods. Beyond supplying needs
of basic nutrition items in the body, foods or food components that provide additional benefits to human physiology and metabolic functions and that are more affective in succeeding a healthier life should be produced. In the food industry, many studies have been carried out, especially on production of cereal-based functional foods. In this review, chestnut flour, limited in production and used for product development, and studies for its usage are were discussed.
Chestnut fruit and its properties
Chestnut is a closed-shell fruit of trees that form
Castanea genus from the Fagaceae family and
forming the edible seeds of this trees. Leaves of chestnut are a bit stiff, the edges are saw tooth shaped and these teeth have thorns. Being 1 Istanbul Aydın University, Graduate School of Natural and Applied Sciences, Department of Food Engineering, Istanbul/
TURKEY, [email protected]
2* Corresponding author: Istanbul Aydın University, Faculty of Engineering, Department of Food Engineering, Istanbul/ TURKEY,
CHESTNUT FLOUR AND APPLICATIONS OF UTILIZATION
Merve METE
1, Dilek DÜLGER ALTINER
2*Abstract
In recent years, with the increasing of people’s interest in nutrition and health subjects, importance of nutrition has been increased steadily and number of studies on enrichment of foods and production of functional products have been increased. Enrichment of foods is one of the developed applications for solution of health problems which are likely to be seen in society. For this purpose, various foods having various properties are being developed with the use of different fruits and vegetables’ flours.
Chestnut has a rich nutrition items, it has been used since previous times in nutrition and in daily diets due to being grown at natural conditions as well. Basically, being composed of carbohydrate, water, and a very low amount of fat, chestnut shows cereal features rather than fruit. When grinded, chestnut becomes a light-colored flour. This flour is used in puddings, bakery products, and production of bread, breakfast cereals, soup and sauces.
In food industry, there are intensive studies on the production of especially cereal products with different wheat flour and different flour additives. In the light of these studies, some Europe countries, mainly in Italy, especially use of chestnut is being widespread in commercial scale in the production of biscuit, breakfast cereal, muffin and dessert. Instead of wheat flour chestnut flour is used or added in different substitution rates. Within the scope of this review, properties of chestnut fruit, nutritional facts of chestnut, chestnut flour and properties, utilization of chestnut flour in food industry were discussed.
members of the Fagaceae family, chestnuts (Castanea) can live for many years and reach up to 30-35 meters in length (Subaşı, 2004; Atasoy and Altıngöz, 2012).
Figure 1. Chestnut fruit
Cool, moist and temperate place are growing areas for chestnut fruit. Therefore, Asia (China, Korea, Japan), Turkey, South Europe and North America are substantial places for production (Bodet et al., 2001). Turkey is one of the substantial areas of chestnut, and it is spread more likely in Aegean, Mediterranean and Black sea regions (Soylu, 1984; İnkaya, 2008).
Being grown completely in natural conditions and an organic food item, chestnut has been an irreplaceable part of our nutrition list. That is why chestnut tree, in some regions, is known as “the bread tree” due to high nutrition value of its fruit (Bounous et al., 2000; İnkaya, 2008). Fresh chestnut has primarily starch and various polysaccharides, fiber materials with high quality, protein, fat in low amount, various mineral materials, B1, B2 and C vitamins. It also contains potassium, phosphorus, magnesium, chlorine, iron, sodium minerals, too (Sachetti et al., 2004; Chenlo et al., 2007).
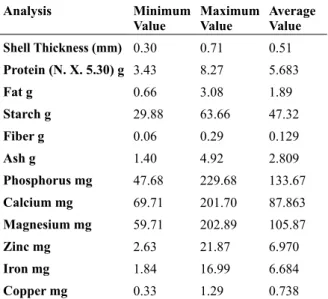
Following is the composition of chestnut fruit grown in Turkey (Table 1).
Table 1. Composition of chestnut fruits grown
in Sinop-Erfelek Region of Turkey (in 100 gr) (Subaşı, 2004)
Analysis Minimum
Value Maximum Value Average Value
Shell Thickness (mm) 0.30 0.71 0.51 Protein (N. X. 5.30) g 3.43 8.27 5.683 Fat g 0.66 3.08 1.89 Starch g 29.88 63.66 47.32 Fiber g 0.06 0.29 0.129 Ash g 1.40 4.92 2.809 Phosphorus mg 47.68 229.68 133.67 Calcium mg 69.71 201.70 87.863 Magnesium mg 59.71 202.89 105.87 Zinc mg 2.63 21.87 6.970 Iron mg 1.84 16.99 6.684 Copper mg 0.33 1.29 0.738
Chestnut fruit, in general has 40-45% water, 3-6% protein, 3-5% fat, 40-45% carbohydrate, 1.3% ash. However, these values may vary based on the ecological conditions, type, genus and process (Soylu, 2004). In the following Table 2, composition of chestnut fruit in different conditions and nutrition items are illustrated (Subaşı, 2004; Atasay and Altıngöz, 2012).
Table 2. Composition of chestnut fruit in
different conditions and nutrition items (in 100 g) (Subaşı, 2004; Atasay and Altıngöz, 2012)
Analysis Fresh Dried Fried Scalded Flour
Carbohydrates 34 57.8 39.0 24.4 63.6 Sugars 9.6 16.1 10.7 7.5 23.6 Starch 24.4 41.7 28.3 16.9 40 Fiber 7.3 13.8 8.3 5.4 14.2 Soluble 0.6 1.1 0.7 0.6 1.0 Insoluble 6.7 12.7 7.6 4.8 13.2 Protein 3.2 6.0 3.7 2.5 6.1 Fat 1.8 3.4 2.4 1.3 3.7 Moisture (%) 52.9 10.1 42.4 63.3 11.4 Calori (kcal) 160 287 200 120 343
Even though in stiff-shell fruits the fat content is high, in chestnut carbohydrate content is high. In their study, Ertan and Kılınç (2005) found carbohydrate values between 24.53 and 31.56 g/100g. Some researchers found carbohydrate contents, based on the genus of chestnut, as in the range of 71.68-88.10 g/100g (Bounous et al., 2000, Kunsch et al., 1999, McCarthy and Meredith, 1988; İnkaya, 2008).
In another study, sugar and starch rates are found as 60-70% and 20-30%, respectively (De La Montaña-Míguelez et al., 2004, Moreira et al., 2012). Most of the sugar content constitutes saccharose and saccharose contents of different varieties are found generally 8-20 g/100g (Künsch et al., 2001; Senter et al., 1994).
Neri et al., (2010), starch content in fresh chestnut is around 71% and sugar (especially sucrose, glycose, fructose) content is varying between 9.2 and 23%. While starch in the fruit releases its unique taste when cooked, sugars provide the sensory properties to be felt (Riberio et al., 2007; Miquelez et al., 2004).
Pereira Lorenzo et al. (2006) investigated that chestnut has a lower but a high-quality fat content compared to other nuts. Yang et al. (2015) revealed that the content in 10 different chestnuts grown in China is 4.3-10.2% while Neri et al. (2010) investigated that the fat content is varying between 3.27-4.15% in a chestnut genus grown in Italy. Besides of this, chestnut has significant fatty acids in addition to low fat content. In a conducted study, researchers determined 7 different organic acids in chestnut. These are citric acid, oleic, oxalic, quinic, ascorbic, cis-aconitic and fumaric acids Ribeiro et al., 2007). These organic acids are stated as beneficial for human health due to their antioxidant capacities.
Minerals are significant in healthy and balanced nutrition. Chestnut is a significant food item in terms of potassium while it contains minerals like iron, calcium, magnesium, manganese, potassium, phosphorus and zinc. In a conducted study, it
was investigated that the amount of potassium in chestnut is between 473 and 974 mg/100g. Phosphorus is the second most important mineral in chestnut and its amount is between 104 and 148 mg/100g in chestnut. Potassium is an essential mineral for protein synthesis while it provides liquid balance in the body. Phosphorus is an important mineral in terms of development of bone and tooth (İnkaya, 2008).
Künsch et al. (1999) determined the calcium amount as 0.017-0.033% and phosphorus as 0.050-0.068% in their study. Calcium is a co-mineral for the use of iron in the body and for the diffusion of foods across cell membrane.
Magnesium content of chestnut is varying between 63 and 93 mg/100g while calcium is varying between 41 and 51 mg/100g (Bounous ve diğ., 2000, Ferreira-Cardoso ve diğ., 1993; Neri ve diğ.,2010). Magnesium is a significant mineral playing a role in the relaxation of neural system and muscles.
Chestnut is one of the most fiber-containing nuts. Fresh chestnut contains 8-10 g/100g fiber material (Anonymous, 2016a). Dietary fibers, as well as their functional and technological properties, are the components that have protecting effects on diseases such as diverticulum, constipation, colon cancer, obesity, diabetes and cardiovascular (Dülger and Şahan, 2011).
Chestnut flour is being used widely in cake, cookie, pasta, milky pudding products, bread, breakfast cereals, soups, sauce and gravies. As a result, interest in chestnut is increasing day by day due to the potential effects of it on nutrition quality and health.
2. Chestnut flour production
Chestnut flour is gluten-free flour that does not contain additive addition, is prepared naturally, by freeze drying or scalding drying methods (Seferoğlu, 2012).
Figure 2. Chestnut Flour
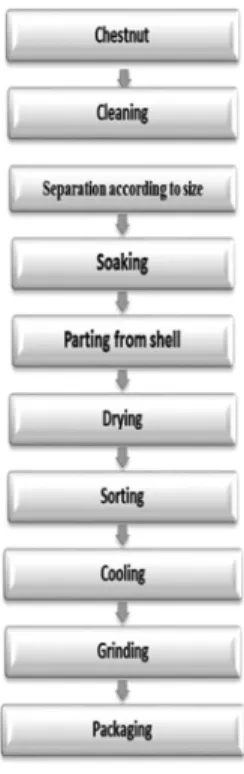
In the first step of chestnut flour production, chestnuts are cleaned and separated with respect to their sizes (Figure 2). They are immersed in water for 1 day. Therefore, they easily peeled from their shells. The grinding process is performed after softened chestnuts are separated from the shells by the steam pressure system. Drying process is performed in low-temperature drying ovens so that nutrition values in chestnuts are not affected. Following the drying process, cooling process is performed at room temperature and flour is sifted through appropriate-sized sieves and the packaging process is started. Storage is done at normal conditions (+4°C) (İnkaya, 2008).
Figure 3. Chestnut flour production steps
3. Chestnut flour and studies for utilization
Chestnut flour can be used for celiac patients due to being gluten-free as well as its nutritious properties. Some researchers investigated that chestnut flour can be used as an alternative to cow milk in the preparation of dessert and soups that are suitable for kids since lactose in cow milk has allergic effects for kids. Chestnut flour also can be used in the preparation of milky puddings, bread, baby formulas, pasta, flakes (corn flakes) (Anonymous, 2016b).
Chestnut flour contains high protein content, high amount sugar (20-32%), starch (50-60%), dietary fiber 10%), essential amino acid (4-7%), and low amount fat (2-4%). Also it is rich in vitamins B, C and E and potassium, magnesium and phosphorus (Sacchetti et al., 2004; Chenlo et al., 2007). The use of chestnut flour is thought to be beneficial at this stage since most of the gluten-free products are insufficient in terms of vitamin B, iron and fibers (Seferoğlu, 2012).
There are not many literature sources about chestnut flour. Mert (2012) in the study aimed to produce higher quality gluten-free wafer by mixing rice-corn flour, rice-buckwheat, and rice-chestnut flour in different rates (80:20, 60:40, and 40:60). Chestnut flour is also used in gluten-free bread preparation due to its nutritional value enhancing effect. In a study for preparation of gluten-free bread, Demirkesen et al. (2010) investigated that chestnut flour contains 10.79% moisture, 47.80% starch, 21.51% sugar, 9.50% dietary fiber, 3.80% fat, 4.61% protein and 1.99% ash. In the study, using some gums and emulsifiers as well as chestnut and rice flour in different portions (0/100, 10/90, 20/80, 30/70, 40/60, 50/50 and 100/0), gluten-free bread was prepared. Rheological, cooking and sensory properties of the bread samples were examined. As a result, it was investigated that the sample 30%/70% chestnut/rice flour mixture has the best cooking property.
In another study, aiming gluten-free bread production, chestnut flour was used and
some physical and chemical properties were investigated during storage. Using chestnut flour in bread samples prepared using gluten-free flours, decreased the volume, and caused hardness inside of the bread but hardly enough in the bread’s crust. In addition, in the both bread samples doped by 10% and 20% chestnut flour additives, the antioxidant capacity increased and especially in 20% doped sample an increased was observed in the amount of insoluble dietary fiber. Moreover, chestnut flour provides more stability during the storage protecting the color property of the bread (Pacuilli et al., 2016).
Sacchetti et al. (2004) increased the use of chestnut flour in snacks and similar products and stated that chestnut flour is appropriate for extrusion products. In addition to this, in the study it is mentioned that chestnut flour can be used as functional component in those products and addition of chestnut flour to cereal-based foods is thought to increase some nutritional contents (high dietary fiber, lysine, γ-amino butyric acid, E and B group vitamins), physical properties (textural, density, color) and sensory properties.
Dokic et al. (2014), in their study on the sensory effects of use of chestnut flour additive to cookies, investigated chemical, textural and color properties. They identified that texturally addition of chestnut flour to cookies increased the hardness, and about the color property they reported that luminescence (L) values decreased while red (a) and yellow (b) values increased. Moreover, it was reported that the quality properties of addition of 20% chestnut flour are similar in quality with that of control sample.
İnkaya (2008) in his study produced chestnut flour by freeze drying and scalding the chestnut samples obtained from 3 different provinces (Aydın, Bursa, Kütahya) and used it in three different portions (10, 20, 30%) in biscuit production. It was reported that spreading rate and hardness values of biscuits doped with freeze-dried chestnut flour are higher than that of scalding-dried chestnut flour doped biscuits. Moreover, in the study it was
reported that chestnut flour prevents the spreading rate in especially reduced-fat biscuits and addition of chestnut flour is appropriate flour for the production of standard and reduced-fat biscuits in terms of quality and sensory properties.
Seferoğlu (2012) examined sensory properties of gluten-free cake, bread and biscuit obtained for celiac patients by using chestnut flour in different proportions (20%, 40%, 80% and 100%). As a result of the study, it was reported that chestnut flour is a significant product for utilization in the production of cake, bread and biscuit and the acceptability of it is fairly high in terms of sensory properties. Healthy individuals and celiac patient participated in the study. In both groups, it is mentioned that the sensory scores of products obtained from chestnut flour are higher. In addition, at the end of the study, it is determined that chestnut flour is a delicious product that can be used in the production of cake, bread and biscuit and by mixing with other gluten-free flours to use is it even more appropriate for the general acclaim and cost. Celiac disease (CD, gluten enteropathy) is identified as proximal small intestine disease which is a permanent intolerance mainly against gluten in wheat and other cereals proteins similar to gluten in such cereals like barley, rye, oat in genetically sensitive individuals (In order to contribute to the treatment of this disease by diet, instead of the flours of these cereals different fruit and vegetable flours should be produced).
Dietary fibers, due to many positive effects of them on health, after determination of technological and physical properties, are lately being used to develop some desired properties in foods. Besides, dietary fibers are the main components of today’s diet products due to low energy values and causing the feel of fullness. In addition to this, ability of dietary fiber to regulate blood sugar, to decrease the level of cholesterol, to be protective against constipation, obesity, bowel cancer and coronary heart diseases is thought one the positive effects on health (Budurlu and Karadeniz, 2003). Mete and Dülger Altıner (2016) used chestnut flour in order to enrich noodle samples that were
produced in conventional types in dietary fiber and some nutrition items. In the study conducted for chestnut flour-doped noodle, they examined some chemical, physical, cook and sensory properties. They added chestnut flour to the noodle in the following portions; 0%, 5%, 10%, 20%, 30% and 40%. As a result of the study, they found the dietary fiber content in chestnut flour 23.57% and parallel to this they found the content in noodle as varying between 2.54% and 11.08%. Moreover, in terms of the general acclaim, they mentioned that the highest score between chestnut flour-doped noodles is achieved by the noodles doped with 10% and 20% chestnut flour portions.
4. Result
In this study, it is predicted that the use of chestnut flour in different foods especially bakery products will make contributions to the development of different product markets in terms of improvement of nutrition value and functional properties. Besides, chestnut flour is thought to be used as an alternative flour additive.
The use of chestnut flour, due to its nutritious property and appropriate sensory properties, is spreading in food industry. It is considered that chestnut flour will positively affect human health when used in food enrichment since it contains E and C vitamins, unsaturated oils like omega-3, dietary fiber components, phenolic and antioxidant components as well as the highly nutritious property content.
The use of chestnut flour in gluten-free food market and high dietary-fiber containing foods instead of wheat flour by being doped with different additives is increasing the significance of itself. Chestnut flour, which is of great significance for celiac patients, should be produced more and be added to different products. Chestnut flour can also be used in the preparation of milky pudding products, bread, flakes (corn flakes), can be used to sauce soups and gravies and for flavoring. Chestnut flour is a sought-after product in cosmetics sector as well.
REFERENCES
[1] Anonim. (2016a). http://www.yemek mutfak.com/beslenme-diyet/1/105/ kestanenin-faydalari-nelerdir-besin- degeri-nedir-nasil-pisirilir
[2] Anonim. (2016b). http://www.naturelka. com/kestane-unu
[3] Atasoy, E. Ve Altıngöz Y. (2012). “Dünya ve Türkiye’de Kestanenin Önemi ve Üretimi.” Coğrafya Dergisi, 22: 1-13 [4] Bodet, L., Ernst M., Allan D., Woods
T. (2001). The international chestnut marketing situation. Department of Agricultural Economics Staff Paper No. 411, University of Kentucky [5] Bounous, G., Botta R., Beccaro G.
(2000). The chestnut: the ultimate energy source nutritional value and alimentary benefits. Nucis (9) 44-50
[6] Burdurlu, H.S. ve F. Karadeniz. (2003). Gıdalarda Diyet Lifinin Önemi. Gıda Mühendisliği Dergisi. 7(15): 18-25 [7] Chenlo, F., Moreira, R., Pereira, G.,
Silva, C.C. (2007). Evaluation of the rheological behaviour of chestnut (castanea sativa mill) flour pastes as function of water content and temperature. Electronic Journal of Environmental Agriculture and Food Chemistry 6 (2), 1794–1802.
[8] Demirkesen, I., Mert, B., Sumnu G., Sahin, S., (2010). Utilization of chestnut flour in gluten-free bread formulations. Journal of Food Engineering,
101(3), 329-336
[9] Dokić, L., Nikolić, I., Šoronja–
Simović, D., Pajin, B., Juul, N. (2014). Sensory Characterization of Cookies with Chestnut Flour, International
Scholarly and Scientific Research & Innovation 8(5) 416-419.
[10] Dülger, D., Şahan, Y. (2011): Diyet lifinin özellikleri ve sağlık üzerindeki etkileri. Uludağ Üniversitesi Ziraat
Fakültesi Dergisi, 25(2): 147-157.
[11] Ertan, E., Kılınç S.S. (2005). Seleksiyon ile belirlenmiş kestane genotiplerinin morfolojik, fenolojik ve biyokimyasal özellikleri. ADU Ziraat Fakultesi Dergisi, 2(2) :67 –77.
[12] Ferreira-Cardoso, J.V., Fontainhas Fernandes, A.A., Torres Pereira, J.M.G. (1993). Nutritive value and technological characteristics of Castanea sativa Mill. fruit. Comparative study of some northeastern Portugal cultivars.
In: Proceedings of the 1st International Congress on Chestnut, Universita` di Perugia, Perugia
[13] İnkaya, A.N. (2008). Bisküvi üretiminde kestane kullanım olanaklarının
araştırılması, Uludağ Üniversitesi, Fen Bilimleri Enstitüsü, Yüksek Lisans Tezi, Gıda Mühendisliği Bölümü, Bursa [14] Kunsch, U., Sharer, H., Patrian, B.,
Hurter, J., Conedera, M., Sassella, A., Jermini, M., Jelmini, G. (1999). Quality assessment of chestnut fruits. Acta Horticolturae 494, 119–127.
[15] Kunsch, U., Schärer H., Patrıan B., Hohn E., Conedera M., Sassella A., Jermını M., Jelmını G. (2001). Effects of roasting on chemical composition and quality of different chestnut (Castanea
sativa Mill) varieties.Journal of the
Science of Food and Agriculture (81) 1106-1112.
[16] Maki M, Lohi O. Celiac Disease. In: Walker WA, Goulet O, Kleinman RE,
Sherman PM, Shneider BL, Sanderson IR (eds). Pediatric Gastrointestinal Disease. 4th ed. Ontario: B.C. Decker, 2004: 932-43.
[17] McCarthy, M.A. and Meredıth F.I. (1988). Nutrient data on chestnuts consumed in the US.Econ. Bot. 42 (1)29–36 [18] Mete, M. and Dülger Altiner, D. (2016). Investigation of the effect of chestnut flour additive on nutritional and quality properties of noodle. İstanbul Aydın Üniversitesi, Fen Bilimleri Enstitüsü,
Yüksek Lisans Tezi, Gıda Mühendisliği
Bölümü, İstanbul
[19] Mert, S. (2014). Effect Of Dıfferent Flours On Qualıty Of Gluten-Free Wafer Sheets, Mıddle East Technıcal Unıversıty, The Graduate School Of Natural And Applıed Scıences, Ankara.
[20] Mıguelez, J.L.M., Bernardeza M. M. and Queıjeıro J. M. G. (2004).
Composition of varieties of chestnuts from Galicia(Spain).Food Chemistry (84)401–404.
[21] Moreira, R., Chenlo, F., Torres, M. D., & Prieto, D. M. (2012). Technological assessment of chestnut flour doughs regarding to doughs from other
commercial flours and formulations. Food and Bioprocess Technology, 5, 2301-2310.
[22] Neri L., Dimitri G. and Sacchetti G. (2010). Chemical composition and antioxidant activity of cured chestnuts from three sweet chestnut (Castanea
sativa Mill.) ecotypes from Italy Journal of Food Composition and Analysis, 23 (2010), pp. 23–29
[23] Pacuilli, M., Rinaldi, M., Cirlini,M., Scazzina, F., Chiavaro, E. (2016).
Chestnut flour addition in commercial gluten-free bread: A shelf-life study, LWT - Food Science and Technology 70 (2016) 88-95
[24] Pereira-Lorenzo, S., Ramos-Cabrer, A.M., Dia´ z- Herna´ ndez, M.B., Ciordia-Ara, M.,Rı´os-Mesa, D. (2006). Chemical composition of chestnut cultivar from Spain. Scientia Horticulturae 107, 306–314
[25] Riberio B., Rangel , J., Valentao, P., Andrade, PB., Pereria, JA., Bölke, H., Seabraa, RM. (2007). Organik acids in two Portuese chestnut (Castanea
sativa Miller) varieties, Food Chemistry,
100,2,504-508
[26] Sacchetti, G., Pinnavaia, G.G., Guidolin, E., Dalla-Rosa, M., (2004). Effects of extrusion temperature and feed
composition on the functional, physical and sensory properties of chestnut and rice flour-based snack-like products. Food Research International 37, 527–534
[27] Seferoğlu, B. (2012). Çölyak hastalarına yönelik kestane unu ve glutensiz unlarla hazırlanan ekmek, kek ve bisküvi çeşitlerinin duyusal analiz ile
değerlendirilmesi, Yüksek Lisans Tezi, Hacettepe Üniversitesi Sağlık Bilimleri Enstitüsü, Ankara
[28] Senter, S. D., Payne J.A., Mıller G., Anagnostakıs S.L. (1994). Comparison of total lipids, fatty acids, sugars and nonvolatile organic acids in nuts from four Castanea species. Journal of the Science of Food and Agriculture
(65) 223-227
[29] Soylu, A. (2004). Kestane yetiştiriciliği ve özellikleri, Hasad yayıncılık Ltd.Şti, 2: s.64
[30] Subaşı, B. (2004). Kestane Sektör Profili, İstanbul Ticaret Odası Etüt ve Araştırma Şubesi, İstanbul
[31] Yang, F., Liu, Q., i Pan S., Xu C., Xiong Y.L. (2015). Chemical composition and quality traits of Chinese chestnuts (Castanea mollissima) produced in different ecological regions Food
Bioscience, Volume 11, Pages 33-42
CURRICULUM VITAE
Merve METE was born in Midyat. She graduated from İstanbul Aydın University in 2014. She obtained a master degree from Department of Food Engineering of İstanbul Aydın University in 2016. Her master thesis advisor is Assist. Prof. Dr. Dilek DÜLGER ALTINER from Istanbul Aydın University, Faculty of Engineering, Department of Food Engineering.
1. Introduction
Tomato is one of the mostly produced vegetables both in Turkey and in the World [1]. Although almost all vegetables have health - protecting and healing properties for humans due to their nutritional components, some species are more prominent than others. Tomato is one of the leading species in this regard [2].
It has been reported that foodstuffs contain proteins, carbohydrates, oils, minerals and vitamins, along with one and/or many of antioxidant substances
[3]. Lycopene is the most prevalent carotenoid in tomato and constitues about 83% of the pigments in tomato [4].
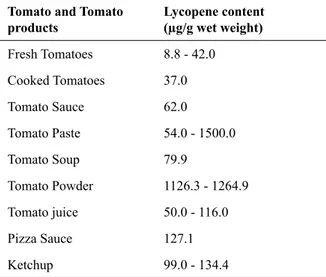
Lycopene, like all carotenoids, is derived from the acyclic C40H56 structure [5]. Lycopene is a powerful antioxidant and main component of the red color of tomato. Lycopene level in a tomato may vary according to fruit variety, maturity stage and growing conditions [6]. Lycopene content of fresh tomato and some tomato products are given in Table 1 [7].
THE EFFECT OF PROCESSING TECHNOLOGIES ON
LYCOPENE IN TOMATOES (Lycopersicon esculentum L.)
Nahide TÜRÜT
1, Güner ARKUN
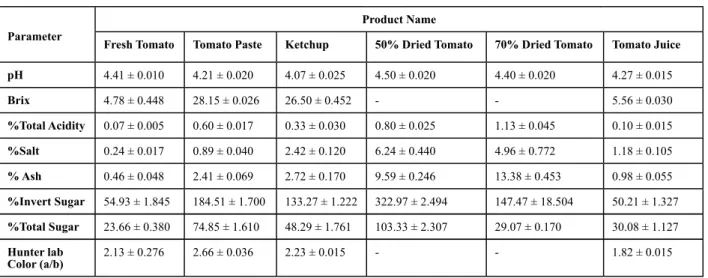
2* AbstractLycopene is a natural pigment of carotenoid family and recent years there is an increasing interest for the health benefits of lycopene. Tomato and tomato products are considered as one of the most important source of lycopene. The aim of this study is to determine the amount of lycopene in different tomato products such as fresh tomatoes, ketchup, tomato juice, dried tomatoes and tomato paste. It is also aimed to determine the effect of tomato paste processing on lycopene. In this study, lycopene values were found in the range of 89.14 - 581.35 mg/kg during processing at 5 different stages. The ranking of lycopene values found to be as follows: evaporator ˃ the final product (tomato paste) ˃ shredder ˃ fresh tomatoes ˃ preheating stage. Lycopene amount was low (89.14 ± 1.476 mg/kg) at preheating stage, while the highest lycopene value was found at evaporation stage (581.35 ± 11.795 mg/kg). Among all the examined tomato products, lycopene values were found in the range of 88.56 - 550.30 mg/kg in the order of : The final product (tomato paste) ˃ 50% dehydrated tomato ˃ 70% dehydrated tomato ˃ ketchup ˃ tomato juice. Tomato juice found to have low lycopene (88.56± 2.566 mg/kg), while the final products of tomato paste have the highest value (550.30 ± 46.75 mg/kg). In addition, some the quality properties of the products have also been examined and the following results were obtained: Soluble dry matter 28.01 – 28.27 °Brix, pH 4.06 – 4.52, total acidity 0.07 – 1.13g/100g, ash 0.41 – 13.38 %, color (a/b rate) 1.82 – 2.45, viscosity 3.57 – 4.03, invert sugar at total dry matter 42.29 – 322.97%; and black spot 0 /10g. Considering the quality parameters of all samples, it was determined that the result of chemical and physical analyses were in conformity with values defined in Turkish Standards (TS 1466 Tomato Paste - Puree, TS 5282 Ketchup, TS 1595 Tomato juice and TS 3926 Dehydrated Tomatoes)
Keywords: Tomatoes, lycopene, antioxidant activity, tomato products
1 Istanbul Aydın University, Engineering Faculty, Department of Food Engineering Istanbul TURKEY,
2* Istanbul Aydın University, Engineering Faculty, Department of Food Engineering Istanbul TURKEY,
Table 1. Lycopene content of tomato and tomato
products [7]
Tomato and Tomato
products Lycopene content (µg/g wet weight)
Fresh Tomatoes 8.8 - 42.0 Cooked Tomatoes 37.0 Tomato Sauce 62.0 Tomato Paste 54.0 - 1500.0 Tomato Soup 79.9 Tomato Powder 1126.3 - 1264.9 Tomato juice 50.0 - 116.0 Pizza Sauce 127.1 Ketchup 99.0 - 134.4
Various foods may contain varying amounts of lycopene according to the agricultural methods used, processing and preservation technologies and different cooking methods. Thus, various food composition databases may define the lycopene content at different values for fresh tomatoes varieties, tomato sauce, ketchup, dried tomatoes, tomato paste, etc. [8].
Carotenoids that are locked in a food matrix are being released during food processing especially heat treatments and their bioavailability is also increased. Cooking or other heat treatments that the foods are subjected might break the cell walls of tomatoes and neutralize the binding forces between lycopene and the fruit tissue for lycopene to be more easily available [9].
Thus, the best lycopene sources are suggested to be cooked tomatoes and tomato products [10,11]. In terms of its bioavailability, lycopene in tomato paste was determined to be 2.5 times higher than the lycopene in fresh tomatoes.
Various studies reported that different antioxidant compounds in diet may be effective in preventing cancer by reducing oxidative stress. Lycopene is one of the heavily studied carotenoids in terms of reducing cancer risk [12]. Carotenoids, especially
lycopene, slow down tumor growth by increasing the communication between healthy cells. Lycopene has antioxidant effects and regularly acts against free oxygen radicals that cause DNA damage and cancer in the body [13].
Since carotenoids are transported through low density lipoproteins (LDL), they reduce cardiovascular disease risks by preventing LDL’s exposure to oxidation [14]. Lutein and zeaxanthin in the eye retina protect the eye from the harmful effects of free radicals and light [15] and prevent the formation of cataracts and age-dependent macula disorders [16].
In this study the lycopene content in different tomato products were determined and discussed for a healty nutrition. In addition, the effect of tomato paste processing on lycopene in fresh tomato was also studied through in plant applications in a tomatopaste processing plant.
2. Materials and Methods 2.1. Materials
Samples to be used as material were obtained from a national tomato paste manufacturing plant that produces commercial tomato paste. The tomato variety subjected to processing in the tomatopaste processing plant was Rio Grande grown in Bursa region, Turkey.
Totally 15 samples were taken from 3 batches of tomato paste processing stages. Two ketchup samples (manufactured under laboratory conditions), two tomato juice samples and two half-dried tomato samples (sun dried) were obtained for examination. Tomato paste and ketchup samples were taken in ~830 gr sterile glass jars, tomato juices in 1 liter glass package and dried tomato samples in 1 kg vacuum plastic packages. The samples consist of products grown and manufactured in August 2015 and the study was conducted in triplicate and the results are reported accordingly.
Samples were stored under cold conditions at +4°C until the analyses performed.
2.2. Methods
The methods of analyses conducted on the samples are given below.
Lycopene Determination:
Three samples were taken from each sample for lycopene analysis.
Lycopene determination was conducted according to Anon.,1983 [21] and Anon., 1990 [20]. UV-VIS spectrophotometer (Optizen Pop, Korea) was used for the measurements.
The samples were prepared to be measured by the spectrophotometer after the extraction process. In extraction, water:aseton (1:1, v/v) solution was used after boiling, the solution was centrifuged and separated using petroleum ether in a separatory funnel, petroleum phase was collected.
Petroleum ether was used as blank in spectrophotometric measurements. A UV-VIS spectrophotometer (Optizen Pop, Korea) was used at 505 nm wavelength (A505), and the absorbance values were measured. The lycopene amount was calculated by using the absorbance value measured in the formula in (2.1).
Lycopene (µg/g) or (mg/kg) = (2.1)
Here;
V= The final volume of the solution (ml), W= Amount of sample (g),
(A505): Absorbance at 505 nm , (Anonim,1983; T.O.K.B., 1988).
The other analyses were performed according to the methods of analyses defined in Turkish Standards (TS 1466 Tomato Paste - Puree, TS 5282 Ketchup, TS 1595 Tomato juice and TS 3926 Dehydrated Tomatoes).
Statistical Methods
The analysis was conducted in triples and the results are presented as arithmetic average ±
standard error of average. In order to statistical evaluation of the results of lycopene content, SPSS Windows software (IBM SPSS Statistics 23, 2015) with one-way ANOVA method was used. Post Hoc tests were also used in order to determine the cause of difference between the averages; Tukey multiple comparison test was used when the variances are homogenous, and Games Howel, Tamhane’s T2 was used when they were not. Averages that do not show the same letter in the tables are found to be statistically different.
3. Results
The amounts of lycopene were determined in fresh tomato, in samples of different tomato paste processing stages and in different tomato products. The results of analyses were evaluated statistically. Lycopene values for samples that represent different tomato paste process phases are given in Table 2, Figure 1. The figure with the same letter mean that there is no statistically significant difference in terms of lycopene contents.
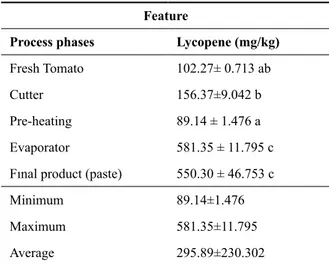
Table 2. Changes in lycopene content during
tomato paste processing *
Feature
Process phases Lycopene (mg/kg)
Fresh Tomato 102.27± 0.713 ab Cutter 156.37±9.042 b Pre-heating 89.14 ± 1.476 a Evaporator 581.35 ± 11.795 c Fınal product (paste) 550.30 ± 46.753 c Minimum 89.14±1.476 Maximum 581.35±11.795 Average 295.89±230.302
*: The difference between the general properties of process phases that have different letters in the same column is significant (p<0.05).
The lycopene values show that the pre-heating phase of tomato has a low lycopene value (89.14 ± 1.476 mg/kg) and is significantly different (p<0,05)
from other phases, except the fresh tomato phase. The highest lycopene content was determined in evaporation phase (581.35 ± 11.795 mg/kg) and it is significantly different (p<0,05) from other phases, except for the tomato paste . The lycopene values were determined for fresh tomato in the range of 8,8 - 42,0 µg/g, for preheating stage at a value of 37,9 µg/g, and for tomato paste 54-1500 µg/g [7].
Figure 1. Lycopene content in tomatoes during
tomato paste processing
The lycopene values for all tomato products are given in Table 3.
Table 3. Statistical results for lycopene content of
all tomato products
Feature
Product name Lycopene ( mg/kg)
Fınal product (Paste) 550.30± 46.75b Ketchup A 153.61± 11.132 a Ketchup B 154.56± 12.903 a Tomato Juice A 88.56± 2.566 a Tomato Juice B 93.55± 2.933 a 50% Dried Tomato 540.020± 36.726 b 70% Dried Tomato 492.03± 51.523 b Minimum 88.56± 2.566 Maksimum 550.30± 46.75 Avarage 296.09 ± 209.023
*: The difference between the general properties of process phases that have different letters in the same column is significant (p<0.05).
The lycopene values show that tomato juice has low lycopene value (91.06 ± 2.749 mg/kg) and exhibits a statistically significant difference (p<0,05) from other products except for ketchup. The highest amount of lycopene was determined in the final product (tomato paste) (550.30 ± 46.75 mg/kg), and is significantly different (p<0,05) from other products except for 50% dried tomato and 75% dried tomato.
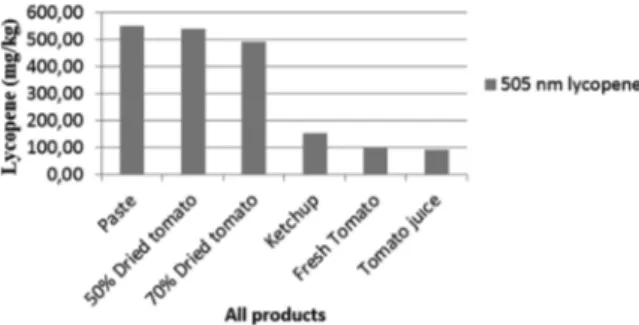
The lycopene contents were determined as 30.25, 159.16, 293.3, 170.08 and 96.6 mg/kg in fresh tomato, tomato paste, triple concentrated tomato paste, ketchup and tomato juice, respectively. [17]. The lycopene amounts of dried tomato products were found in the range of 500-700 mg/kg [18], while it has been determined as 659.5 mg/kgin tomato paste [19]. Lycopene contents of all tomato products are given in Figure 2.
Figure 2. Lycopene content of tomato products
In tomato paste processing, tomatoes at the pre-heating process have a low lycopene value (89.14 ± 1.476 mg/kg), while the evaporator phase has the highest lycopene content (581.35 ± 11.795 mg/ kg).
Among all tomato products,the lowest lycopene value was determined in tomato juice (88.56± 2.566 mg/kg) while tomato paste has the highest amount of lycopene (550.30 ± 46.75 mg/kg). In addition to lycopene content, some quality parameters of the products were also investigated. The statistical results of the quality specifications for all products are given in Table 4.
Parameter
Product Name
Fresh Tomato Tomato Paste Ketchup 50% Dried Tomato 70% Dried Tomato Tomato Juice
pH 4.41 ± 0.010 4.21 ± 0.020 4.07 ± 0.025 4.50 ± 0.020 4.40 ± 0.020 4.27 ± 0.015 Brix 4.78 ± 0.448 28.15 ± 0.026 26.50 ± 0.452 - - 5.56 ± 0.030 %Total Acidity 0.07 ± 0.005 0.60 ± 0.017 0.33 ± 0.030 0.80 ± 0.025 1.13 ± 0.045 0.10 ± 0.015 %Salt 0.24 ± 0.017 0.89 ± 0.040 2.42 ± 0.120 6.24 ± 0.440 4.96 ± 0.772 1.18 ± 0.105 % Ash 0.46 ± 0.048 2.41 ± 0.069 2.72 ± 0.170 9.59 ± 0.246 13.38 ± 0.453 0.98 ± 0.055 %Invert Sugar 54.93 ± 1.845 184.51 ± 1.700 133.27 ± 1.222 322.97 ± 2.494 147.47 ± 18.504 50.21 ± 1.327 %Total Sugar 23.66 ± 0.380 74.85 ± 1.610 48.29 ± 1.761 103.33 ± 2.307 29.07 ± 0.170 30.08 ± 1.127 Hunter lab Color (a/b) 2.13 ± 0.276 2.66 ± 0.036 2.23 ± 0.015 - - 1.82 ± 0.015
It was determined that mean values of all samples investigated were in conformity with the legal limits specified by Turkish Standards (TS 1466 Tomato Paste - Puree, TS 5282 Ketchup, TS 1595 Tomato juice and TS 3926 Dehydrated Tomatoes)
4. Conclusion
The main objective of the study is determining the lycopene content in various tomato products and also the change in lycopene content during tomato paste production. It has been determined that lycopene values vary between 89.14 and 581.35 mg/kg during tomato paste production stages. The products can be sorted for lycopene contents from high to low values during tomato paste processing: Evaporator > Final product (paste) > Cutter > Fresh Tomato > Pre-heating. Considering all the tomato products, the lycopene amounts were in the range of 88.56 and 550.30 mg/kg and . The ranking for lycopene of all tomato products: Tomato paste > 50% dried tomato > 70% dried tomato > ketchup > fresh tomato > tomato juice. In processed tomato products, heat treatment of tomato breaks down the cell walls due to heat effect and lycopene is released. Thus, the lycopene concentration in heat-treated tomato products is higher than fresh tomato. Release of lycopene occurs when it dissolved from the fruit tissue
during processing or cooking and creates a more easily available form. Thus, the best lycopene sources are suggested to be cooked tomatoes and tomato products.
Tomato is very important for humans in terms of health and nutrition. Considering the fact that the second most prevalent cause of death in the world is cancer, it is recognized that nutrition styles have a great role in cancer prevention. It is assumed that 1/3 of all cancers can be prevented through individual diet modification. Lycopene is one of the mostly studied carotenoids in terms of reducing cancer risk in human.
Lycopene protects the cells from the damages by free radicals, strengthens the connection between cells and improves cell metabolism. Its antioxidant properties provide protection against cancer, cardiovascular disorders, eye disorders, ageing, bone and skin issues, and many other disorders. In the light of the various reports on lycopene, lycopene plays an important role in preventing some chronic diseases. Since the tomato and tomato products are the important source of lycopen, tomato and products derived from tomatoes such as pastes, ketchup, tomato juice and dried tomato will help the healty nutrition and well being of the people.