CHARGE DISSIPATION MECHANISM
OF LOW-COST ANTISTATIC ADDITIVE
LIGNIN IN CONTACT CHARGED
POLYMERS
A THESIS SUBMITTED TO
THE GRADUATE SCHOOL OF ENGINEERING AND
SCIENCE
OF BILKENT UNIVERSITY
IN PARTIAL FULFILLMENT OF THE REQUIREMENTS FOR
THE DEGREE OF
MASTER OF SCIENCE
IN CHEMISTRY
By
Mertcan ÖZEL
July 2019
CHARGE DISSIPATION MECHANISM OF LOW-COST
ANTISTATIC ADDITIVE LIGNIN IN CONTACT
CHARGED POLYMERS
By Mertcan ÖZEL
July 2019
We certify that we have read thesis and that in our opinion it is fully
adequate, in scope and in quality, as a thesis for the degree of Master of
Science.
____________________
Bilge BAYTEKİN (Advisor)
_____________________
Ali ÇIRPAN
______________________
Burak ÜLGÜT
______________________
Yunus Emre TÜRKMEN
______________________
Salih ÖZÇUBUKÇU
Approved for the Graduate School of Engineering and Science:
_______________________
Ezhan KARAŞAN
iii
ABSTRACT
CHARGE DISSIPATION MECHANISM OF
LOW-COST ANTISTATIC ADDITIVE LIGNIN IN
CONTACT CHARGED POLYMERS
Mertcan ÖZEL
M.S. in Chemistry
Advisor: Bilge BAYTEKİN
July 2019
Contact electrification (C.E.), a phenomenon studied for millennia, develops contact charges on material surfaces, when two materials are contacted and then separated. Accumulation of contact charges and their uncontrolled sudden discharges on dielectric polymers pose major drawbacks in industries i.e. pharmaceutical, (micro)electronics, and space, causing million-dollar losses annually. The overall mechanism of C.E. is unclear until now, however, recent efforts have proven that chemical bond-breakages on polymer surfaces result in mechanoions – which are indeed the contact charges on the surfaces. These studies also showed that removing mechanoradicals (co-formed upon bond-breaking) by molecular radical scavengers destabilizes the mechanoions (charges) and render the doped polymer material antistatic. This method of static charge mitigation has an advantage over the conventional methods (e.g. doping with metals, carbon powder, conductive polymers, or surface humidity enhancers) because it is not based on an increase in surface conductance and smaller doping concentrations are needed to achieve
iv
antistatic behavior. However, currently used molecular radical scavenger doping is generally not cost effective method to be upscaled for industrial use.
Lignin; however, is a “low-cost” material (the second most abundant polymer on earth, a by-product of paper production) that can act as a radical scavenger. In this thesis work, lignin was extracted from some examples of both hard and softwood. Firstly, it was verified that lignin doping in low concentrations (1 – 5% w/w) reduce the contact charge accumulation on common polymers such as on a crosslinked elastomer polydimethylsiloxane, and on thermoplastics polypropylene, polyethylene, polylactic acid, and polystyrene. Then, the mechanism of the observed charge dissipation was discussed in the light of the results obtained from surface conductance of polymers upon doping, 31P NMR and solid state 13C-NMR
spectroscopy, total phenol content, and the reacted number of radicals before and after grinding - which was shown essential to get homogeneous doping- of lignin.
The results pointed out a mechanism involving a radical scavenging activity without any change in the surface conductance of the material, similar to that with molecular radicals. The understanding of lignin’s charge dissipation mechanism will be helpful in industrial utilization of lignin as an antistatic additive and in assessment of the limitations of this utilization.
Keywords: antistatic additives, contact electrification, polydimethylsiloxane,
v
ÖZET
DOKUNMA İLE ELEKTRİKLENEN POLİMERLERDE
DÜŞÜK MALİYETLİ ANTİSTATİK KATKI
MALZEMESİ OLARAK KULLANILAN LİGNİN’İN YÜK
SÖNÜMLEME MEKANİZMASI
Mertcan ÖZEL
Kimya, Yüksek Lisans
Tez danışmanı: Bilge Baytekin
Temmuz 2019
Dokunma ile elektriklenme (D.E.) iki yüzeyin birbirine dokundurulup ayrılması sonucu yüzeylerin elektriksel yüklenmesidir ve binlerce yıldır neden ve nasıl oluştuğu sorgulanmaktadır. Yüzeylerde yük birikmesi, ilaç, mikroelektronik ve uzay gibi bir çok endüstride ciddi bir problem yaratmakta ve yıllık milyonlarca dolarlık zararlara sebep olmaktadır. D.E. mekanizması hala daha tam olarak ortaya konamamıştır ancak yakın zamanda malzemelerin bir araya gelip ayrılmaları sırasında yüzeyde oluşan bağ kırılmaları sonucu oluşan mekanoiyonların yüzeydeki yükleri oluşturduğu gösterilmiştir. Oluşan mekanoiyonlar, onlarla beraber oluşan ve onları daha kararlı kılan mekanoradikallerin ortamdan radikal tuzaklayıcıları ile uzaklaştırılması ile kararsız hale getirilebilir ve bu sayede polimer malzeme antistatik özellik kazanır. Bu yöntemin, klasik yöntem olan (metal, karbon tozu ve iletken polimerler ya da nem artırıcılar gibi katkılarla) iletkenlik artırma yöntemine göre avantajı doplama miktarının çok az olmasıdır. Yine de halihazırda kullanılan moleküler radikal
vi
tuzaklayıcılarının pahalı olmaları nedeniyle bu yöntemin endüstride kullanılması mümkün değildir.
Radikal tuzaklayıcısı olarak kullanılabilen lignin ise dünyada en çok bulunan ikinci polimerdir ve kağıt endüstrisinin de bir atığı olduğundan “masrafsız” bir malzemedir. Bu tez çalışmasında lignin bazı sert ve yumuşak kereste kaynaklarından elde edilmiştir. Kütlece az (%1-5 arası) bir katkı oranının bile uygulamada işe yaradığı, polimer yüzeylerde elektriksel yüklerin birikmesinin engellendiği ve zamanla yüklerin yüzeyden yok olma hızlarının arttığı, çapraz bağlı polidimetilsiloksan, termoplastik polipropilen, polietilen, polilaktik asit ve polistren örneklerde gösterilmiştir. Daha sonra da gözlemlenen yük sönümlemenin mekanizması; yüzey iletkenlik ölçümleri,
31P NMR, katı hal NMR’ı, toplam fenol ölçümü, ligninin homojen bir şekilde
katkılanması için gerekli olan soğuk öğütme işlemi öncesi ve sonrasında yapılan radikal miktarı ölçümü gibi yöntemlerden elde edilen sonuçlar ışığında tartışılmıştır.
Sonuçlar, moleküler radikal tuzaklayıcılarda görülene benzer şekilde, mekanizmanın iletkenlik artışı içermeyen bir radikal tuzaklama içerdiğini göstermektedir. Ligninin yük sönümleme mekanizmasnın aydınlatılması, hem ligninin endüstride antistatik bir katkı malzemesi olarak kullanımına, hem de bu kullanımın sınırlarının çizilmesine yardımcı olacaktır.
Anahtar kelimeler: anti-statik katkı malzemeleri, dokunma ile elektriklenme,
polidimetilsiloksan, termoplastik polimerler, radikal tuzaklayıcılar, statik elektriklenme, triboelektriklenme.
vii
ACKNOWLEDGEMENT
First of all, I would like to express my special thanks and sincere gratitude to my advisor Assist. Prof. Bilge Baytekin for all the feedbacks, her guidance, support and encouragement. I also want to thank her for being such a role-model and for her company in and out of the lab day and night. Also, Assoc. Prof. Tarık Baytekin for his priceless feedback and help in instrumentation.
I am grateful to all the jury members Prof. Ali Çırpan, Assist. Prof. Burak Ülgüt, Assist. Prof. Yunus Emre Türkmen, and Assist. Prof. Salih Özçubukçu for their time and valuable feedbacks.
Also, I would like to thank all of my colleagues in our research group especially Dr. Fatma Demir for her support and help in the project and Dr. Joanna Kwiczak Yiğitbaşı for her support and assistance. I thank other Baytekin Group members, Mohammad Morsali for his help during photo shooting, Doruk Cezan and Turab Ali Khan for all their support.
I acknowledge The Scientific and Technological Research Council of Turkey (TUBITAK) for financial support under project no: 116Z523. Also, I would like to thank all the members of Bilkent University, Department of Chemistry.
Last but not least, I would like to express my gratitude to my beloved parents Güzin and Mehmet Cengiz Özel for their endless support, patience and strong encouragement. I also would like to thank to my beloved one, Gözde Aydın, for her unlimited support, feedback, patience and her faith in me during this work.
viii
TABLE OF CONTENTS
1. INTRODUCTION ... 1
1.1.Contact Electrification Phenomenon ... 1
1.1.1.Charge Mitigation: Radical Scavengers/Antioxidants ... 5
1.1.2. Triboelectric Series ... 7
1.2.Lignin ... 9
1.2.2. The Chemistry of Lignin ... 11
1.2.3. Lignin Extraction Methods ... 16
1.3.PDMS and Thermoplastic Polymers ... 18
1.4.Aim of The Thesis ... 19
2. EXPERIMENTAL ... 22
2.1. Materials ... 22
2.2. Experimental Procedures ... 23
2.2.1. General Lignin Extraction and Particle Size Reduction Pathway ... 23
2.2.2. Lignin Extraction Procedure ... 24
ix
2.2.4. Structural and Chemical Characterization of Lignin ... 25
2.2.4.1. FTIR Spectroscopy ... 26
2.2.4.2. Prussian Blue Method for Total Phenol Content (TPC) Determination ... 26
2.2.4.3. Mechanoradical Content Determination by DPPH Test ... 28
2.2.4.4. Solubility Enhancement by Acylation of Lignin ... 28
2.2.4.5. GPC Measurements for Molecular Weight Determination ... 30
2.2.4.6. 13C-CP/MAS NMR Spectroscopy ... 30
2.2.4.7. 31P-NMR Spectroscopy ... 31
2.2.4.8. Thermal Stability Analyses (TGA/DSC) of Lignin ... 31
2.2.4.9. X-Ray Diffraction (XRD) Analysis ... 32
2.2.4.10. Scanning Electron Microscopy (SEM) Analyses ... 32
2.2.5. Lignin Doping to The Polymers ... 32
2.2.5.1. Lignin Doping to PDMS (Polydimethylsiloxane) ... 33
2.2.5.2. Lignin Doping to Thermoplastics (PE, PP, PS, PLA) ... 34
2.2.6. Preparation of Lignin-Free Wood ... 35
2.2.7. Electrical Measurements ... 36
2.2.7.1. Charge Density Measurements ... 36
2.2.7.2. Charge Decay Measurements ... 37
x
3. RESULTS & DISCUSSION ... 40
3.1. Characterization of Extracted, Cryomilled and Acylated Lignin ... 40
3.1.1. Particle Size Measurement Results ... 41
3.1.2. Structural Analyses of Lignin by FTIR Spectroscopy ... 43
3.1.3. Total Phenol Content (TPC) Determination ... 49
3.1.4. Mechanoradical Content Determination ... 52
3.1.5. Molecular Weight Determination of Acylated Lignins ... 55
3.1.6. 13C-CP/MAS NMR Results ... 55
3.1.7. 31P-NMR Results ... 57
3.1.8. Thermal Stability Results ... 58
3.1.9. XRD Analysis of Lignin ... 60
3.1.10. Surface Morphology Analysis of Cryomilled Lignin ... 60
3.2. Contact Charge Density and Charge Decay Measurements ... 61
3.2.1. Contact Charge Density of Thermoplastics and the Effect of Lignin Doping ... 61
3.2.2 Contact Charge Density of PDMS and The Effect of Lignin Doping ... 64
3.2.2.1. The Effect of Milling Time of Lignin on Contact Charging of PDMS .. 64
3.2.2.2. The Effect of Lignin Sources on Contact Charging of PDMS ... 68
3.2.2.3. The Effect of Total Phenol Content of Lignin on Contact Charging of PDMS ... 70
xi
3.2.4. Why Does Wood Not Get Charged? Does Lignin Have Any Effect? ... 73
3.2.5. The Effect of Lignin Doping on The Surface Conductance of PDMS ... 76
3.3. Mechanism of Charge Dissipation by Radical Scavenging ... 77
4. CONCLUSION ... 81
xii
TABLE OF FIGURES
Figure 1. Applications of contact electrification by controlling, decreasing, and increasing the surface charges. ... 3 Figure 2. Previously proposed possible charge transfer mechanisms. (a) Transfer of an electron. (b) Transfer of an ion. ... 4 Figure 3. (a) Surface charge lowering in polydimethylsiloxane (PDMS) by doping radical scavengers DPPH, tocopherol, and HALS. (b) proposed interaction of frontier molecular orbitals between mechanoradicals and mechanocations (left), and, mechanoradicals and mechanoanions (right) on contact-charged surfaces [2]. ... 6 Figure 4. A triboelectric series of materials. ... 8 Figure 5. Illustration of a plant cell wall. Taken from [47]. ... 11 Figure 6. Standard three monolignol monomers of lignin. p-coumaryl alcohol (H), coniferyl alcohol (G), and sinapyl alcohol (S). ... 12 Figure 7. Most common linkages found in lignin. a) β-O-4, b) β-5, c) β-β’, d) 5-5’, e) 4-O-5, f) β-1. ... 13 Figure 8. Proposed chemical structure of a lignin. ... 14 Figure 9. Resonance stability of phenoxy radicals on monolignols [48]. ... 15 Figure 10. Chemical structure radical species of lignin at different pH conditions. . 15 Figure 11. Outline of lignin extraction processes from lignocellulosic biomass. ... 17
xiii
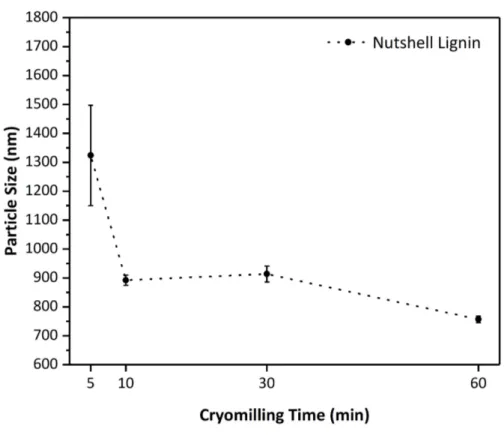
Figure 12. Chemical structure of polydimethylsiloxane (PDMS). ... 18 Figure 13. Chemical structure of polyethylene (PE), polypropylene (PP), polystyrene (PS), and polylactic acid (PLA). ... 19 Figure 14. Extraction and particle size reduction flow-chart used in this thesis to obtain lignin from the mentioned sources. ... 23 Figure 15. Acylation reaction scheme of lignin with trimethylacetychloride. ... 29 Figure 16. Acylated lignin samples dissolved in THF (Concentration: 1 mg/1 mL). .. 29 Figure 17. Images of Pure (undoped) PDMS, non-cryomilled lignin doped PDMS and 60 min. cryomilled lignin doped PDMS. ... 34 Figure 18. Illustration of Contact Electrification Measurement Setup-1. Determination of maximum net charge density on the polymer surfaces after contact. ... 37 Figure 19. Illustration of Contact Electrification Measurement Setup-2. Determination of surface electric potential upon contact and separation events. .. 37 Figure 20. (a) Illustration of surface conductance measurement setup. (b) Electrical circuit scheme of the two probe method. ... 39 Figure 21. Particle size vs cryomilling time of cryomilled nutshell lignin. Error bars were calculated from 3 independent measurements of each sample. ... 41 Figure 22. Particle size vs. ultrasonication time for lignin samples from different sources, namely nutshell, maple, pine, and birch. 0 min sonication refers to previously 60 min. cryomilled lignin. Error bars were calculated using 3 independent measurements of each sample. ... 42 Figure 23. FTIR spectra of lignin (nutshell, maple bark, pine bark and birch bark). All spectra were given as normalized transmittance percentage vs wavenumber. (a)
xiv
Extracted lignin, (b) 60 min cryomilled lignin, (c) 5-10-30-60 min. cryomilled nutshell lignin, (d) acylated lignin. ... 45 Figure 24. Stacked spectra (shifted on the vertical axis for clarity) of extracted-cryomilled (60 min)-acylated lignin samples. (a) Nutshell lignin, (b) maple lignin, (c) pine lignin, and (d) birch lignin. ... 47 Figure 25. FTIR spectrum of lignin removal from limba wood. ... 48 Figure 26. “Prussian Blue test” reactions of polyphenols (PP). ... 49 Figure 27. (a) UV-Vis spectra of Methyl Gallate standard solutions with concentrations 0.1 mM-0.5 mM used in Prussian Blue test for polyphenols showing an increase of the absorption band at 700 nm (the absorption maximum for Prussian blue that forms upon oxidation of polyphenols) and (b) the generated calibration curve. For details of the solution preparations and the test, see section 2.2.4.2. ... 49 Figure 28. UV-Vis spectra recorded during Prussian blue test: Nutshell (a), maple (b), pine (c), and birch lignin (d). N(1-5), M(1-5), P(1-5), and B(1-5) indicate each of 5 identical experiments performed in order to calculate standard deviations for nutshell, maple, pine, and birch lignin respectively. ... 51 Figure 29. UV absorption changes of Prussian Blue reaction of (a) lignin and (b) blank control sample (lignin-free) solution initial and after 24 hours. ... 51 Figure 30. Prussian blue reaction. Visual comparison of the blank sample (without lignin) and lignin contained sample (polyphenol) after 24 hours . ... 52 Figure 31. UV-Vis spectrum of DPPH-lignin mixtures at given reaction times. (a) Non-cryomilled, (b) 5 minutes, (c) 10 minutes, (d) 30 minutes, and (e) 60 minutes cryomilled samples, (f) control sample having no lignin but only DPPH. ... 54
xv
Figure 32. The reacted number of radicals per gram of lignin sample cryomilled for the given milling times at the given reaction times. The reaction between DPPH radical scavenger and the lignins continue at even prolonged times. ... 54 Figure 33. 13C-CP/MAS NMR spectra of 60 minutes cryomilled lignins. ... 56
Figure 34. The reaction of 2-Chloro-1,3,2-dioxaphospholane with active hydroxyl groups. R = phenol residues, alcohols, aldehydes and carboxylic acids. ... 57 Figure 35. 31P-NMR spectrum of the phosphorylated nutshell lignin. ... 58
Figure 36. (a) Thermogravimetric Analysis (TGA) curve of all lignin samples. (b) TGA/DTG curve shows the decomposition rate of the samples. ... 59 Figure 37. XRD diffractogram of cryomilled nutshell lignin and cellulose (cotton). . 60 Figure 38. SEM images of non-cryomilled and 5 to 60 minutes cryomilled lignins. . 61 Figure 39. a) The signals of lignin-free and lignin-doped wood, b) the voltage signals of undoped and doped PS against PTFE, collected from the homemade tapping device. c-d) Surface charges of wood and thermoplastics. ... 63 Figure 40. Open circuit voltages obtained as a result of tapping and contact-charging of the samples of selected undoped and doped with 5% (w/w) thermoplastic polymers. Lignin was 60 min cryomilled before doping. PP, PLA, PE and PS refer to pure polymers and L-PP, L-PLA, L-PE and L-PS refer to polymers doped with lignin 63 Figure 41. Contact Electrification results of 5 % lignin-doped PDMS. Undoped PDMS vs 5-10-30-60 min cryomilled doped PDMS. ... 66 Figure 42. Charge density of PDMS and particle size of lignin as a function of cryomilling time. ... 68 Figure 43. Charge density vs number of touches on the surface of PDMS and L-PDMS (1% and 5% doping) samples prepared with lignin extracted from nutshell, maple,
xvi
pine, and birch. All samples extracted from the sources are cryomilled for 60 min before doping. ... 69 Figure 44. Charge density of undoped and doped PDMS versus total phenol content of lignin. ... 70 Figure 45. Charge decay plot of undoped and doped PDMS samples (a). The solid lines represent the average of at least 3 measurements. Semi-logarithmic plots of charge vs time (b). ... 73 Figure 46. Charge density vs number of touches on the surface of PDMS and Pine bark wood against aluminum foil. ... 74 Figure 47. Lignin extraction and wood bleaching (a-b), lignin-free wood after 5 min cryomilling and lignin doping of wood by cryomilling (c-d). ... 75 Figure 48. Lignin (pine bark) doping to lignin-free wood from 1% to 50% (w/w) by cryomilling. The samples were doped with lignin by 5 minutes of cryomilling. ... 75 Figure 49. Contact Electrification of lignin-free wood and lignin doping concentration to wood by 1-3-5-50% (w/w). 100% doping concentration refers to pure lignin. .... 76 Figure 50. Surface conductance results of PDMS and 5% lignin doped PDMS samples. Conductance of the samples were calculated from surface resistivities measured via two-probe method. For experimental details see section 2.2.7.3. ... 77 Figure 51. The mechanism of contact charge formation and stabilization on polymer surface of an undoped polymer. ... 80 Figure 52. The mechanism of contact charge dissipation by removal of mechanoradicals by radical (re)combination or H-transfer via lignin doping. ... 80
xvii
LIST OF TABLES
Table 1. Current (2019) prices of molecular antioxidants (radical scavengers) used as antistatic additive in the recent studies. Data taken from Sigma-Aldrich website. .... 6 Table 2. Total phenol content determination of the lignin samples. Standard deviations and mean values were calculated using the data from 5 different samples prepared by using identical procedure(a). Methyl gallate standard(b). ... 52
Table 3. Molecular weights of acylated polymers. *Polydispersity index ... 55
Table 4. Contact Electrification results of lignin doping to wood and thermoplastics ... 64 Table 5. Comparison of the effects of cryomilling time on particle size, reacted number of radicals in lignin and charge density of PDMS. Reacted number of radicals were calculated after the complete reaction of lignin radicals with DPPH radicals (144 hours). ... 67 Table 6. Comparison of lignin total phenol content and charge density of lignin doped PDMS. ... 71
1
CHAPTER 1
1. INTRODUCTION
1.1. Contact Electrification Phenomenon
Contact Electrification (CE), also known as triboelectrification, or static charging, is a natural event that occurs in our lives anytime and anywhere, whenever two surfaces touch each other. Electrical charge development emerges, when two materials are brought into contact (e.g. touched or rubbed) and then separated [1–3]. For instance, clinging of clothes, slight electrical shock when one touches a door handle in a dry day and sticking of dust and tiny particles on cell phone or computer screens occur due to static charge accumulation generated by contact electrification [4]. Static charge (or contact charge) accumulation causes not only these trivial frustrations, but also it leads to shocks and explosions [5,6], it damages satellites [7], electronic devices and circuits [8]. In industry (e.g., chemical, petrochemical, semiconductor and packaging), accumulated charges can spoil the production yields and product quality.
2
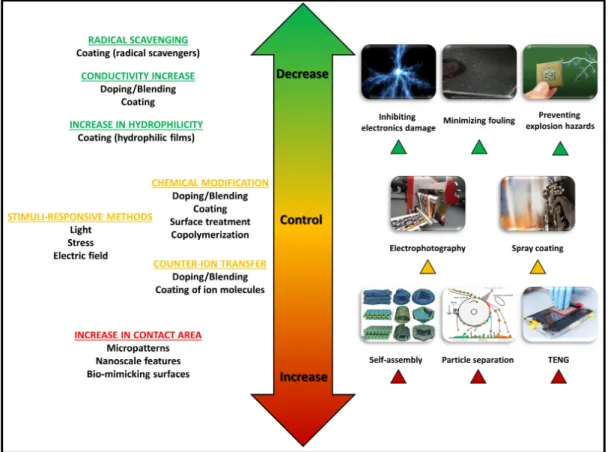
In particular, pharmaceutical industry, it is claimed that charged drug particles can undesirably aggregate and ruin the uniformity of end-products. Especially for powders and liquids, static charging can pose fire and explosion hazards as well [9]. Contact electrification has also many positive outcomes, if the phenomenon is handled properly [10]. It has many useful applications including electrophotography, electrostatic separation of particles, electrostatic spray coating and electrostatic self-assembly [11,12]. Recently, the most attractive application of contact electrification has become triboelectric nanogenerators (TENG). TENGS are mechanical energy harvester devices, which were first described by Wang group [13–15] as a promising approach to harvest mechanical energy and convert it into electricity, since triboelectrification is a universal and ubiquitous effect that is widely encountered in everyday life. The strategies for the utilization and control of CE are based on three different points: Controlling, increasing and decreasing the surface charges. The applications based on these approaches are shown in Figure 1.
3
Figure 1. Applications of contact electrification by controlling, decreasing, and increasing the surface charges.
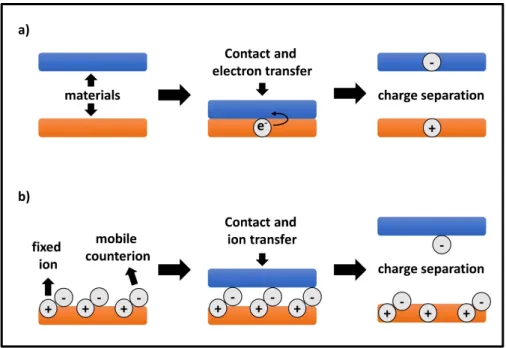
Contact electrification offers variety of applications as summarized in Figure 1 however, challenges still exist and cannot be dispelled unless contact electrification mechanism is totally understood. As chemical mechanism of contact electrification, two different mechanisms had been proposed in the previous decade: electron transfer and ion transfer [16,17]. The possible mechanisms of charge transfer upon contact are shown in Figure 2 below.
4
Figure 2. Previously proposed possible charge transfer mechanisms. (a) Transfer of an electron. (b) Transfer of an ion.
Material transfer on the other hand, plays a significant role in the mechanism of contact electrification. The reports in the last decade proved that, the mechanism is not solely based on electron and/or ion transfer. Evidently, the combination of charge and microscopic amount of material (approximately microgram per square centimeter) exchange between the contacting surfaces [18–20]. As these reports point out this material transfer upon contact can only happen, if the chemical bonds in the polymers are broken as a result of mechanical treatment (mechanochemical bond-cleavage) and bits of material is transferred between the surfaces. The species that form as products of the mechanochemical bond-cleavages are called as mechanoions and mechanoradicals [2].
5
1.1.1. Charge Mitigation: Radical Scavengers/Antioxidants
As it is mentioned before, surface charge accumulation-based hazards can be eliminated by doping the dielectric materials with conductive materials (e.g. metals, carbon powder, carbon nanotubes, and conductive polymer) or with additives to increase surface humidity (e.g. ions) [21,22]; however, distinct mechanical or electrical properties of the polymers are lost upon doping of the additive because of high doping concentrations required to achieve the percolation.
A newly introduced mechanism-based method for charge mitigation is the addition of radical scavengers into commonly used polymers. As mentioned above, mechanochemical bond-cleavages that occur during contact produces mechanoions and mechanoradicals. These mechanoradicals that are formed as a result of homolytic bond cleavage upon electrification are mostly peroxy radicals (ROO.) [18]
stabilized by resonance contributors [23]. These mechanoradicals can stabilize the co-formed mechanoions (“the charges”) via interaction of frontier molecular orbitals [2,24]. When the mechanoradicals are chemically scavenged by the radical scavenger additives, the mechanoions are destabilized and decay quickly (through commonly accepted mechanisms such as by reactions with molecules of air or migration into the bulk). Several radical scavenger compounds have been studied for this purpose and revealed remarkable results as shown in Figure 3 [2,18,25]. As stated above, radical scavenging method is superior to the conventional charge mitigation methods because the doping does not need conductive percolation and therefore smaller doping amounts can be used, which help to retain intrinsic properties of the native polymers [2].
6
Figure 3. (a) Surface charge lowering in polydimethylsiloxane (PDMS) by doping radical scavengers DPPH, tocopherol, and HALS. (b) proposed interaction of frontier molecular orbitals between mechanoradicals and mechanocations (left), and, mechanoradicals and mechanoanions (right) on contact-charged surfaces [2].
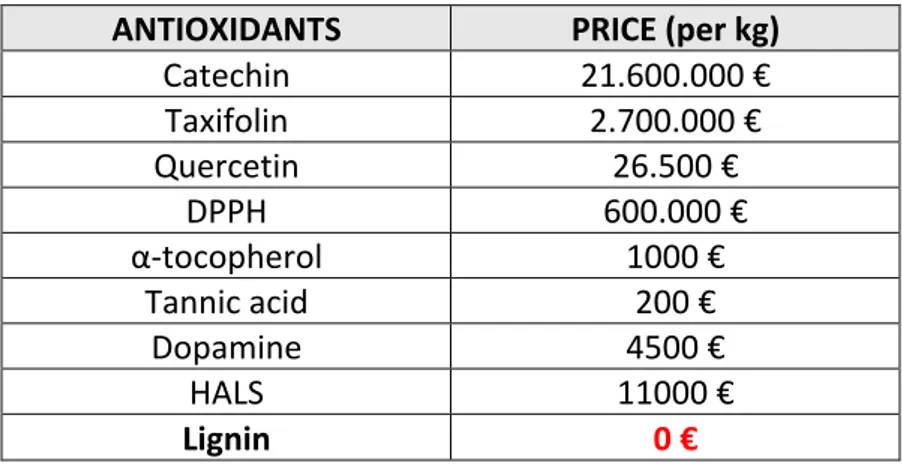
Table 1. Current (2019) prices of molecular antioxidants (radical scavengers) used as antistatic additive in the recent studies. Data taken from Sigma-Aldrich website.
ANTIOXIDANTS PRICE (per kg)
Catechin 21.600.000 € Taxifolin 2.700.000 € Quercetin 26.500 € DPPH 600.000 € α-tocopherol 1000 € Tannic acid 200 € Dopamine 4500 € HALS 11000 € Lignin 0 €
The examples of radical scavenger molecules used in charge mitigation on polymer surfaces are DPPH (2,2-diphenyl-1-picrylhydrazyl), (±)-α-tocopherol (Vitamin E), HALS (bis(1-octyloxy-2,2,6,6-tetramethyl-4-piperidyl)) sebacate [2], tannic acid, and polydopamine [26]. Nevertheless, those chemical compounds are relatively expensive (see Table 1) so that limits their applications in industry. The world plastic
a)
7
production has reached 350 million tons in 2017 according to Plastics Europe Market Research Group (PEMRG) report, thus listed radical scavengers are not feasible for such huge amount of demand, since their costs are not affordable in industry.
Scientists working to find industrially applicable additives for charge mitigation should target to a cheap and readily available material. Therefore, naturally abundant chemicals in the biomass are ideal candidates for such a purpose .
1.1.2. Triboelectric Series
Triboelectric series is a list of materials ranked by their tendencies to gain or lose net charges upon CE. The materials are sorted from the top as decreasing trend to charge positively (electron loss) and increasing trend to charge negatively (electron gain) upon contact with each other. There are also materials in the middle of the list, which do not show any propensity to either charge positively or negatively. Lists made from contact electrified materials date back to ancient Greece - the word “electricity” is derived from the Greek word ἤλεκτρον, which means amber (one of the materials used in the early experiments performed by Thales of Miletus more than 2500 years ago) [27]. Many different triboelectric series have been reported over the past 150 years [28–31], andDiaz and Felix Navarro have compiled the four published series in their report [32]. Although trends can be found in these lists, i.e. polar materials usually becoming positively charged and nonpolar ones becoming negatively charged upon contact with each other [17], the rankings of materials in triboelectric series are occasionally debated. Furthermore, there are sets of materials that produce a
8
cyclic triboelectric series [33] showing one physical property or one mechanism cannot explain all the examples of contact electrification. The idea of ranking triboelectric series has recently been completely refuted by contact charging of identical materials [34] and the reversal of sign of net charge on polymers by material transfer [19].
Figure 4. A triboelectric series of materials.
As can be seen in the triboelectric series, most materials get charged upon contacting each other – their sign of net charge may vary for different conditions, which is the source of ambiguities in different triboelectric series. However, there is one common material that appear at the middle of the list, as a non-charging material in all triboelectric series: “wood”. Recently, wood and its products has attracted great
9
attention due to their abundance in nature and owing to their sustainability. Why does wood not get contact charged? If the underlying reason of the case is examined, it can open a new pathway to obtain sustainable and cheap antistatic additives that can be used also at an industrial scale and lignin might be a reason for this special behavior of wood as we investigate in a following section.
1.2. Lignin
Lignin is one of the three main components of wood and it can be responsible for inability of contact charging in wood. Lignin is an antioxidant [35–37] with radical scavenging property [38–41] arising from its polyphenolic structure.
Lignin was discovered in 1838 by Anselme Payen, a French chemist who discovered cellulose for the first time by extracting it from wood using nitric acid and alkaline solutions. Payen did not only discover cellulose, he also isolated lignin and called it “incrustant”. In 1857, lignin was given its name “lignin” by German scientist Schulze [42].
Wood or lignocellulosic biomass is mainly composed of three constituents: cellulose, hemi-cellulose and lignin. Cellulose covers 30% – 50%, hemi-cellulose 20% – 30% and lignin is 15% – 30% of the lignocellulosic feedstock; the rest are pectin, wax, fats, and moisture. Lignin is the second most abundant bio-polymer after cellulose, and it consists of cross-linked polyphenolic units. Lignin is the most abundant natural aromatic polymer and is the main chemical source of aromatic building blocks on earth. Enzyme-mediated dehydrogenation polymerization, also called as lignification, is responsible for in-vivo production of lignin. Lignification results in an
10
amorphous cross-linked material with ether and carbon-carbon bonds (Figure 8) [43]. Cell tissues of primitive plants (e.g. algae) do not contain any lignin because of the fact that lignin is mainly located in the secondary cell walls (Figure 5), deposited during cell differentiation, which is responsible for the structural robustness of each cell, and also, for the integrity of whole plant. Lignin is a hydrophobic material responsible for water and nutrient transportation and provides protection against insects and microbial attack.
Lignin is a by-product of paper industry because lignin residues cause quality problems in paper production. Efficient lignin removal from the wood enhances the quality of the produced paper, so that millions of tons of lignin are discarded as waste each year in pulping industry. Waste lignin has so far only limited applications and it is usually burned for its caloric value. Recently, there are attempts to use lignin as the major source and starting material for the production of aromatic building blocks (benzene, toluene and xylene); however, only 2% of waste-lignin is converted to high-valued chemicals (organic compounds, biofuels, etc.) [44–46]. Disappointingly, the potential of lignin in terms of renewability and sustainability is still far from being fully used.
11
Figure 5. Illustration of a plant cell wall. Taken from [47].
1.2.2. The Chemistry of Lignin
Lignin contains three different cinnamyl alcohol monomers including p-coumaryl alcohol, coniferyl alcohol, and sinapyl alcohol (Figure 6). These monomers are found
in lignin as the phenylpropanoid forms p-hydroxyphenyl (H), guaiacyl (G), and syringyl (S), respectively. The monomer ratios differ on the basis of lignin source. Grassy plants contain all three monolignol monomers, while softwoods (e.g. pine and spruce tree) contain mainly coniferyl alcohol (G), and hardwoods (maple and birch tree) both coniferyl (G) and sinapyl alcohol (S) [46]. Chemical bonds, monomer content and radical polymerization steps of monolignols diversify the chemical structure of lignin from one origin to another and exact structure of each extracted (or isolated) lignin is extremely hard to be determined.
12
Figure 6. Standard three monolignol monomers of lignin. p-coumaryl alcohol (H), coniferyl alcohol (G), and sinapyl alcohol (S).
Chemical reactions between monomers enable the formation of vast variety of inter-unit linkages [45,48]. Lignin has plenty of the so called β-O-4 linkage (a bond between β-carbon of one monolignol unit and phenolic hydroxyl of the other) that accounts for 50% of all linkages in softwood. The rest of the bonds between the lignols are formed by other types of ether bonds involving α-O-4, 4-O-5, and C-C bonds β-β, 5-5, β-5 and β-1 (Figure 7) in addition, more complex lignin structures contain dibenzodioxocin linkages.
Lignin content of lignocellulosic biomass feedstocks varies from 2% to 40% by weight. Origin of lignin should be chosen wisely in order to achieve efficient extraction of lignin from its biomass source. Nutshell, maple, pine and birch have been used in this study as sources of lignin, which possess high weight percentages of lignin; 30% – 40%, 29.1%, 27.3%, 22%, respectively [49].
13
Figure 7. Most common linkages found in lignin. a) β-O-4, b) β-5, c) β-β’, d) 5-5’, e) 4-O-5, f) β-1.
Stability and degradation insusceptibility of lignin originate from the existence of plenty of covalent bonds in the polymer backbone, as well as strong presence of intermolecular interactions such as hydrogen bonding. Both the physical and chemical properties of lignin are dependent on the extraction method (pulping process) from the lignocellulosic material. There are several methods known for lignin isolation. The details of the lignin extraction methods are described in section 1.2.3. Softwood lignins have comparatively higher Tg (glass transition temperature)
values between 138 ⁰C – 160 ⁰C due to greater amount of intermolecular hydrogen bonds and condensed aromatic structures besides hardwood lignins show lower Tg
range (110 ⁰C – 130 ⁰C) [50]. Kraft lignin, which is a polymeric material obtained from native lignin by kraft pulping process, has a thermal stability that has been investigated. It was found that major weight loss (approx. 40 %) is in the range of 200 ⁰C – 600 ⁰C and the maximum weight loss is observed around 400 ⁰C. 15% of the weight of the lignin is lost before reaching 300 ⁰C. Tg varies between 124 ⁰C – 174 ⁰C
14
the other hand organosolv lignins (extracted lignin via organic solvents) have relatively lower Tg ranging between 91⁰C – 97 ⁰C [51].
Figure 8. Proposed chemical structure of a lignin.
Figure 8 shows the proposed chemical structure of a lignin; however, as it is mentioned before it is hard to elucidate the exact chemical structure of any lignin due to linkages that change from one lignin source to another and the whole structure varying with the extraction method of lignin from biomass. There are several spectroscopic techniques (e.g. 1H-,13C-,31P-NMR), used for disclosing the
structure of lignin. Even though the types of bonding and the amounts of sub-groups can be determined by these methods, there is no method that reveals the exact structure explicitly due to numerous bonding schemes and branching possibilities of the sub-units.
15
Figure 9. Resonance stability of phenoxy radicals on monolignols [48].
Lignins inherently have radicalic groups in the structure owing to the stability of the phenoxy radical (due to many resonance contributors as shown in Figure 9) that can form at the phenolic ends. These stable organic radicals in lignin have been studied comprehensively in terms of botanical origin, natural processes, pH dependence, mechanical, and temperature effects [52]. The results of these studies demonstrate different radicalic content depending on the origin of lignin and extraction methods, also proposed radicals as substituted ο-semiquinone type species can exist in different protonation states (Figure 10).
Figure 10. Chemical structure radical species of lignin at different pH conditions.
The pH value is the most influencing factor affecting the chemical structure of the radical species during extraction, different radical species can be determined by X-band EPR spectroscopy. In Figure 10, A, B, C, and D are referred to protonated,
16
deprotonated, and neutral radical structures. The EPR results proved that the protonated form is more pronounced at pH 1 while the deprotonated species C and D are the main species at pH 13. The neutral form B is dominant in mildly acidic conditions (pH 3.7 – pH 8.6) on the other hand the other species can be detectable as well in that pH range [53].
1.2.3. Lignin Extraction Methods
There are several techniques to isolate lignin from lignocellulosic biomass. These are classified into two based on the significant or mild structural modification of lignin during the isolation (Figure 11). Pulping methods including Kraft [54], Sulfite [55], Alkaline [56], and Klason [57] processes result in significant structural alterations of lignin under comparatively harsh conditions. In addition, Björkman process, ionic liquid treatment, and organosolv process have mild impacts on the chemical structure of lignin. For instance, kraft process modifies the lignin structure by breaking most α-β-aryl ether bonds also, sulfur rich structure forms due to the attack of hydrogen sulfide ions during the process. Sulfite process similarly yields to sulfonate groups on lignin structure, while the structure of lignin obtained through alkaline process becomes more sulfonic acid-rich. The Klason process comprises of sulfuric acid treatment of lignin and leads to major changes to the original structure of lignin. Structural alterations can still be observed under so called ‘mild isolation processes’ such as Björkman process, where isolation of lignin is obtained by harsh grinding of the material followed by organic/aqueous solvent extraction, which
17
causes an increase in the number of carbonyl and hydroxyl groups particularly in hardwood lignin. Cellulolytic enzyme, ionic liquid treatment and organosolv processes involve solvent extraction just like Björkman process, however, they less likely affect the lignin structure and yield more native-like lignin [58].
Consequently, it is obvious that all the isolation procedures have both advantages and disadvantages depending on the utilization of the extracted product, so that one should choose the method, which fits the intended/tolerable structural changes according to the desired final application of lignin. The extraction method used in this thesis is a synthetic combination of Klason process and Björkman process. It involves sulfuric acid treatment and extensive grinding (see section 2.2.1).
18
1.3. PDMS and Thermoplastic Polymers
Polydimethylsiloxane (PDMS) is the most common silicon elastomer [59], which was first synthesized by Wacker Chemie in 1950s. It is a robust, biocompatible and viscoelastic material. It can be easily molded, which enables the PDMS usage in a wide range of applications from medicine and cosmetics to microfluidic devices, and flexible electronics [60,61]. The polymer backbone consists of Si-O-Si bonds as shown in Figure 12. This structure provides flexibility, non-toxicity, non-flammability and electrical resistivity. Once cross-linked, the polymer is set in a defined shape and cannot be remolded.
Figure 12. Chemical structure of polydimethylsiloxane (PDMS).
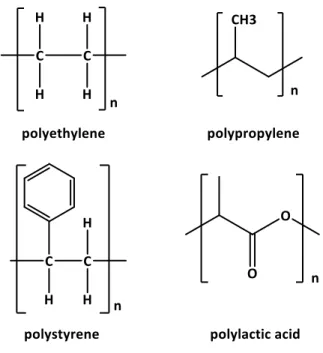
Thermoplastics are type of polymers that can be melted upon heating and solidified upon cooling which makes their remolding possible. There are many thermoplastic polymers in the market and used in daily life. For instance, polyethylene (PE) is commonly used in detergent bottles and portable gasoline cans (high-density polyethylene (HDPE)) or in durable goods boxes and squeeze bottles (low-density polyethylene (LDPE)). Polypropylene (PP) is used in making plastic food containers as well and as electrical cable insulation material. Polystyrene (PS) has variety of applications ranging from disposable cutlery to plastic parts of cars and boats. Polylactic acid (PLA) on the other hand, is a biodegradable thermoplastic produced
19
from renewable resources especially corn starch and is used in 3D printing. These are the examples of the common thermoplastics that are used in this work. Their chemical structures are shown in Figure 13.
Figure 13. Chemical structure of polyethylene (PE), polypropylene (PP), polystyrene (PS), and polylactic acid (PLA).
1.4. Aim of The Thesis
As mentioned above, finding a cheap, sustainable, and effective material that renders polymers/plastics antistatic without altering the doped material’s other characteristics will be beneficial for industrial scale applicability – since no such material exists in the market at the moment. Here, we assert that lignin can be a good candidate for an antistatic additive for common polymers. A recent work from our group showed a brief proof-of-principle [62] for the hypothesis that lignin might indeed may have such a potential as an antistatic additive. However, in this previous
20
work, there were no details about the mechanism of charge mitigation, without which it is impossible to take the steps towards an industrial product. The clear understanding of this mechanism not only helps understanding of contact charge dissipation but also helps identifying the mechanism of charge formation and the chemistry of the species formed during the contact of two surfaces. For the latter, there exists no chemical or spectroscopic method that can provide a full explanation, since the groups affected form only on the surface and even the surface methods fall too coarse (both spatially and temporally) in following the formation and the later fate of contact charges.
Here, we aim to provide a detailed view on how lignin addition to common polymers, elastomers and thermoplastics, can be used to mitigate contact charges on them. For this purpose, we probe the “usual suspects” in a mechanism for charge mitigation: 1) whether lignin addition increases the conductance of the doped polymers, 2) whether lignin, exhibiting natural radical scavenging property, can show a radical scavenging of mechanoradicals and hence remove them from the environment and destabilize charges, 3) whether the phenolic groups in lignin can act as H atom donors for mechanoradicals.
In order to test these, firstly various lignocellulosic feedstocks, namely nutshell, and maple, pine, birch tree barks (the choice is made from the ones possessing the highest reported lignin content) is investigated, and lignin is isolated from each biomass. Extracted lignins are characterized by several techniques: FTIR, NMR spectroscopy, TGA/DSC, XRD and imaged by SEM. Their radical and total phenol content determinations are pursued by the aid of UV-Vis spectroscopy. Then the
21
obtained material is doped into elastomeric PDMS and thermoplastics (PP, PLA, PE and PS) by mixing either the prepolymer (PDMS) or the heated thermoplastic with the lignin. The doped material is tested for any conductance increase, and contact charging/charge dissipation behavior in comparison with the undoped controls.
Some work is also devoted to investigate our initial hypothesis that wood does not get charged because of its lignin content. For this purpose, we have isolated lignin from wood and compared the charging/discharging behavior of de-lignified wood with the native, lignin containing sample.
22
CHAPTER 2
2. EXPERIMENTAL
2.1.
Materials
The nutshell was obtained from nuts grown in Gümeli village in the west black sea region, Turkey. Maple tree bark, pine tree bark and birch tree bark were collected from their natural habitat in Bilkent University Campus, Ankara, Turkey. Acids: Sulfuric Acid (95 – 97%), Acetic Acid (99.85%, glacial), Phosphoric Acid (85%), and Hydrochloric Acid (37%) (Sigma Aldrich) were used in the experiments. All the solvents including tetrahydrofuran, ethanol, isopropyl alcohol, 1,4-dioxane, and acetonitrile (Sigma Aldrich) were used without further purification. H2O2 solution,
FeCl3, K3Fe(CN)6, trimethylacetylchloride, and methyl-3,4,5-trihydroxybenzoate
(Sigma Aldrich) were used as obtained. NaOH (pellets) and Na2SO3 were purchased
from Carlo Erba. Arabic gum was purchased from an herbalist. Autoclave Reactor (30 mL) (PARR Instrument Company) was used in the extraction processes of lignin from nutshell and barks.
23
Retsch Molecular Test Sieves and Retsch Cryomill Grinder with LN2 tank were used
to decrease the particle size of the samples.
2,2-Diphenyl-1-picrylhydrazyl (DPPH) was purchased from Sigma Aldrich. Chromium(III) acetylacetonate (Sigma Aldrich) relaxation agent, deuterated chloroform with TMS (98%) (Merck KGaA), and extra dry pyridine (99.5%) (Acros) were used in NMR measurements. Cholesterol (Sigma Aldrich) was used as internal standard in 31P-NMR. Lignin samples were derivatized with
2-chloro-1,3,2-dioxaphospholane (Sigma Aldrich) prior to 31P-NMR. PDMS was prepared by using
Dow Corning Sylgard 184 Silicone Elastomer Kit. Thermoplastics (PP, PE, PS and PLA) were purchased from Sigma Aldrich. Aluminium stubs (Agar Scientific) were used to mount the samples for contact charge and decay measurements in the tapping device described below.
2.2. Experimental Procedures
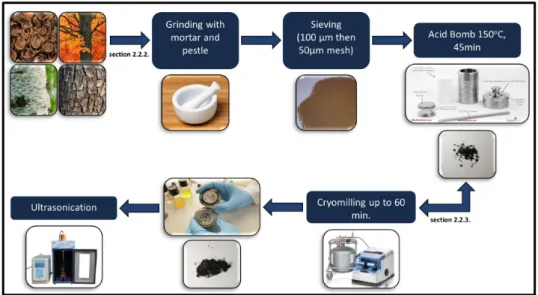
2.2.1. General Lignin Extraction and Particle Size Reduction Pathway
Figure 14. Extraction and particle size reduction flow-chart used in this thesis to obtain lignin from the mentioned sources.
24
All the lignin samples, regardless of their sources, were prepared using the same process pathway illustrated in Figure 14.
2.2.2. Lignin Extraction Procedure
Lignin sources (nutshell, and maple, birch, pine barks) were grinded with mortar and pestle, then sieved using 100 µm and 50 µm test sieves respectively. 5 g of each sample was taken into the autoclave reactor and 10 mL of 72% H2SO4 (diluted from
stock solution 95 – 97%) solution was added and mixed. The reactor was sealed and placed in an oven and was kept at 150 ⁰C for 45 minutes. The extracted samples were then washed with distilled water several times and the solid lignin was collected by suction filtration. A pinch of extracted lignin sample was dissolved in 1,4-dioxane to measure the pH of the solution, which should be around 4 – 5. Extracted samples were dried overnight under vacuum at 40 ⁰C.
2.2.3. Particle Size Reduction Procedure
Extracted lignin samples were placed in a zirconia grinding chamber and milled via Retsch Cryomill device with 6 zirconia balls (diameter: 10.06 mm) at 30 Hz frequency for the given grinding times (5 – 60 min) at -196 ⁰C (77 K). Low temperature is achieved by circulation of liquid nitrogen around the grinding chamber of the device during grinding operation.
25
Ultrasonication was performed for further reduction of particle size – which is necessary to get a homogeneous doping and increased surface area of lignin particles- of the cryomilled lignin samples. UP200St Hielscher ultrasonic horn was used and performed at 20 kHz frequency and 200 W at 0 ⁰C. 100 mg of each lignin sample was dissolved (due to low solubility of lignin in 1,4-dioxane, they form a suspension) in 20 mL of 1,4-dioxane and were sonicated for certain time intervals up to 60 minutes. The samples were placed into ice-bath to avoid overheating on the
ultrasonic probe, also the sonication was taken a rest for 60 seconds of every 5 minutes.
Malvern Zeta Sizer Nano instrument was used to perform particle size distribution analyses. The instrument allows the determination of the sizes of particles in a range of 0.3 nm to 50 µm by differential light scattering method. Particle size distribution of 10 mg of lignin samples suspended in 10 mL of 1,4-dioxane solution was recorded immediately after preparation of the samples. Each measurement was performed three times and standard deviations were calculated.
2.2.4. Structural and Chemical Characterization of Lignin
Chemical and structural properties of extracted lignin samples were characterized by several techniques: FTIR spectroscopy, Prussian Blue Method for Total Phenol Content Determination, Mechanoradical Content Determination by DPPH test, Gel Permeation Chromatography (GPC), NMR spectroscopy (13C-NMR and 31P-NMR),
TGA/DSC, X-Ray Diffraction (XRD). The samples were also imaged by Scanning Electron Microscopy (SEM).
26
2.2.4.1. FTIR Spectroscopy
The functional groups of the lignin samples have been investigated by FTIR-ATR using Bruker Alpha FTIR-ATR Spectrometer. All samples were analyzed with spectral width of 4.000 – 400 cm-1 and 64 scans at a resolution of 4 cm-1. The spectra were baseline
corrected and transmittance percentage was given as normalized data.
2.2.4.2. Prussian Blue Method for Total Phenol Content (TPC)
Determination
Reagents
• 0.02 M FeCl3 Solution in 0.10 M HCl
8.3 mL of the concentrated HCl was diluted to 1 L with distilled water and 3.24 g anhydrous ferric chloride was dissolved in 1 L of the 0.10 M HCl solution. The solution has a pale-yellow color.
• 0.016 M K3Fe(CN)6 Solution
5.26 g of potassium ferricyanide was dissolved in 1 L of distilled water. The solution has a yellow color.
• Stabilizer Solution
1.0 g gum arabic was dissolved in 80 mL of distilled water by boiling for 25 minutes. The solution was filtered, and the filtrate was diluted to 100 mL.
27
diluted to 50 mL with distilled water. The stabilizer solution was refrigerated. (remains stable for 1 week.)
Procedure
Exactly 5.00 mg of cryomilled lignin (polyphenol) sample was dissolved in 0.1 mL of 1,4-dioxane. 3.00 mL deionized water was added and vortexed. (Poor quality water, particularly iron-containing water may give unacceptable results!) 1.00 mL of freshly prepared FeCl3 solution was added to the mixture, followed by 1.00 mL of freshly
prepared K3Fe(CN)6 solution, just 1 minute after the addition of FeCl3 solution. The
mixture was mixed by stirring bar for exactly 24 hours to complete the reaction. (Reaction duration was followed by UV-Vis Spectra for 0, 24, and 48 hour reactions, then 24 hours was chosen as optimum time according to the maximum absorbance (Figure 29-a)). 5.00 mL of stabilizer (gum arabic solution) was added to terminate the reaction and the absorbance maximum of Prussian blue (Fe4[Fe(CN)6]3) at 700 nm
was recorded. 5 identical preparations for each lignin sample were made and they measured using the same procedure by 10-fold dilution of the final mixture.
For obtaining the standard values of phenol content, methyl gallate (methyl-3,4,5-trihydroxybenzoate) standard was prepared by weighing exactly 5.00 mg of methyl gallate. The standard was tested identically through the procedure described above except that this time only 30 minutes was enough to acquire stable blue color for the standard samples. After 30 minutes the reaction was stopped by addition of 5.00 mL of stabilizer solution then the absorbance of the formed Prussian Blue (Fe4[Fe(CN)6]3)
28
at 700 nm was measured by 10-fold dilution of each sample. 5 identical standard samples were prepared for calculation of standard deviation.
2.2.4.3. Mechanoradical Content Determination by DPPH Test
0.2 mg of lignin (5 to 60 min cryomilled) was added into 50 μL, 1.3x10⁻¹ M
2,2-diphenyl-1-picrylhydrazyl (DPPH) solution prepared in ACN. The mixture was diluted to 5 mL (a stock DPPH-lignin solution) with ACN and waited for desired hours. Then, 0.5 mL of DPPH-lignin solution was diluted again to 5 mL with ACN just before UV-Vis measurement in each time interval. A control solution of DPPH in ACN was also prepared with the same molarity and the absorbance of the solutions at 517 nm (the absorbance maximum of DPPH) were followed in the solutions’ UV-Vis absorption spectra. Each sample was re-measured after indicated waiting times and any decreases in the absorbance were tracked. The consumption of the DPPH by mechanoradicals was monitored from the decrease in the absorbance of DPPH and the number of cryomilling generated mechanoradicals were calculated from this decrease.
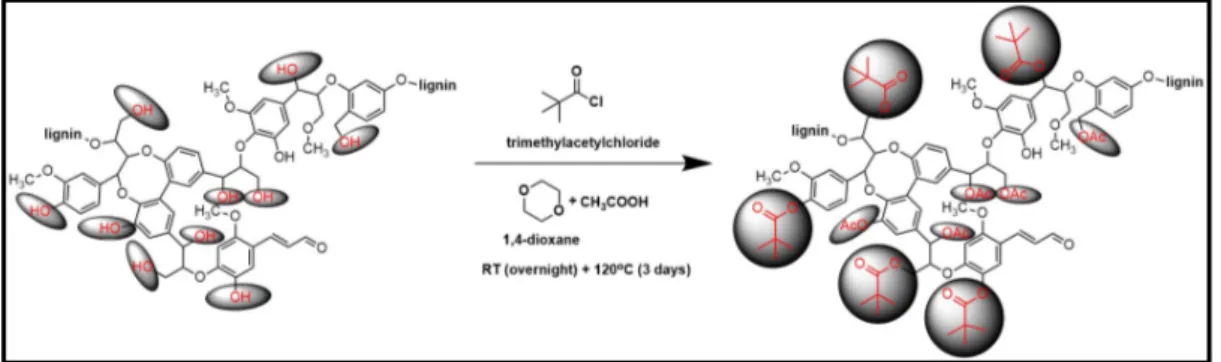
2.2.4.4. Solubility Enhancement by Acylation of Lignin
Extracted, cryomilled and ultrasonicated lignin samples are not soluble in any solvent, they form a suspension in 1,4-dioxane and are slightly soluble in pyridine. Their solubility problem prevents their characterization by conventional methods,
29
e.g. by UV-Vis or GPC). Therefore, we tried to enhance their solubility by acylation with trimethylacetylchloride, as shown in Figure 15. The detailed acylation procedure is also given below.
Figure 15. Acylation reaction scheme of lignin with trimethylacetychloride.
Exactly 20 mg of cryomilled lignin samples were weighed and dissolved in 20 mL of 1,4-dioxane then 5 mL acetic acid was added drop by drop while mixing. The solution was stirred overnight at room temperature. Excess amount of trimethylacetylchloride (10 mL) was added and refluxed for 3 days at 120 ⁰C. Acetic acid and excess of trimethylacetylchloride were evaporated with a rotary evaporator, followed by high vacuum drying of the obtained product at 40 ⁰C for 24 hours.
30
2.2.4.5. GPC Measurements for Molecular Weight Determination
All acylated lignin samples were dissolved in THF (HPLC grade, without stabilizer) to obtain 1 mg/mL solutions for the GPC analysis (Figure 16). Samples were filtered using a PTFE syringe filter (0.45 μm pore size). After filtration, they were injected into the SEC system. The SEC system (Agilent, Santa Clara, CA, USA) used includes a degasser, isocratic pump, auto sampler, diode array UV detector (Agilent 1200 series ELSD); the mobile phase was THF (HPLC grade, without stabilizer) with a flow rate of 0.6 mL/min. The column used was 6.2 mm × 250 mm Agilent Zorbax PSM 300-S
(particle size: 5 µm). The system was calibrated with polystyrene standards (575, 1530, 3950, 10210, 29510, 72450, 205000, 467000 Da) using ELSD detector.
2.2.4.6.
13C-CP/MAS NMR Spectroscopy
Due to the low solubility of lignin in many deuterated organic solvents (e.g. CDCl3),
solid state 13C-NMR was performed. Lignin samples were analyzed by 13C-CP/MAS
(Cross-polarization/Magic angle spinning) NMR (Nuclear Magnetic Resonance). The analyses were carried out using Bruker Avance 300 MHz WB Superconducting FT NMR Spectrometer equipped with 4 mm MAS probe. For acquisition of 13C-CP/MAS
NMR spectra, relaxation delay of 4 s, and spin rate of 8.5 kHz were used. The spectrum shown in the results were derived from 7000 scans, with the chemical shifts given as δ ppm in the range of 0 – 210 ppm. The NMR spectrometer was calibrated against pure glycine sample before the measurements.
31
2.2.4.7.
31P-NMR Spectroscopy
The most common procedure for the 31P-NMR analysis of lignin samples presented
in the literature [63] was adopted in our analysis: 30 – 40 mg lignin was sonicated in CDCl3 in order to decrease the particle size and enhance the solubility. Then, 500 µL
of lignin-CDCl3 solution were taken into NMR tube and a few drops of dry pyridine
was added. The derivatization reagent 2-chloro-1,3,2-dioxaphospholane (100 µL) was added into the NMR tube and the mixture was vortexed for 5 minutes. Cholesterol (10 mg/mL) (an internal standard) and chromium (III) acetylacetonate (5 mg/mL) (a relaxation agent) were dissolved in the mixture of 1.6 eq. pyridine/1 eq. CDCl3 (v/v). 100 µl of the freshly prepared solution was taken into the NMR tube and
vortexed for 1 minute. For acquisition, standard experimental procedure of Bruker Avance 400 MHz NMR spectrometer for 31P-NMR analysis was used. The results were
collected as 2000 scans and all chemical shifts were reported according to hydrolysis product of phosphorylation reagent peak, which was observed at 121.1 ppm.
2.2.4.8. Thermal Stability Analyses (TGA/DSC) of Lignin
Thermal stability of lignin was determined by thermogravimetric analysis (TGA) method using TA Instruments Q500 TGA device. 5 – 8 mg of samples were weighed and scanned from 25 ⁰C to 900 ⁰C.
Glass transition temperature (Tg) measurements of the samples were performed
32
at a heating rate of 20 ⁰C/min from 25 ⁰C to 200 ⁰C. A heating rate of 20 ⁰C/min was used, because the glass transition peaks are sharper at faster heating rates.
2.2.4.9. X-Ray Diffraction (XRD) Analysis
XRDs of cryomilled and non-cryomilled lignin were recorded on X’Pert PRO, PANalytical model X-ray diffractometer with Cu Kα radiation. 40 mA current and 45 kV accelerating voltage were applied.
2.2.4.10. Scanning Electron Microscopy (SEM) Analyses
The surface morphology of non-cryomilled and cryomilled lignin samples (5 – 60 minutes) were imaged using Thermo Fisher Scientific Quanta 200F model SEM
with an accelerating voltage of 15kV.
2.2.5. Lignin Doping to The Polymers
After extraction of the lignin samples, the samples were cryomilled and then ultrasonicated in order to reduce the particle size and increase the surface area. Ultrasonicated samples have smaller particle size (see section 3.1.1); however, ultrasonication can only be performed in solution and after evaporation of the solvent it is clearly seen that particles can agglomerate in the solid state. Therefore,
33
thermoplastics (PE, PP, PS, PLA) and elastomers (PDMS) were doped with only cryomilled lignin. Thermoplastics were chosen among the most common engineering polymers currently used in many industries and as an example of an elastomer, PDMS was chosen due to great advantage of forming smooth surface on flat molds upon curing.
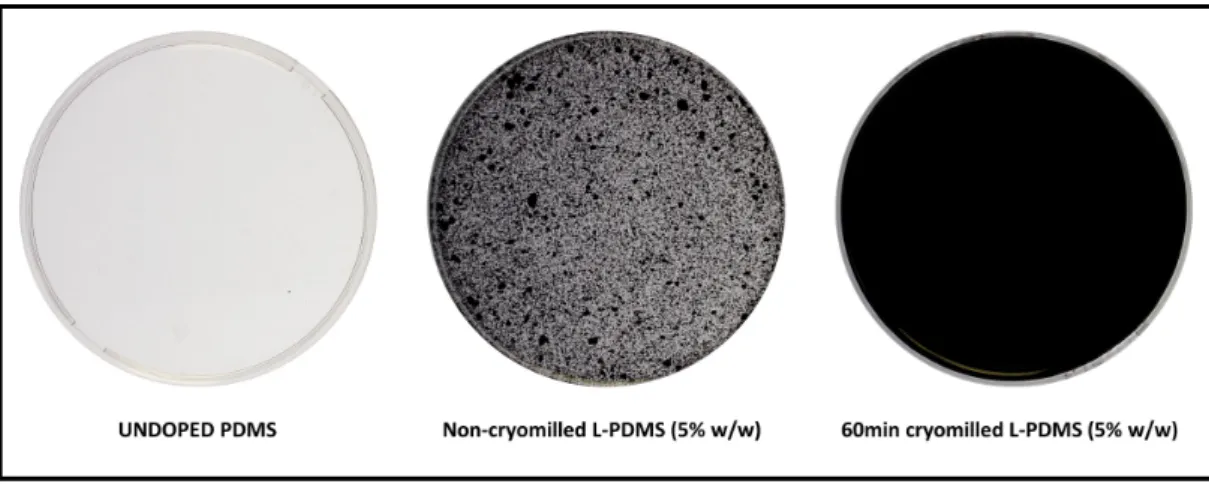
2.2.5.1. Lignin Doping to PDMS (Polydimethylsiloxane)
PDMS (Sylgard 184) was prepared by mixing the base and the curing agent in 10:1 ratio and cryomilled lignin (up to 5% w/w) was added by mixing vigorously. After that, the mixture was poured in a petri dish of 1.5 cm height and cured in oven for 4 hours at 60 ⁰C (thickness: 0.2 cm). Then, additional 0.4 cm pure PDMS layer was cured onto lignin-doped PDMS layer in order to handle the samples easily upon electrical measurements. The prepared samples are shown in Figure 17. Cured PDMS-Lignin composite (thickness: 0.6 cm) was cut into 1x1 cm pieces. The smooth surface of lignin-doped PDMS touching with petri dish was used in contact electrification tests. The homogenous 60 minutes cryomilled lignin doped samples were used in all measurements.
34
Figure 17. Images of Pure (undoped) PDMS, non-cryomilled lignin doped PDMS and 60 min. cryomilled lignin doped PDMS.
2.2.5.2. Lignin Doping to Thermoplastics (PE, PP, PS, PLA)
All thermoplastics were melted on the hot-plate and pressed with thick Teflon plate in order to achieve a smooth surface. Lignin doping concentration was chosen as 5% (w/w). Polyethylene, polypropylene, polystyrene and polylactic acid were doped with lignin by vigorous mixing of added lignin in melted polymer on aluminum plates. The melt was poured between Teflon plates and was pressed from top. The sample was let to solidify at room temperature. Then, the doped-polymer was taken out from the hot-plate, remained still until the polymer was re-solidified. The same thickness of the doped-polymers was acquired by the aid of Teflon plate and aluminum plates where the polymers melted and doped among them.
The lignin-doped thermoplastics were cut by a laser-cutter into circular pieces of 1.5 cm diameter in order to mount them easily onto the stubs connected to electrodes. These pieces were used in contact electrification measurements without any other alteration.
35
2.2.6. Preparation of Lignin-Free Wood
Lignin was removed from limba wood (Terminalia Superba) by several extraction processes similar to that used in paper industry. In the method, 2.5 M NaOH and 0.4 M Na2SO3 solution was prepared by dissolving 50 g of (equal amount of) each
substance in 500 mL of distilled water. The solution was stirred until all the substances were dissolved and taken into a flask. Wood pieces (1.5 cm x 10 cm x 1.5 cm) were placed in the solution and the solution was refluxed overnight at 110⁰C, by which time a brownish-red solution of lignin forms. This solution was poured off and the wood was washed 3 times with distilled water. Then, wood sample was boiled (bleached) with H2O2 solution (500 mL, 9.8 M) for 3 hours in order to remove the
lignin and get lignin-free white wood. The white wood sample was washed with distilled water 3 times more and dried under vacuum at 60 ⁰C.
The obtained lignin-free wood can be seen in Figure 47-b. Since the contact electrification experiments give better results (with small standard deviation) with smooth surfaces and the obtained lignin-free wood is rough, in order to have smooth surface of the wood samples, the lignin-free wood was cryomilled for 5 minutes (Figure 47-c) and pressed into a pellet (diameter: 1.4 cm) using hydraulic pellet press (under 5100 bar).
36
2.2.7. Electrical Measurements
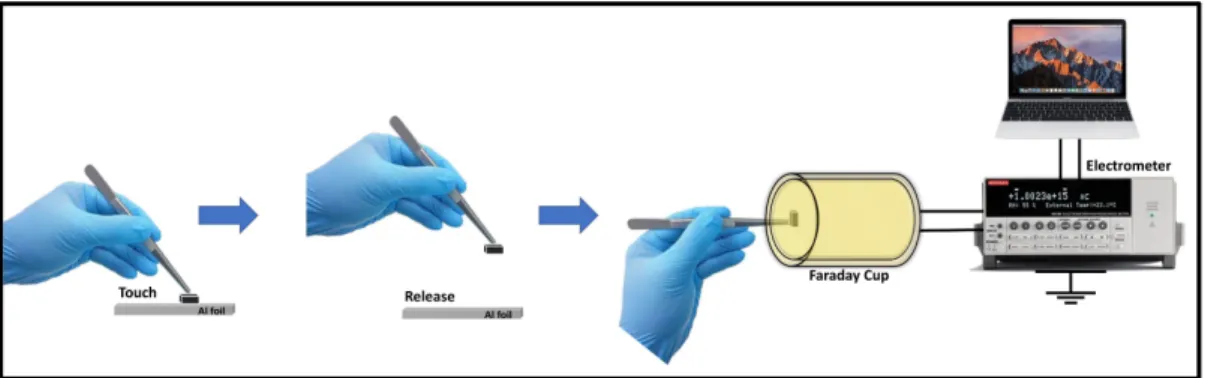
2.2.7.1. Charge Density Measurements
Electrostatic charge on the polymer surfaces were measured by immersing the polymer pieces in a Faraday cup attached to an electrometer (Keithley 6517B). Lignin-doped and undoped PDMS samples were contact charged against Aluminum foil up to 200 touches (Figure 18) to record the maximum charge density that can be obtained on the surfaces. Since it is harder to manipulate hard plastics with tweezers during this process, charging behavior of thermoplastics were monitored using a separate method that utilizes a homemade tapping device attached to an oscilloscope. In this method, surface electrical potential of thermoplastics that increases upon contact charging is recorded as the signal. Samples were placed to the one of the electrodes (base electrode) Aluminum stub were placed to the other electrode (counter electrode) and open circuit voltages were measured and collected from saturated signals (signals that accumulated charges are at their maximum values). 1 Hz tapping frequency were used in all of the measurements (Figure 19). For some samples, due to low propensity for charging on Al), PTFE (Teflon) coated stub surface was also used as counter electrode. All the samples were prepared and measured independently, at least 3 times for calculating standard deviation.
Previously extracted and cryomilled pine bark lignin was mixed with lignin-free wood at 1% to 50% (w/w) ratios by 5 minutes cryomilling. Then all the samples (doped- undoped wood and pure pine bark) were shaped as pellet (as shown in Figure 48), attached to the aluminum stubs with carbon tape. The electric potential acquired on
37
the samples upon tapping against PTFE (in a setup shown Figure 19) were recorded as Voc.
Figure 18. Illustration of Contact Electrification Measurement Setup-1. Determination of maximum net charge density on the polymer surfaces after contact.
Figure 19. Illustration of Contact Electrification Measurement Setup-2. Determination of surface electric potential upon contact and separation events.
2.2.7.2. Charge Decay Measurements
Before charge decay experiments, PDMS pieces were left to discharge for at least 24 hours in isolated container. The electroneutrality of these pieces was confirmed by immersing the pieces in a homemade Faraday cup connected to a high precision
38
electrometer (Keithley Instruments, model 6517B) that measures electrical charge. Only pieces with net charge densities below the electrometer’s detection limit (<±0.005 nC/cm2) [2] were considered as neutral. Undoped and doped PDMS pieces
were charged against aluminium foil several times in order to reach the highest surface charge (charge saturation point). Then, samples were kept immersed in the homemade Faraday cup for 30 minutes. Charge decay rates were calculated using OriginPro2017, by linear equation fitting.
2.2.7.3. Surface Conductance Measurements
In order to investigate whether the fast decay in case of lignin doping is caused by the increase in surface conducitivity of doped pieces, surface conductance of PDMS and 5% lignin doped PDMS samples were measured using two probe method connected to electrometer, which acts also as a voltage source upon current measurements (Figure 20-a). Current versus voltage curves of undoped PDMS and 5% lignin doped PDMS was obtained via probe station (with w = 1 cm wide samples
(1 cm x 1 cm square pieces), and the distance between copper electrodes d = 100 µm) and the applied voltage was changed from 0 to -100 and 0 to +100 V in
steps of 10 V, which gave identical results in terms of surface conductance (Figure 20-b). From the slopes of the I-V curves, the values for surface resistance, Rs were
calculated according to equation Rs=(V/I)·(w/d) in Ω. Then, surface surface
resistivities were converted to surface conductance (σ) using the equation σ = 1/Rs.
Standard deviations of the surface conductivities were calculated from at least 3 independent measurements.
39
Figure 20. (a) Illustration of surface conductance measurement setup. (b) Electrical circuit scheme of the two probe method.
a)