ESSAYS ON APPLIED MACROECONOMICS A Master’s Thesis by ONUR İNCE Department of Economics Bilkent University Ankara July 2005
ESSAYS ON APPLIED MACROECONOMICS
THE INSTITUTE OF ECONOMICS AND SOCIAL SCIENCES OF
BILKENT UNIVERSITY
BY
ONUR İNCE
IN PARTIAL FULFILLMENT OF THE REQUIREMENTS FOR THE DEGREE OF MASTER OF ARTS in THE DEPARTMENT OF ECONOMICS BİLKENT UNIVERSITY ANKARA JULY 2005
I certify that I have read this thesis and have found that it is fully adequate, in scope and in quality, as a thesis for the degree of Master of Arts in Economics
Asst. Prof. Ümit ÖZLALE Supervisor
I certify that I have read this thesis and have found that it is fully adequate, in scope and in quality, as a thesis for the degree of Master of Arts in Economics
Assoc. Prof. Hakan BERUMENT Examining Committee Member
I certify that I have read this thesis and have found that it is fully adequate, in scope and in quality, as a thesis for the degree of Master of Arts in Economics
Asst. Prof. Levent ÖZBEK Examining Committee Member
Approval of the Institute of Economics and Social Sciences Prof. Erdal EREL
ABSTRACT
ESSAYS ON APPLIED MACROECONOMICS İnce, Onur
Master of Economics
Supervisor: Asst. Prof. Ümit Özlale July, 2005
This study contains three studies, the relationship between FED intervention and emerging markets, the effect of S&P500 return on Istanbul Stock Exchange and the connection between Turkish industrial production growth and the success of Beşiktaş. The second chapter analyzes the effect of FED intervention on emerging markets with using event-study analysis. Considering Emerging Market Bond Index (EMBI) and grouping the effect under five different categories, the effect of FED intervention on emerging markets are shown. The third chapter assesses the effect of S&P500 return on the Istanbul Stock Exchange within a dynamic framework. In order to capture the effect, we build a block recursive VAR model allowing that S&P500 affects the ISE returns with its current and lag values but not vice versa. The estimates from daily data suggest that returns on S&P500 affect ISE return positively up to 4 days. The fourth chapter investigates the connection between Turkish industrial production growth and the success of Beşiktaş, which is a popular Turkish soccer team. The empirical evidence provided in the paper suggests that industrial production growth tends to increase with the success of Beşiktaş in European cups. Moreover, if the winnings are in displacement, the increase in industrial production
is higher than if the winnings are in the home field. On the other hand, findings on the effects of domestic games on industrial performance are not statistically significant.
Keywords: Block Recursive VAR, EMBI, Emerging Markets, Event Study Analysis, Industrial Production, Sports Economics
ÖZET
UYGULAMALI MAKROEKONOMİ HAKKINDA ÇALIŞMALAR İnce, Onur
Yüksek Lisans, İktisat Bölümü Tez Danışmanı: Yrd. Doç. Dr. Ümit Özlale
Temmuz, 2005
Bu çalışma, FED müdahalesi ve gelişmekte olan ülkeler arasındaki ilişkiyi, S&P500 getirisinin İstanbul Menkul Kıymetler Borsası’na etkisini ve Türkiye’deki endüstriyel üretim büyümesi ile Beşiktaş arasındaki bağlantıyı inceleyen üç çalışmadan oluşmaktadır. İkinci bölümde olay inceleme analizi kullanılarak FED müdahalesinin gelişmekte olan ülkelere etkisi incelenmektedir. Gelişmekte olan piyasalar endeksi (EMBI) göz önünde bulundurularak FED müdahalesi beş kategori altında gösterilmiştir. Üçüncü bölümde S&P500 getirisinin İstanbul Menkul Kıymetler Borsası’na etkisini aktif çatı altında incelenmektedir. Etkiyi yakalamak için blok özyineli VAR modeli kullanılmış, böylelikle S&P500 endeksinin cari ve önceki değerlerinin İMKB getirisine etkisi incelenmiş ve İMKB getirisinin S&P500 endeksine etkisi engellenmiştir. Günlük veri kullanılarak S&P500’e gelen pozitif bir şokun İMKB getirisini pozitif olarak 4 güne kadar etkilediği görülmüştür. Son bölümde Türkiye’deki endüstriyel üretim büyümesi ile popüler futbol Türk takımı Beşiktaş arasındaki bağlantı irdelenmiştir. Ampirik gözlem yapılarak Beşiktaş’ın Avrupa Kupalarındaki başarısının endüstriyel üretim büyümesini arttırdığı
görülmüştür. Bununla beraber deplasmanda kazanılan maç, evde kazanılan maça göre endüstriyel üretimi daha çok arttırmaktadır. Öte yandan Türkiye liginde oynanan maçların endüstriyel üretime etkisi istatiksel bir kesinlik içermemektedir.
Anahtar Kelimeler: Blok Özyineli VAR, EMBI, Endüstriyel Üretim, Gelişmekte Olan Piyasalar, Olay İnceleme Analizi, Spor Ekonomisi
ACKNOWLEDGEMENTS
I would like to thank Asst. Prof. Ümit Özlale, Assoc. Prof. Hakan Berument and M. Eray Yücel for their invaluable contributions through the development of this thesis. I also want to indicate the great supports of Selin Sayek, Anita Akkaş, Ozan Acar, Tural Huseynov and Barış Esmerok within the time in my education at Bilkent University.
TABLE OF CONTENTS ABSTRACT...iii ÖZET...v ACKNOWLEDGMENTS...vii TABLE OF CONTENTS...viii LIST OF TABLES...ix LIST OF FIGURES...x CHAPTER 1: INTRODUCTION...1
CHAPTER 2: THE EFFECT OF FED INTERVENTION ON EMERGING MARKETS...4
2.1 Literature Survey...4
2.2 The Model...6
2.3 Results...10
2.4 Conclusion...14
CHAPTER III: EFFECT ON S&P500’S RETURN ON EMERGING MARKETS: TURKISH EXPERIENCE...15
3.1 Literature Survey...15
3.2 Methodolgy...17
3.3 Conclusion...20
CHAPTER IV: SUCCESS IN SOCCER AND ECONOMIC PERFORMANCE: EVIDENCE FROM BEŞİKTAŞ-TURKEY...21
4.1 Literature Survey……….………21
4.2 Turkish Soccer Game Structure………...25
4.3 Emprical Analysis………..………...……...27
4.3.1 Modeling Approach and Variable Definitions...27
4.3.2 Data...30
4.3.3 Model Estimates...30
4.4 Conclusion...33
LIST OF TABLES
1. Table 1 Tests of Number Of Factors That Influence The Change in The EMBI
Spread... 40
2. Table 2 Both Actual and Surprise Change is Positive...41
3. Table 3 Actual Change Is Positive Surprise Change Is Negative...42
4. Table 4 Both Actual Change And Surprise Change Is Negative...43,44,45 5. Table 5 Actual Change Is Negative And Surprise Change Is Positive...46,47 6. Table 6 No Surprise...48
7. Table 7 Estimated models: 1992:08-2002:10 a...48
8. Table 8 Estimated models: 1992:08-2002:10 a...….49
9. Table 9 Estimated models: 1995:01–2000:10 a...50
LIST OF FIGURES
1. Figure 1: Actual And Surprise Component Changes In 2004...52 2. Figure 2: Response of the ISE100 to the S&P500 for the full sample...52 3. Figure 3: Response of the ISE100 to the S&P500 from 23.10.1987 to
01.12.1993...53 4. Figure 4: Response of the ISE100 to the S&P500 from 01.06.1994 to
01.12.1999...53
5. Figure 5: Response of the ISE100 to the S&P500 from 01.01.2000 to
01.11.2000...54 6. Figure 6: Response of the ISE100 to the S&P500 from 13.03.2001 to
10.09.2001...54 7. Figure 7: Response of the ISE100 to the S&P500 from 01.01.2002 to
28.02.2003...55 8. Figure 8: Response of the ISE100 to the S&P500 from 01.05.2003 to
CHAPTER 1
Introduction
This study is comprised of three chapters. In chapter 2, an event-study is used to throw light on the missing link between Federal Reserve actions and emerging markets. The effect of S&P500’s return on Istanbul stock exchange is examined in Chapter 3. Finally in the last chapter, the relationship between industrial production growth and the wins of the Turkish soccer team Beşiktaş in European cups is explained.
The financial markets of countries that are not full industrialized are somehow very sensitive to the performance of industrialized economies. Within the fast globalization process, as financial markets grow closer, the policymakers of highly industrialized countries can surely affect emerging market economies. The Federal Reserve, the authority that executes the monetary policy of the US, generally balances the US financial markets using interest rates, the main policy tool of monetary policy. However the change in US financial markets in order to adopt the new policies executed by the FED, automatically affects emerging market economies that are closely connected to US financial markets. Accordingly, it is possible to reveal the link between emerging markets and Federal Reserve actions. Using the Emerging Market Bond Index (EMBI), which exhibits the risk premium of emerging market economies, the relationship between FED actions and the EMBI of 12 emerging markets are examined using event-study methodology in chapter 2.
In the light of the relationship between highly industrialized economies and emerging market economies, the correlation for the asset market side can be explored by analyzing the relationship between the US asset market and the asset market of an emerging economy, Turkey. S&P500 can be employed to select a proxy measure for
the US asset market. A market value weighted index, with each stock's weight in the index proportionate to its market value, the S&P500 is one of the most commonly used benchmarks of the overall stock market in the US. While the S&P500 is employed as a proxy measure for the US market, the ISE100 index is used as a proxy measure for the Turkish asset market. The ISE100, calculated since the inception of the Istanbul Stock Exchange, is composed of all National Market companies except investment trusts. The constituents of the ISE100 Index are selected on the basis of pre-determined criteria. The ISE100 index also contains the companies in the ISE30 index and the ISE50 index. In order to reflect the relationship between a large country and a small country, block recursive VAR is used. Block recursive VAR model provides a barrier to eliminate the effect of the performance of a small country on a large country. Although the performance of the US stock exchange is determined by its own dynamics, its own lag and foreign stock exchange movements affect the performance of the Turkish stock market. By estimating the impulse response functions for 20 days regarding how the ISE100 returns responded to a one-standard deviation shock to S&P500, it is found that the returns on the S&P500 affect the ISE100 return positively up to four days.
In the last chapter, the connection between sport activities and economic performance is addressed to illustrate the importance of soccer in determining Turkish people’s psychological well-being and the happy-worker hypothesis, the effect of the success of Beşiktaş, one of the top ranked soccer teams in Turkey, on Turkish industrial performance is examined. It is assumed that the success of a popular team in Turkey may be able to motivate workers positively and increase their economic performance. Using a transfer function analysis, a game being won by Beşiktaş in European cup competitions can cause an increase in the monthly rate of
industrial growth. The increase is higher if the winning game in Europe is played in the opponent’s field. However, for the games won by Beşiktaş in Turkey, a significant relationship does not exist.
CHAPTER 2
The Effect of FED Intervention on Emerging Markets
2.1 LITERATURE SURVEY
It has been well documented that the financial markets react strongly to the policy changes of the FED. In, 2004, the FED increased the future fund rates 5 times (out of 8 meetings) with a value of 0.25. As a matter of fact, all these announcements had different effects on markets. In this respect, the responses of the markets to surprise changes in federal funds rates receive considerable interest. Figure 1 illustrates how markets anticipate the federal funds rates change.
Kuttner (2001) identified the actual and surprise components of FED announcements on markets. He stated that if the announcement made by the FED at time t was expected, then the spot rate would remain unchanged. Any deviation from the expected rate would result in a change in the futures rate, by an amount proportionate to the number of days affected by the change. There is a considerable literature that investigates the policy changes of the Federal Reserve. Cook and Hahn (1989) observed the one-day response of bond rates to changes in the target federal fund rates from 1974-1979 and found that the response to target rate increases was positive and significant at all maturities. However, they did not deal with the surprise component of federal funds rates. The gap was fulfilled by Kuttner (2001) and Bernanke and Kutner (2003). Kuttner (2001) found that interest rates’ response to
anticipated target changes is small, while their response to unanticipated target changes is great. Bernanke and Kuttner (2003) extended this argument to stock prices. They examined the impact of unanticipated changes in federal funds rates target on equity prices and found that an unanticipated 25 basis point cut caused a 1 percent increase in the level of stock prices between 1989-2002. The effects of federal funds rates on stock prices were also examined by Rigobon and Sack (2002) and they reached the conclusion that an increase in short-term interest rates results in a decline in stock prices. Recently Gurkaynak, Sack and Swanson (2005) indicated that instead of the current federal fund rate decision of the FOMC, the statements that it releases had substantial effects on asset prices between 1980 and 2004.
Despite the vast literature of FED policy surprises on US asset prices, the literature falls short of extending these policy surprises to emerging market cases. As financial markets become more and more interconnected, these policy surprises can surely have effects on emerging market economies as well.
This paper attempts to close this gap by analyzing the effect of the change in federal funds rates on 12 emerging market economies between 31.12.1997 through 20.07.2004. This is done by looking at responses of the EMBI spread to changes in both the actual and the surprise component of the federal funds rates. The EMBI has several important features as discussed in Aktas, Kaya and Ozlale (2005). First, it is a primary source in many empirical studies for measuring the risk premium. It is a unit of measure of pure sovereign default risk and assembled as excess promised returns on the United States treasuries. The EMBI spread not only demonstrates domestic fundamentals but also points out external factors and political news.
Finally an event-study methodology is employed to conduct the analysis. Event-study has two advantages. First, it does not require the imposition of a
structural model as illustrated in MacKinlay (1997). This constitutes an advantage for a cross-country study, where each country has different dynamics and macroeconomic structures. Second, there are not enough observations. Very rare policy changes can be observed but there exists a dense date. As discussed in Fatum and Hutchison (1999), time series analysis cannot capture the relationship when the variable of interest (federal funds rates in this case) has changed only a limited number of times.
Finally we perform the rank test of Cragg and Donald (1997) to point out the number of factors that affect the change in the EMBI spread. The countries are divided into two subgroups in order to exhibit the change in the factors that affect the EMBI spread across countries. Using the rank test, we are also able to identify a number of other factors that affect the EMBI spread other than change in the surprise component of federal funds rates.
The outline of this paper as follows: The second section discusses how FED policy changes affect the EMBI spread in emerging markets. The results are presented in section three, while section four concludes the study.
2.2 THE MODEL
There are 12 countries in the sample used for this study: Brazil, Bulgaria, Egypt, Mexico, Nigeria, Panama, Peru, Poland, Russia, South Africa, Turkey and Venezuela. It has been anticipated the change in the EMBI of these 12 countries will depend on both the expected and unexpected (surprise) changes in federals funds rates.
There are 5 broad categories in the event window. If the actual and surprise changes in federal funds rates are positive; that is, if the FED implements a tighter
monetary policy than expected, an increase in the EMBI can be expected. However, if the FED carries out a more expansionary monetary policy than expected, which causes a negative change in the actual and surprise components; a decrease in the EMBI is expected.
When the actual and surprise components of federal funds rates have opposite signs, the effect of the surprise change dominates the effect of the actual change. A decrease in the EMBI is expected at the time the actual change in the federal funds rates is positive and the surprise change in the federal funds rate is negative because FED executes a tight but less tight monetary policy by announcing interest rates lower than expected. Nevertheless, in the case of the actual change is negative and the surprise change is positive, which means imposing an expansionary but less expansionary monetary policy than expected, an increase in the EMBI can be estimated.
Finally if the change in federal funds rates is fully expected (in other words the surprise component is zero) the EMBI increases if the actual change is positive and decreases if the actual change is negative.
Examining the effect of a change in federal funds rates on emerging markets, involves considering not only how the change affects the EMBI but also how the change affects exchange rate parities. An alteration in risk premiums will probably affect the demand on exchange rates by influencing both internal and external market agents.
Considering the exchange rate regimes in emerging markets, countries that impose fixed exchange rate regimes, may change the parity ratios in order to sustain the market balance. It is necessary to determine whether an intervention appears in the exchange rate ratio, before and after the event time when the FED announced a
change in the federal funds rates. However, considering the countries imposing floating exchange rate regimes, we try to analyze whether changes in exchange rate parities are significantly affected or not. A depreciation in the domestic exchange rate is expected for two cases. Firstly, when the change in the actual and surprise components is positive and secondly at the time when the actual change is negative while the surprise change is positive. These two cases are also the cases that anticipate an increase in the EMBI. However, an appreciation in the domestic exchange rate is expected when the change in the actual and surprise components are both negative and when the actual change is positive while the surprise change is negative. While estimating a decrease in the EMBI, at the same time we expect an appreciation in the domestic exchange rate. In the situation where the change in the surprise component is zero, we expect an appreciation in the domestic exchange rate when the actual change is negative and depreciation is expected when the actual change is positive.
We employ an event study analysis in order to specify the effect of a change in federal funds rates on the EMBI and exchange rates. To clarify the effect, we use 5 and 10-day event windows, which help to show whether the intervention made on the event day has a significant effect on the EMBI and exchange rates. We use mean and variance tests to demonstrate whether the intervention has significant and expected effects on the EMBI and exchange rates. A 5-day analysis is used to express the short-term effect of the intervention made by the FED on federal funds rates The purpose of a 10-day analysis is to indicate the long-term effectiveness of the intervention by considering whether the change is significant or expected for the EMBI and for the exchange rate parity.
In order to investigate the effectiveness of the FED announcements on emerging markets, the rank test of Cragg and Donald (1997) is used. A further question that can be asked with the help of the rank test is how many factors determine the change in the EMBI spread in these emerging markets. The X matrix, Txn matrix, whose rows denote the FED intervention dates and columns denote the EMBI spread can be used to clarify this question. Each element in the matrix X represents the 5-day mean change in the EMBI spread before and after the intervention dates. X takes the form of1
X = ҒΛ+ η (1)
Ғ is a Txk matrix, which includes the unobserved factors with (k<n). Λ is a kxn matrix that represents the factor loadings. Finally, η is a Txn matrix, which defines the white noise disturbances. In order to test the effect of FED intervention on the EMBI spread, using the Tx1 vector Ғ and constants λi, i=1,…..,k , we set the
hypothesis whether the vector Ғx [λ1,……, λk] describes the vector X up to white
noise. Using the rank test of Cragg and Donald (1997), measuring the minimum distance between Cov (X) and the covariance matrices of all possible factor models with k0, and limiting χ2 distribution with (n – k0)(n – k0 + 1) / 2-n degrees of freedom,
satisfies us to test X to be described k0 factors against the alternative X is described
by k>k0 factors.
The result of the rank test is reported in Table 1. The emerging markets are divided into 2 subgroups. The first group consists of 7 countries: Venezuela, Mexico, Panama, Poland, Russia, Turkey and South Africa. We strongly reject the hypothesis that change in the EMBI spread is characterized by none or by one factor. The result gives another implication that the change in the EMBI spread is affected not only by
FED intervention. There is another factor that affects the change in the EMBI spread in these emerging market economies. According to our model we assume the second effect in unobserved factors.
The second group of countries consists of Brazil, Bulgaria, Egypt, Nigeria and Peru contrary to the first group, we strongly reject that no common factor that affects the EMBI spread in these emerging market economies. We again also assume that the one common factor is FED intervention. However, it can also be seen in the results section that the relationship between the FED announcements and the change in the EMBI spread of countries in the second group is weak.
2.3 RESULTS
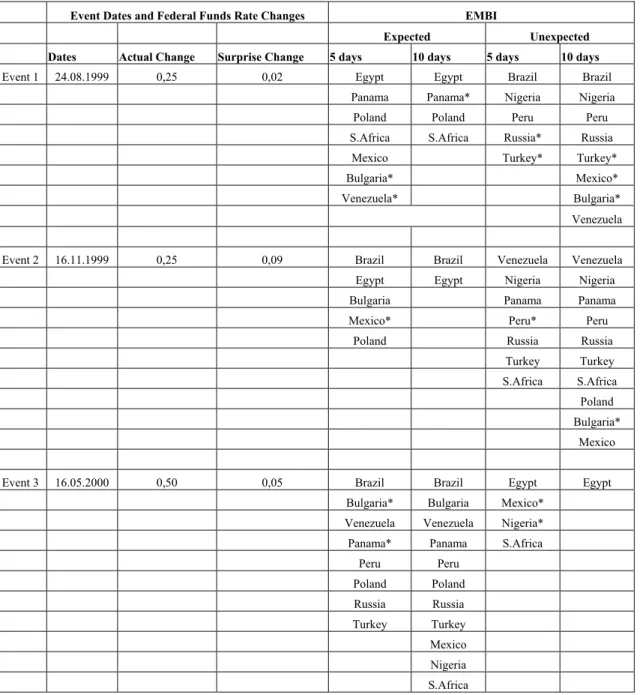
There are 5 categories as discussed above. The results are presented in Tables 2-6. In each table we summarized the number of events that occurred in the sample period for each category. The dates of the interventions and the changes in the actual and surprise components of federal funds rates are also reported. We also submit the number of Federal Open Market Committee (FOMC) meetings on the event days. We separate the results in 2 cases, expected and unexpected; that is, whether the actual change in the EMBI spread is analogous with the theory or not. If the change in EMBI for an emerging country is analogous with the theory, then we assemble the countries under the “Expected” column. If the change in the EMBI spread for an emerging country is contrary to the theory, we accumulate the countries in the ”Unexpected” column. EMBI in the countries can have expected (unexpected) sign in 5-day window and unexpected (expected) sign in 10-day event window. At that time, a country’s being in the “Unexpected” column will demonstrate the ineffectiveness of the intervention for either short-term or long-term or both. If the
name of the country is in the “Unexpected” column for 5-day event window, then the intervention is not successful in the short-run. If the country appears in the “Unexpected” column for 10-day event window and in the “Expected” column for 5-day event window, then the intervention is successful in the short-run but unsuccessful in the long run.
We have 3 events for the first category, where the changes in the actual and surprise components are positive and the FED imposes tighter monetary policy than expected by financial markets. The results are reported in Table 2. For event 1, 24.08.1999, the change in the EMBI of Egypt, Poland and South Africa; for event 2, 16.11.1999, the change in the EMBI of Brazil and Egypt; for event 3, 16.05.2000, the change in the EMBI of Brazil, Venezuela, Peru, Poland, Russia and Turkey are significantly increased both in the 5-day and the 10-day event windows. However in event 3, the changes in the EMBI of all countries except Egypt in 10-day event window, are in the expected direction.
In category 2, where the change in the actual component of federal funds rates is positive but the change in the surprise component is negative, at the time when the FED applies tight but less tight monetary policy than the financial markets expect. There are 4 events to examine. The results are reported in Table 3. Venezuela, Mexico, Poland and Turkey on 30.06.1999 for event 1; Brazil, Nigeria, Peru and Turkey on 02.02.2000 for event 2; Turkey on 21.03.2000 for event 3 and Bulgaria, Venezuela and Nigeria on 30.06.2004 for event 4 have significantly decreasing EMBI for the 5-day and the 10-day event windows.
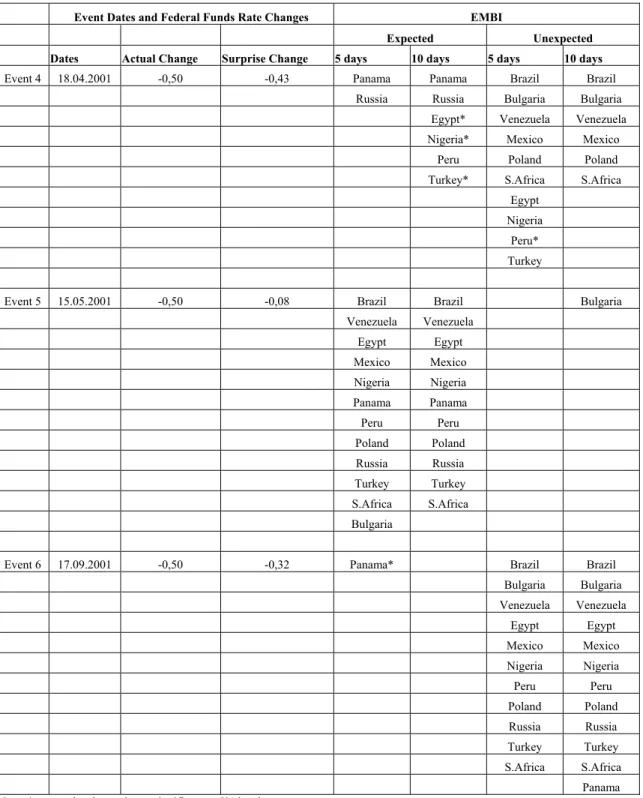
Examining the effects of change in federal funds rates on the emerging markets, in category 3 where both actual and surprise changes in federal funds rates are negative; the FED enforces a more expansionary monetary policy than expected.
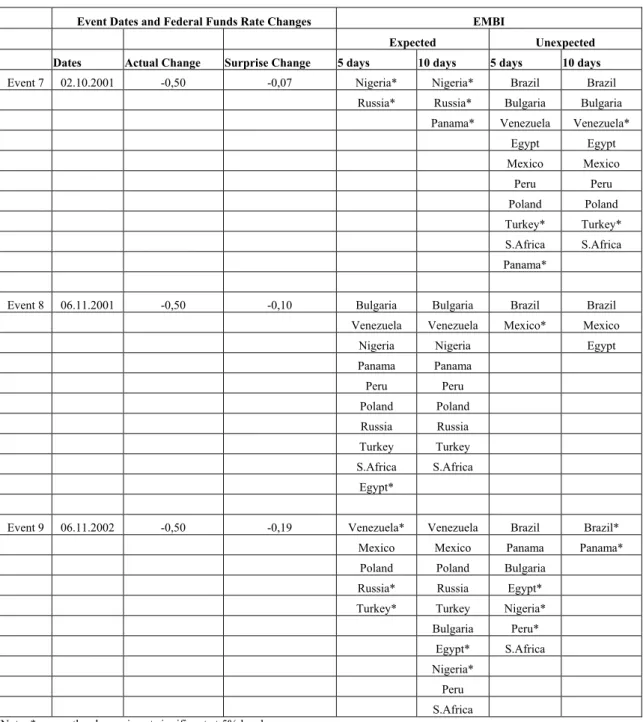
There are 9 events to observe and the interesting results obtained in this case are reported in Table 4. For event 1, on 15.10.1998, the EMBI in all the emerging markets, as expected, decreased significantly in both the 5-day and the 10-day event windows. Eventually, the intervention on 15.10.1998 is successful in both short and long-term. In event 1 on 15.10.1998, financial markets expect a tight monetary policy, since expected change is positive; however, the FED surprisingly imposes an expansionary policy so the change in the surprise component of federal funds rates is very high. Nevertheless, in the second event on 17.11.1998, the EMBI of all the emerging markets are in the expected direction in the 5-day window and the results are all statistically significant. The intervention on 17.11.1998 is successful in the short-term for all the emerging markets in the sample. Eventually the intervention is ineffective in Egypt, which has an increasing EMBI in the 10-day event window. In the third event on 03.01.2001, the EMBI decreased in all of the countries both in the 5- day (except Nigeria) and in the 10-day event window. This EMBI decrease is statistically significant in all the emerging markets for 10-day event window (except for Nigeria). In the fifth event on 15.05.2001, all the countries have decreasing EMBI for the 5-day window and the 10-day window (except for Bulgaria, which had unsuccessful intervention in the long-term), which is statistically significant and expected. In event 6 on 17.09.2001, the EMBI predictably increased in all the countries significantly for the 10-day event window although the FED imposed a very expansionary policy, which was much higher than expected. Since 17.09.2001 was just a few days after the September 11 tragedy, not only the emerging markets but all the markets in the world had an increasing risk premium resulting in a significant EMBI increase in all the markets. Panama and Russia in event 4 on 18.04.2001, all the countries except for Brazil, Mexico and Egypt in event 8 on
06.11.2001, Mexico and Poland in event 9 on 06.11.2002 had significantly decreasing EMBI in both the 5-day and the 10-day event windows.
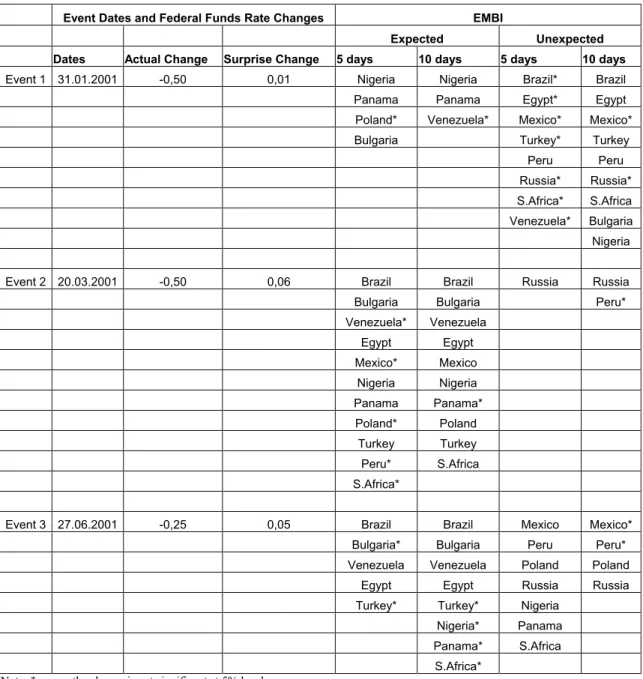
In category 4, while the actual component of federal funds rates decreased, the surprise component increased because the FED applied a less expansionary monetary policy than expected. An increase in EMBI for the countries in the sample was expected. Interpreting the results presented in Table 5, Nigeria and Panama for the intervention on 31.01.2001; Brazil, Bulgaria, Egypt, Nigeria and Turkey for the intervention on 20.03.2001; Brazil, Venezuela and Egypt for the intervention on 27.06.2001; Mexico, Panama and Russia for the intervention on 21.08.2001 and finally Brazil, Bulgaria, Venezuela, Poland and South Africa for the intervention on 25.06.2003 had significantly increasing EMBI for both the 5-day and the 10-day event windows.
Finally in the category 5, the intervention is fully expected, so the change in the surprise component is zero in Table 6. The single event on 11.12.2001, which is the actual decrease in federal funds rates, which is -0.25, all the countries except Peru, Brazil and Egypt, has significantly decreasing EMBI both in the 5-day and the 10-day event windows as expected.
It is also necessary to pay attention to how the FED announcements affect the exchange rate of the countries in the sample. Venezuela has a fixed exchange rate regime for some periods in the time period examined. It is essential to determine whether these countries had changed their fixed exchange rate parities after the announcements or not. However, we are unable to find any change in the parity in these countries. For the countries that have floating exchange regimes, we expect an appreciation in the exchange rate when the actual and surprise components of the federal funds rates are negative, and depreciation when the actual and surprise
components are positive. However, the trend of the exchange rates does not justify the theory so it was not possible to find a significant relationship between the FED announcements and exchange rate trends.
2.4 CONCLUSION
This study analyzes the relationship between the change in the federal funds rates and the EMBI spread in the emerging markets of the sample. The rank test of Cragg and Donald (1997) is employed. The countries are divided into 2 subgroups and we strongly reject that there is no or only one common factor that affects the EMBI spread in the countries in the first group. However, we strongly reject the hypothesis that no common factor affects the EMBI spread in the second group of countries.
There are 5 broad cases, concerning how the changes in the actual and surprise components of federal funds rates affect the EMBI spread of the emerging markets. There are strong results especially in the third category, where both the actual and surprise components are negative. On 15.10.1998, the EMBI in all the countries, as expected, decreased significantly in both the 5 and 10-day event windows. Nonetheless, the EMBI of the countries (excluding Egypt on 17.11.1998 and Bulgaria on 03.01.2001) decreased in all of the countries in both the 5-day and the 10-day event windows. The relationship between the exchange rate of the emerging markets and the change in federal funds rates is also examined. However, a significant correlation between the exchange rate and the federal funds rates was not discovered in the countries that have both the fixed exchange rate regime and floating exchange rate regime.
CHAPTER 3
Effect Of S&P500’S Return On Emerging Markets: Turkish
Experience
3.1 Literature Survey
World economies and financial markets are becoming increasingly interconnected in today’s world. The globalization process helps to speed up this interconnection. Therefore, analysis of this interrelation becomes important for both portfolio managers and academics in the global era. In order to see the importance of interconnection in financial markets, we examined the relationship between the US stock market and the Turkish stock market using daily data for the period from 1987 to 2004. We used the S&P500 index and the ISE100 index for the US and Turkish stock markets, respectively. Our model incorporates the assumption that returns on S&P500 affect the return on ISE100 but not vice versa. In order to incorporate and capture the dynamic relationship among prospective returns, we used a block recursive VAR as in Zha (1999). We found that an innovation in the S&P500 return increases the ISE100 return for up to 4 days in a statistically significant fashion.
Research on the interaction between global stock markets and US stock markets provides various results. Eun and Shim (1989) found that US equity markets affect world markets. They argued that the US is the most dominant market in the world. Tokic (2003) found a long run relationship between the US and five markets; Australia, Japan, Hong Kong, New Zealand and Singapore. According to Cheung and Mak (1992), Liu and Pan (1997), Wu and Su (1998), both US and Japanese stock
markets affect Asian countries. Cha and Oh (2000) reported that Japanese and US markets affect Hong Kong, Korea, Singapore and Taiwan. Gilmore and Mcmannus (2002) found a correlation between the US and three central European markets: the Czech Republic, Hungary and Poland. Kasa (1992) and Arshanapalli and Doukas (1993) found bivariate co-integration of European Markets and the US. Seweel (1996) provided varying degrees of integration between Pacific Rim equity markets and the US. Ghosh (1999) found that the US shares a long run equilibrium relationship with Hong Kong, India, Korea and Malaysia. Some studies also elaborate on the time-varying nature of the US and other stock markets. Eun and Shim (1989) and Arshanapalli and Doukas (1993) reported that US and global financial markets have stronger correlation, especially after the October 1987 collapse in US financial markets. Although relationships between the US and other stock markets were found in the research mentioned above, some studies are opposed to the idea of interaction between stock markets. Ghosh (1999) could not find any effect of the US and Japan on the stock markets of Taiwan and Thailand. Byers and Peel (1993) and Kanas (1998) found no linkage between US and European markets, constituted by both developed and emerging markets. Felix (1998) found no long run co-movement between the US and a number of emerging markets.
The research cited above examines relationships between stock markets, including those of emerging markets, using two alternative approaches: Co-integration tests and Vector Autoregressive (VAR) models. Co-Co-integration tests capture any long run relationships among the stock markets but these tests do not allow for short-term interaction. However, the VAR technique allows dynamic interactions among markets In this paper, we use the VAR model in order to assess short-term correlations and capture dynamic interaction.
While correlation between US stock markets and a number of emerging markets had not been found in many studies, assessing any correlation between US stock markets and stock market of Turkey is a worthwhile exercise. Turkey is distinct from other liberalized emerging markets in important aspects. Turkey has been liberalizing her economy since the early 1980s. Although never experiencing hyperinflation, as some Latin American economies, Turkey has had persistent inflation at considerably high and varying levels for about three decades because of the unstable political and social environment. The importance of the stock market in the overall economic activity grows, as indicated by the rise in stock market capitalization from 12.6 percent of the GDP in 1990 to 34.8 percent in 2000. These features distinguish the Turkish stock market from the emerging markets that constitute the foundation of the research mentioned above.
The outline of this paper is as follows; the second section elaborates on the methodology and provides the empirical evidence. Finally, the paper is concluded in the last section.
3.2 Methodology
A model, similar to the structural vector autoregressive (SVAR) model proposed by Cushman and Zha (1997), is used to examine the effect of a large economy’s stock exchange movement on a small economy’s stock exchange movement. The foreign stock exchange index follows its own dynamics (an AR process is used as a proxy). Turkish stock exchange movements are affected by its own lag and movements of the foreign stock exchange. Therefore, the foreign stock exchange can be thought to have an exogenous affect on the Turkish stock exchange. None of the lag variables of the Turkish stock exchange determine foreign stock
exchange; however, lag values and spot values of the foreign stock exchange affect Turkish stock exchange movement.
The VAR model has some advantages relative to the single equation model since the VAR model allows dynamic interactions among variables and the VAR model has predictive power compared to the single equation model. We also use VAR with block exogeneity since in conventional VAR; stock exchange movements of foreign markets are affected by domestic stock exchanges including lag values. By block exogeneity, we overcome this problem.
The general specification of the identified VAR model of Cushman and Zha (1997) is; ) ( ) ( ) (L y t t A =ε (2) in which, the A(L) is an mxm matrix polynomial in the lag operator L, y(t) is the mx1 observations vector, and ε(t) is the mx1 vector of structural disturbances. Equation 3 shows the specification of the model.
. ) ( ) ( ) ( , ) ( ) ( 0 ) ( ) ( , ) ( ) ( ) ( 2 1 22 21 11 2 1 = = = t t t L A L A L A L A t y t y t y ε ε ε (3)
In Equation 3, we assume thatε(t) is uncorrelated with y(t− for j) j >0 and A(0)
is non-singular. Block exogeneity is represented by in the matrix, which is
zero. This means that y
) (L
12
A
1(t)is exogenous to the second block both simultaneously and also for lagged values. To calculate the standard errors of the impulse response functions, we used the modified error bands of Bernanke, Hall, Leeper, Sims and Zha (1996) for the maximum likelihood estimation (MLE)2
The observation matrices are such that y1= [Foreign Stock Exchange], y2=
[Domestic Stock Exchange] and the lag order of the identified VAR model is 5 as
suggested by Bayesian information criteria. All error bands in this paper were generated with 5000 Monto Carlo draws.
The period, starting from the establishment of the Istanbul Stock Exchange on 23.10.1987 to 08.06.2004, has many interruptions, so various sub periods have been considered for the analysis. The major break periods were the financial crisis in April 1994; the beginning of the disinflation program in December 1999; the financial crises in November 2000 and in February 2001; the September 11 2001 terrorist attack on the twin towers in the US, which also affected the ISE; the memorandum crisis in the Turkish Parliament, when logistic support for the USA in war with Iraq was refused in February 2003.
The corresponding impulse responses are reported in the figures. Figure 2 reports the impulse response functions for 20 days regarding how the ISE100 returns responded to a one-standard deviation shock to S&P500 returns by considering the full sample period. The middle line is for impulse responses and the other two lines are for the confidence bonds at 90% level of confidence bonds. It is important to recognize that a shock to the S&P500 does not affect the ISE100 return contemporaneously. The main reason for this is that when the NYSE closes, it is the beginning of the next day in the ISE (the time difference between Istanbul and New York being 7 hours). However, a positive shock on the S&P500 index causes a change on the ISE100 for 6 days and also causes an increase in the ISE100 index for 2.5 days in a statistically significant manner.
Figures 3 to 8 report the impulse responses for different sub samples. Except for the period between 01.01.2002 to 28.02.2003, a statistically significant effect of
the S&P500 returns on the ISE100 returns is observed. It is not surprising that the adaptation of the new government and their struggle with the memorandum to give logistic support to the USA for the war in Iraq caused uncertainty in the Turkish market, so the effect of the S&P500 on the ISE100 was not observed in that period. In general, for all sub-samples, except for Figure 7, a one standard deviation shock to the S&P500 caused an increase in the ISE100 returns in a significant manner. However, the effect of the shock continued for 16 days at most as shown in Figure 6.
3.3 Conclusion
Interactions among stock markets, increasing with globalization process, encourage economists to assess whether any relationships exist. In this paper, we examine the effect of US stock exchange performance on the Turkish stock exchange. We use the S&P500 index for the US stock exchange and the ISE100 index for the Turkish stock exchange. We assume that US stock exchange performance is not affected by Turkish stock market; however, the Turkish stock exchange is affected by both its own dynamics and the US stock exchange. We reflect this assumption in our specification by using the Block recursive VAR model.
Our sample includes the daily observations from 23.10.1987 to 08.06.2004 and we found that a positive shock to the US stock exchange increases the Turkish stock exchange in a statistically significant manner. The sample period is a long period for both US and Turkish markets, so we divided the period into 6 sub-samples. We again found a statistically significant relationship between US and Turkish stock exchanges in our sub- samples except for the period 01.01.2002 to 28.02.2003, which corresponds to the process of adaptation of new Turkish government and memorandum proposal, which ended in the refusal of logistic support to United States in the war with Iraq.
CHAPTER 4
Success In Soccer And Economic Performance: Evidence From
Beşiktaş-Turkey
4.1 Literature Survey
There has been considerable discussion in the literature about the connection between sports activities and economic performance. Even casual observations may reveal the fact that a considerable volume of economic activity is attached to professional sports. In almost every country, there are national leagues of several branches of professional games, which induce the movement of massive amounts of financial assets, possessed by either the private or the public sector. Furthermore, international contests, cups, and Olympic games help to extend these movements beyond national borders. Therefore, one is always curious about the possible effects of professional sports on the economy. Another important aspect of professional sports is probably their potential sociological and psychological effect on people. For instance, every professional team has a large number of faithful supporters
Hence, professional sports performance might have some effect on people’s morale. Owing to these observations, the relationship between economic performance and professional sports performance is worth investigating.
The connection mentioned above was investigated in the literature with different points of view. Coates and Humphreys (1999), within an economic impact analysis framework, reject a positive correlation between the construction of sports facilities and economic development. Siegfried and Zimbalist (2000) also analyze the
relationship between economic development and professional sports and cannot find the relationship between professional sports and economic development.
Another interesting study that deals with sports economics from the side of public budget, Coates and Humphreys (2002), reveals that public expenditures to finance professional sports cannot be justified after investigating the determinants of real income in cities with professional sports teams. However, Coates and Humphreys (2002) present statistical evidence that the home city of the winning team in the Super Bowl has higher real per capita income, probably pointing to increased productivity of workers in that city. Similarly, a positive relationship between growth performance and the World Cup success of selected countries is reported in the Federal Reserve Bank of St. Louis (2002) such that countries which are successful in the World Cup have higher growth performance relative to prior periods.
This paper investigates the effect of soccer success on economic performance from a different angle – happiness. Every soccer team has a huge number of supporters. If these supporters are affected by the success of their team, then their well being will be affected. If this is the case, first their behavior then the economic outcomes will be affected (see Isen, 2000; and Frey and Stutzer, 2002, for a review of the literature). For example, Spector (1997) and Warr (1999) argue that employees who are satisfied with their lives are more cooperative and helpful to their colleagues, tend to be more punctual, report fewer sick days, and remain employed for longer periods than dissatisfied employees. All these are factors that increase the productivity of workers. If this is realized for a large number of people, then it is likely to affect total productivity. By considering a sample of OECD countries, Kenny (1999) provides some empirical evidence that happiness increases income.
We investigate the relationship between Turkish industrial production performance and success of a popular Turkish soccer team, namely Beşiktaş. At first sight, our focus on the success of a popular soccer team (instead of any other explanatory variable) and on overall industrial performance (instead of the economic welfare of a specific region of the country) may not seem sophisticated enough. However, once we present our key observations about the soccer industry in Turkey as well as about Turkey’s socio-economic structure, our empirical setup proves to be adequately formed.3
The first set of our observations covers the structure of the Turkish soccer industry, which differs from its North American counterpart. First, there is an almost settled structure in Turkish soccer industry, i.e. almost every city has at least one associated team that does not change its location over time. In that respect, Turkish society is not familiar with the practice of a North American local administration to franchise a sports team. In Turkey, all sports teams are subsidized from the budget of the Ministry of Youth and Sports, yet the amounts of subsidy are pathetically symbolic. Second, new stadiums and other related facilities are rarely built. Based on these two major points, it seems more meaningful to analyze the impact of professional sports on the overall economic performance instead of focusing on local economies.
Our focus on soccer is due to a second set of observations regarding the meaning of soccer to Turkish society. First and probably the most important, the term
sports possessed a narrower meaning in Turkey as far as the average perception of
the society is considered. Sert (2000) argues that soccer has an almost perfect association with the more general term sports in Turkey. Second, sports news on TV
3 Economists might think that incorporating the psychological behaviour into decision-making brings
non-rationality into economic modeling. However, economists start to defend this kind of behaviour within a rational setting (see, for example, Hermalin and Isen, 2000).
broadcasts is almost totally related to soccer. Especially on weekends, soccer programs dominate nearly all TV channels and these programs have high audience ratings. In Turkey soccer turns out to be the topic that receives the interest of the majority of people.4 The generally unstable economic performance and unstable political dynamics leave the morale of Turkish people to be basically directed by the success of the soccer team that they support. Third, in the eyes of the Turkish people, the term soccer has a strong connotation with the three biggest teams of the country, namely Beşiktaş, Fenerbahçe, and Galatasaray. Based on these observations, our focus on soccer instead of any other branch of sports can be justified.
On the basis of the two sets of observations which are briefly presented above, we are left with a setup in which we investigate the impact of Beşiktaş’ success on Turkish industrial performance. Once we have set the importance of soccer in determining Turkish people’s psychological well-being, we hypothesize that success in soccer affects the economic performance positively. Actually, psychologists argue the existence of similar relationships. The happy-worker
hypothesis possesses key importance in the literature of industrial psychology.5,6 The well-being and performance of the workers constitute the subject of the hypothesis, such that an increasing level of happiness7, or job satisfaction, of workers is expected to increase their job performance. The level of job satisfaction is determined by the conditions of the external environment and the work environment. Here we follow a route that is different from that of the industrial psychology scholars in that we use the success of Beşiktaş as the sole determinant of workers’ happiness since it is one
4 Miller (1999) can be visited for the “televisualization of sports”, i.e. the process by which sports
teams become media entities.
5 See for example Wright et al. (2002).
6 One may also look at Berument and Yucel (2005) for a social psychology approach to productivity
increases.
of the top ranked soccer teams in Turkey, and has fanatical supporters with strong
team love.
Using transfer function analysis, we demonstrate that the success of Beşiktaş in games played in European cups and tournaments affects the industrial performance positively, but not in domestic games. The increase in industrial production is higher if the success is observed in displacement. Section 2 describes the Turkish soccer game structure. In Section 3 − empirical analysis − we present our data, methodological framework and basic findings. Finally, we conclude the article in Section 4.
4.2 Turkish Soccer Game Structure
Turkish soccer teams play matches either among themselves in Turkish
National League and Turkish Cup or with European teams in Champions League, UEFA Cup and Cup Winners Cup. In the past, unlike some European teams, Turkish
teams did not play against another Turkish team in any of the European Cups. The
Turkish National League started in 1959. At first, 16 teams were involved in a
season; however, this number varied between 12 and 20 as time passed. For the sample that we consider, 16 teams played in the Turkish National League during the 1992-93 and 1993-94 seasons. After the 1994-95 season, this number was fixed at 18. The Turkish National League uses league status to determine the winner. All the teams play with each other and the winning team receives 3 points (it was 2 points before, but the rule was changed starting in the 1987-88 season), ties get 1 point and loser teams do not get any points. At the end of the season, the team that scores the highest wins the championship.
The teams playing in the Turkish Cup are determined by the Turkish Soccer Federation by considering the success of the team in the Turkish Cup in the previous season, and the success of the teams in the Turkish National League in the previous season. The number of the teams that play in the Turkish Cup changes every year. Unlike the Turkish National League, the Turkish Cup uses an elimination procedure.
Teams that represent Turkey in European tournaments are determined by games played among themselves. The first two teams in the Turkish National League participate in the Champions League. The winner of the Turkish Cup and the third, fourth and fifth teams participate in the UEFA Cup. Participants of the Cup Winners
Cup are determined by the winners of each nation’s Cups.8 For the 1992-2002
period, the number of teams participating in the Champions Cup in Europe was determined with a three-step procedure. The country points9 determine the number of teams that represent each country in the Champions Cup. Teams from the countries that have low points play in elimination games in order to enter the Champions League. There are 32 teams in the league and 8 groups. Each group has 4 teams. After the matches played with each other, the first and the second teams in each group qualify for the second tour. There are 16 teams in the second tour. These teams are divided into 4 groups and 4 teams exist in each group. After the matches played within the groups, the first and the second teams qualify for the quarter finals. The league status disappears with the starting of the quarterfinals and the elimination procedure is used. After two-match eliminations in quarter and semi final matches, the final will be played in a single match and the winner will be determined.
The status of the UEFA Cup is based on an elimination process. Country point status is also important in the UEFA Cup for determining the number of
8 After the 1998-99 season the Cup Winners Cup and the UEFA Cup were merged.
participants with respect to the countries. Every round has a two-match elimination procedure. After the quarter and semifinals, the final is played in a single game in a country determined by the UEFA before the beginning of the cup. Before the merging of the UEFA Cup and the Cup Winners Cup, the teams playing in the Cup
Winners Cup were determined by the winners of each nation’s Cups. The Cup Winners Cup, like the UEFA Cup, is based on an elimination process and after the
quarter and semi finals, the final is played in a single game within a country determined by the UEFA before the cup.
4.3. EMPRICAL ANALYSIS
4.3.1 Modeling Approach and Variable Definitions
We measure the industrial performance by gy, which is the logarithmic first difference of the seasonally adjusted industrial production index. Following Ergun (2000), we assume that it follows an autoregressive process. Later, it is regressed against its lags10 up to the fifth order and variables that measure the success of Beşiktaş. The inclusion of lags of the monthly rate of change of industrial production allows us to handle the trend behavior of the original industrial production series. The part of variation not explained by the autoregressive model for gy is attributed to Beşiktaş by using the variables Zjt as shown in Equation 4:
g =α +
∑
J t (4) j jt j i Y i t i Y t α g +∑
γ Z +ε = = − 1 5 1 0In terms of Equation 4, the values of αk, k = 0, .., 5, and γj are the parameters
to be estimated. Zjt denotes the jth measure for the success of Beşiktaş at time t. The εt is the i.i.d. error term. In order to obtain a meaningful time-series for the Zjt, we first classify the games played in each month on the basis of the host team’s field. If the game is played at Beşiktaş’ home field, then it is put in the category of home and when it is played at the rival’s field it is classified as displacement. Second, the score of each game is translated into a win, tie, or loss from the Beşiktaş’ point of view. We define our temporal rule as recording a game that is actually played in month t for month t + 1 if the first consequent workday belongs to month t + 1. We denote the number of games won, tied and lost with W, T, and L respectively. Subscript h refers to games played at Beşiktaş home and d stands for the games played in
displacement. The absence of a subscript indicates that we consolidate the data
regardless of the field information. Superscript All indicates all the games, Turkey is used for the games played in the domestic tournaments, Europe is for the games played in European tournaments, and Season is for the games played in the national-season.
The coefficients γj are of interest in Equation 411. The variable is assumed to follow an autoregressive process that is interrupted by Z
y t
g
jt in each period. The coefficient γj of the variable Zjt is tested under the null hypothesis (H0 : γj = 0). This type of specification is often used in the literature12. (One may look at Enders, 1995, for the transfer function analysis). In the recent literature, Ergun (2000) also used the transfer function analysis to investigate various Turkish macroeconomic variable aggregates. In our case, we study the effects of Beşiktaş’ success on Turkish
11 Using mathematical terminology, these coefficients correspond to the transfer function that we
estimate. The “transfer function” is the statistically estimated relationship that explains how an exogenous movement is transferred to an autoregressive endogenous variable.
12 For instance, McCallum (1978), Alesina and Sachs (1988), Ito and Park (1988), and Heckelman and
industrial performance. Since we do not expect a feedback from industrial performance to performance of Beşiktaş as also supported by our preliminary analysis, the problem of endogeneity is not relevant.
The possible sensitivity of our results to our choice of including only Beşiktaş may be an important point. For instance, the success of Beşiktaş in the national soccer season, reminiscent of a zero-sum game, means the failure of another team in a given week of the national season fixture. Thus, one may expect that the productivity augmenting effects of different soccer teams offset each other. This is especially apparent when we consider the competition among the top-ranked teams for the championship. Even if these top-ranked teams do not play against each other in every given week, the success of one indicates increasing difficulty in the competition for the other ones.13 On the other hand, the success of Beşiktaş in games played abroad may induce higher productivity for the corresponding month; since Turkish people have a tendency to entangle foreign games with national pride and identification.
Lastly, the financial crisis occurring in 1994 affected the Turkish economy adversely. Thus, it is necessary to include the 1994 crisis in empirical studies. Consecutively, the 3rd, 4th, 5th and 6th months of 1994 are controlled by using a dummy variable for each: D94-3, D94-4, D94-5, and D94-6 respectively. Similarly, for the
financial crises of 2000 and 2001, we define the dummy variables for November 2000 and February 2001, namely D00-11 and D01-02.
13 In a given week, each team plays with its rival according to the season fixture. If it wins, it gets 3
points, ties are assigned 1 point and losses receive no points at all. At the end, the champion is the team with the highest cumulative points.
4.3.2. Data
Data on industrial production, which is the proxy of income in our study, is obtained from the data delivery system of the Central Bank of Turkey.14 Historical game records of Beşiktaş are compiled from Tanrikulu (2002) and from the official website of the UEFA15. The study period is from 1992:08 to 2002:10. Recalling the definition of economic performance, individual income could be proxied in a more direct fashion using consumption data. However, neither a measure of this variable nor a proxy of it is available for Turkey at monthly frequencies. Hence, we cannot work on it.
Beginning in 1992, Turkish soccer teams began to improve their success rate in Europe. Galatasaray’s achievements in the UEFA Champions League, which is a tournament where all the champions of the countries of Europe are gathered, positively motivated other Turkish soccer teams in European tournaments. Thus, we take that year as the beginning of our sample.
4.3.3. Model estimates
We present our model estimates in two different samples. In the first series of regressions, we want to see the relationship between industrial production (growth)
14 Electronic Data Delivery System of the Central Bank of the Republic of Turkey is an appropriate
medium for extracting economic data related to Turkey which is released by official data providers. The delivery system can be reached at http://tcmbf40.tcmb.gov.tr/cbt.html. The primary source of industrial production is The State Institute of Statistics.
and the success of Beşiktaş for the period of 1992:08-2002:10. The second one uses the data between the two financial crises that Turkey experienced: 1995:01-2000:10.16 We present our estimates in the first series of regressions in Table 7 and Table 8. The specifications of Table 7 hide the home/displacement field information but classify the games as win, lose or tie. In the specifications presented in Table 8, we distinguish between the home/displacement field of the games so as to find out whether the home-field is an important factor in translating the success of the team into workers’ morale. Crisis dummies to control the months of Turkey’s financial crises and the lags of gy are common to both tables, as well as the sum of squared residuals, and . A quick glance at the tables shows the negative impact of the April 1994 financial crisis. In all six specifications, the effect of the dummy variables is significantly negative17. Increased liquidity on November 2000, which is represented by, D00-11 is positive in all six specifications. The February 2001 crisis
has the same impact as the April 1994 crisis as suggested by Table 7 and Table 8, since all the coefficients associated with D01-02 are negative.
2
R R2
Specification 1.1 in Table 7 is the summary of all games played by Beşiktaş. Winnings seem to increase industrial production but the coefficients are not statistically significant. The statistical evidence suggests that ties and losses do not affect industrial production. Specification 1.2 contains the games played in Turkey and winnings increase industrial production growth. However, the evidence is not statistically significant. Ties and losses seem to have a negative impact on industrial production, but the relationship between industrial production and ties and losses in Turkey is not statistically significant.
Specification 1.3 is highly remarkable. The winnings of Beşiktaş in Europe
16 Berument and Kilinc (2003) argue that the dynamics of the industrial production between the
financial crises is different from the full sample.
increase industrial production by nearly 0.15%, and the estimated coefficient is a statistically significant finding. Ties have a negative impact on industrial production but this evidence is not statistically significant. The relationship between industrial production and losses in Europe is not statistically significant either.
In the specifications presented in Table 8, we distinguish between games played at home and in displacement. In Specification 2.1, we do not have statistically significant evidence that either winnings, ties or losses at home or in displacement have an explanatory power for the industrial growth.
Specification 2.2 decomposes the games into opposing teams: if the opponent is another Turkish team, there is no statistically significant evidence that the score and the location of the game have an explanatory power for industrial production. On the other hand, the estimates of Specification 2.3 suggest a statistically significant relationship between industrial production and the games Beşiktaş played in Europe. Regardless of the home-field of the game, the winnings of Beşiktaş are associated with the increased industrial production growth rate. This increase is slightly higher if the game is played in displacement, where both of the estimates are statistically significant. The increase in the monthly growth rate of industrial production due to the winnings of Beşiktaş at home is around 0.14%, and in displacement is around 0.39%. This higher effect further suggests that winning in displacement increases industrial production more than winning at home. Beşiktaş ties, whether at home or in displacement decrease industrial production, but this evidence is not statistically significant. Neither losses at home nor losses in displacement change the industrial production in a statistically significant manner.
It is worth mentioning that this time span includes the most devastating financial crises of Turkish economy, namely the ones of 1994 and 2001. Thus, one
can always question the reliability of our empirical findings. In order to handle such criticisms, e.g. checking for the robustness of our estimates in the first series of regressions, we run a second series of regressions in which we trim our data for the 1994 and 2001 crises. Table 9 and Table 10 report the estimates for the sample between January 1995 and October 2000. In Table 9, again we do not have any statistically significant correlations between the dependent variable and independent variables in Specifications 3.1 and 3.2. In Specification 3.3, winnings in Europe increase industrial production by 0.15%, which is also statistically significant. Ties and losses in Europe do not affect the industrial production index significantly.
In Table 10 we cannot find any statistically significant relationships between dependent and independent variables in Specification 4.1 and 4.2. Nevertheless, there are some important results in Specification 4.3, which involves the games played in Europe. Winnings at home increase industrial production index by 0.13%, which is a statistically significant finding. Winnings in displacement in Europe slightly increase the production by 0.52% in a statistically significant manner. Winnings in displacement increase the industrial production more than winnings at home. Neither ties nor losses affect production in a statistically significant manner.
4.4 Conclusion
In this study, we try to assess any relationship between economic performance and the success of a popular Turkish team: Beşiktaş. The success of a soccer team may motivate workers to be more productive and this may boost the economic performance. Thus, we study how workers’ happiness affects industrial
performance and present statistically significant evidence that there is a positive feedback from workers’ happiness to industrial performance using a transfer function analysis. The magnitude of this positive feedback is an increase in the monthly rate of industrial growth for the games won by Beşiktaş in European cups. Moreover, this increase is higher if these wins occur in displacement (the home of the rival team).
However, we are not able to find this positive feedback in Turkish National League games in a statistically significant manner. There is a canceling effect for the supporters of rival clubs of Beşiktaş, which may offset the positive effects of Beşiktaş in the national season.
The increase in labor productivity due to the effect of a popular Turkish team such as Beşiktaş, by supporting the happy worker hypothesis, makes us agree with Coates and Humphreys (2002).
There is room for further research using consumption data or some other determinants of industrial production. Finally, the investigation on the net macroeconomic effect due to Beşiktaş within a different economic framework is left for a future study.
SELECTED BIBLIOGRAPHY
Aktas Z., Kaya N. and Ozlale U. 2005.“ The Prize Puzzle In Emerging Markets: Evidence From The Turkish Economy Using Model Based Risk Premium Derived From Domestic Fundamentals.” TCMB Working Paper, No:05/02 Alesina A. and Sachs J. 1988.” Political Parties and the Business Cycle in the United
States, 1948-1984.” Journal of Money Credit and Banking, 20(1), pp. 63-82 Arshanapalli B. and J. Doukas. 1993. “International Stock Market Linkages:
Evidence from the Pre- and Post-October 1987 period.” Journal of Banking
&Finance, 17, 193-208.
Bernanke B. and Kuttner K. Forthcoming. “What Explains the Stock Market’s Reaction to Federal Reserve Policy?” Journal of Finance.
Berument H. and Heckelman J.C. 1998.“ Political Business Cycles and Endogenous Elections”, Southern Economic Journal, 64(4), pp. 987-1000.
Berument H. and Kilinc Z. 2003. “Business Cycles in Turkey and European Union Countries”, Bilkent University, manuscript
Berument H. and Yucel E.M., Forthcoming. “Long Live Fenerbahce: Production Boosting Effects of Football in Turkey”, Journal of Economic Psychology Byers M.D. and D.A. Peel. 1993. “Some Evidence on the Interdependence of
National Stock Markets and the Gains from International Portfolio Diversification.” Applied Financial Economics, 3, 239-242.
Campbell J.Y. and Y. Hamao. 1992. “Predictable Stock Returns in the United States and Japan: a Study of Long-term Capital Markets Integration.” Journal of
Finance, 47, 43-70.
Cha B. and S. Oh. 2000. “The Relationship Between Developed Equity Markets and the Pacific Basin’s Emerging Equity Markets.” International Review of
Economics and Finance, 9, 299-322.
Cheung Y.L. and S.C. Mak. 1992. “The International Transmission of Stock Market Fluctuation Between the Developed Markets and the Asian-Pacific Markets.”