COMPARING VARIOUS MACHINE LEARNING METHODS FOR PREDICTION OF PATIENT REVISIT INTENTION: A CASE STUDY
1Osman DEMİRDÖĞEN, 2Hamit ERDAL, 3Ahmet İlker AKBABA
1Department of Business Administration, Faculty of Economics and Administrative Sciences, Ataturk University,
Erzurum, Turkey.
2Institude of Social Sciences, Ataturk University, Erzurum, Turkey.
3Department of Business Administration, Faculty of Economics and Administrative Sciences, Erzurum Technical
University, Erzurum, Turkey.
1[email protected], 2[email protected], 3[email protected]
(Geliş/Received: 20.12.2016; Kabul/Accepted in Revised Form: 19.04.2017)
ABSTRACT: Numerous methods have been suggested for analysis of costumer intention, from surveys to statistical models. The most recent couple of years, various machine learning methods have effectively been utilized to costumer-centric decision-making problems. The trend of patient revisit intention analysis has an improved reliance on computerized decision making models. Computerized decision-making may never take the place of the hospital managers, but it can provide decision support via a simple questionnaire. In this paper, it is carried on a comparative evaluation of the performance of ten widely used machine learning methods, (i.e., logistic regression, multilayer perceptron, support vector machines, IBk, KStar, locally weighted learning, decisionstump, C4.5., randomtree and reduced error pruning tree) for the aim of suggesting appropriate machine learning techniques in the context of patient revisit intention prediction problem. Experimental results reveal that the C4.5 tree demonstrates to be the most suitable predictive model since it has the highest overall average accuracy (95.24%) and a very low percentage error on both Type I (3.40%) and Type II (23.53%) errors, closely followed by the locally weighted learning (94.44%, 3.43%, 31.58%) and decisionstump (94.05%, 3,85%, 30.00%), whereas the logistic regression and the IBk algorithms appear to be the worst in terms of average accuracy (87.30% and 88.49%, respectively) and Type II error (70.37% and 68.18%, respectively). Besides the randomtree (6.36%) and the IBk (6.09%) algorithms appear to be the worst in terms of type I error. As a result, this study has demonstrated the promising attempt of incorporating sentiment classification into patient revisit intention.
Key Words: Revisit intention, hospital management, machine learning, prediction, logistic regression, multilayer
perceptron, support vector machines, IBk, KStar, locally weighted learning, decisionstump, C4.5., randomtree, reduced error pruning tree.
Yeniden Hastane Tercih Etme Davranışının Tahmini İçin Çeşitli Makine Öğrenmesi Yöntemlerinin Karşılaştırılması: Bir Uygulama
ÖZ: Müşteri davranışının analizi amacıyla anketlerden, istatistiksel modellere kadar pek çok yöntem önerilmiştir. Son birkaç yılda çeşitli makine öğrenmesi yöntemleri, müşteriye odaklı karar verme problemlerine etkili bir biçimde uygulanmıştır. Yeniden hastane tercih etme davranışının analizi, bilgisayar destekli karar verme modellerine daha fazla bağımlılık gösterme eğilimi içerisindedir. Bilgisayar destekli karar verme, hiçbir zaman hastane yöneticilerinin yerini alamaz ancak basit bir anket yoluyla karar desteği sağlayabilir. Bu çalışmada, yeniden hastane tercih etme davranışının tahmini problemi için uygun makine öğrenmesi yöntemlerinin belirlenmesi amacıyla yaygın olarak kullanılan on
adet makine öğrenmesi yönteminin (lojistik regresyon, yapay sinir ağları, destek vektör makineleri, IBk algoritması, KStar algoritması, lokal ağırlıklandırılmış öğrenme algoritması, decisionstump karar ağacı, C4.5. karar ağacı, rastgele ağaç algoritması ve indirgenmiş hata budama karar ağacı) performansları karşılaştırmalı olarak incelenmiştir. Deney sonuçlarına göre C4.5. karar ağacı, en yüksek ortalama doğruluk oranı (95.24%) ile çok düşük Tip-I ve Tip-II hata oranları elde edilmesi nedeniyle en uygun tahminleme modeli olarak belirlenmiştir. C4.5. karar ağacının hemen ardından, sırasıyla, lokal ağırlıklandırılmış öğrenme algoritması (94.44%, 3.43%, 31.58%) ve decisionstump karar ağacı (94.05%, 3,85%, 30.00%) en uygun tahminleme modelleri olarak belirlenirken, lojistik regresyon ve IBk algoritması hem ortalama doğruluk oranına (sırasıyla, 87.30% ve 88.49%) göre, hemde Tip-II hata oranına (sırasıyla, 70.37% ve 68.18%) göre en kötü tahminleme modelleri olarak belirlenmiştir. Bunun yanında rastgele ağaç ve IBk algoritmaları Tip-I hata oranına göre (sırasıyla, 6.36% ve 6.09%) en kötü tahminleme modelleri olarak belirlenmiştir. Sonuç olarak, bu çalışmada yeniden hastane tercih etme davranışının sınıflandırması için umut vadeden sonuçlar ortaya koyulmuştur.
Anaktar Kelimeler: Yeniden tercih etme davranışı, hastane yönetimi, makine öğrenmesi, tahminleme, lojistik
regresyon, yapay sinir ağları, destek vektör makineleri, IBk algoritması, KStar algoritması, lokal ağırlıklandırılmış öğrenme algoritması, decisionstump karar ağacı, C4.5. karar ağacı, rastgele ağaç algoritması ve indirgenmiş hata budama karar ağacı.
INTRODUCTION
Data mining (DM) is vital for customer relationship management (CRM) to analyse huge data streams and gain insight into customer intentions, needs and preferences. Also these knowledge assists the design of customer-centric service processes alongside personalized marketing and service activities. Thus, succesively, help to acquire new customers, keep the current customer in hand, and to have loyalty of them in today's competitive globalized markets.
Costumer repurchase (revisit) intention is inevitable for healthcare constitutions. Hospital management is responsible for the services offered to patients is determining the patient's preferences to the hospital again about the services provided to the satisfaction or not (Güzel, 2014). In this regard, the hospital management plays a vital role in customer service is visiting again.
DM may make possible healthcare constitutions to forecast tendencies in the patient conditions and their intentions, which is achieved by data analysis and identifying interconnection from apparently unassociated info. Unprocessed data from healthcare constitutions are huge. These data provides countless possibilities for hidden pattern investigation for healthcare organizations (Milovic and Milovic, 2012). These patterns and data mining algorithms may provide support for forecastings, diagnoses and treatment planning. Mentioned algorithms also can being integrated into information systems of healthcare constitutions as a decision support tool, avoiding human errors (Bushinak et al., 2011).
By help of DM methods, it is practicable to forecast tendencies and customer intentions and, in this way, maintain the constitution's business success. (Milovic and Milovic, 2012).
Healthcare constitution are capable to utilize DM tools different ways such as managers and doctors who utilize models for measuring clinical/quality/economic indicators, efficiency of the staff to optimize use of resources, customer satisfaction/loyalty, etc (Stühlinger et al., 2000).
Machine learning (ML) methods have been applied in many research areas in healthcare sector and medical science including, predicting mortality (Cooper et al., 1997; Verplancke et al., 2008), medical diagnosis (Kononenko, 2001; Li et al., 2015), cancer prediction and prognosis (Jerez et al., 2010), applications in the intensive care units (Hanson III and Marshall, 2001), heart disease prediction (Parthiban and Subramanian, 2007; Anbarasi et al., 2010; Soni et al., 2011), drug design (Duch et al., 2007), diabetic nephropathy prediction (Cho et al., 2008), molecular classification of multiple tumor types (Yeang et al., 2001), liver disease diagnosis (Lin, 2009), disease risks prediction (Khalilia et al.,
2011), DNA classification (Fiannaca et al., 2015), automatic evidence quality prediction (Sarker et al., 2015), detection of healthcare-associated infections (De Bruin et al.,2016), medication adherence prediction (Kalantarian et al., 2016).
In literature, to the best our knowledge, there are limited descriptive and statistical studies within patients revisit intentions (i.e., Boshoff and Gray, 2004; Al-Refaie, 2011; Sarvari, 2012; Kang et al., 2013; Aliman and Mohamad, 2013; Park and Seo, 2014), but none of them applications of ML prediction methods. Besides, none of the studies being utilized ML methods applications to a hospital managerial problem.
In this study, 15 variables was executed to determine revisit intention, using a binary classification and five-point likert scale, in a hospital in the province of central Erzurum.
Binary classification may be seen as a universal approach to support decision making in customer-centric applications. That is, revisit intentions can be categorized that the patients those who will revisit and those who will not.
It is vital to understand patient motivation and satisfaction after taking service. We test this with a questionnaire and ML-based empirical study.
In this paper, it is carried on a comparative evaluation of the performance of ten widely used ML algorithms (logistic regression, multilayer perceptron, support vector machines, IBk, KStar, locally weighted learning, decisionstump, C4.5., randomtree and reduced error pruning tree) on patient revisit intention prediction problem. This study has demonstrated the promising attempt of incorporating sentiment classification into patient revisit intentions.
The rest of the paper is organized as follows. In Section 2, ML methods, used in study, are introduced. In Section 3, data set is given and experimental desing is illustrated. In section 4 prediction models are compared and results are evaluated. Finally, Section 5 presents the main conclusion and future directions of the study.
MACHINE LEARNING METHODS
Conventional prediction models, such as logistic regression and discriminant analysis have been used to predict consumer repurchase intention. However, there has been a great potential in applying more efficient ML techniques to analyse consumer behaviour and repurchase intention. (ML) algorithms predict an unknown dependency between the inputs and output from a dataset (Tüfekci, 2014).
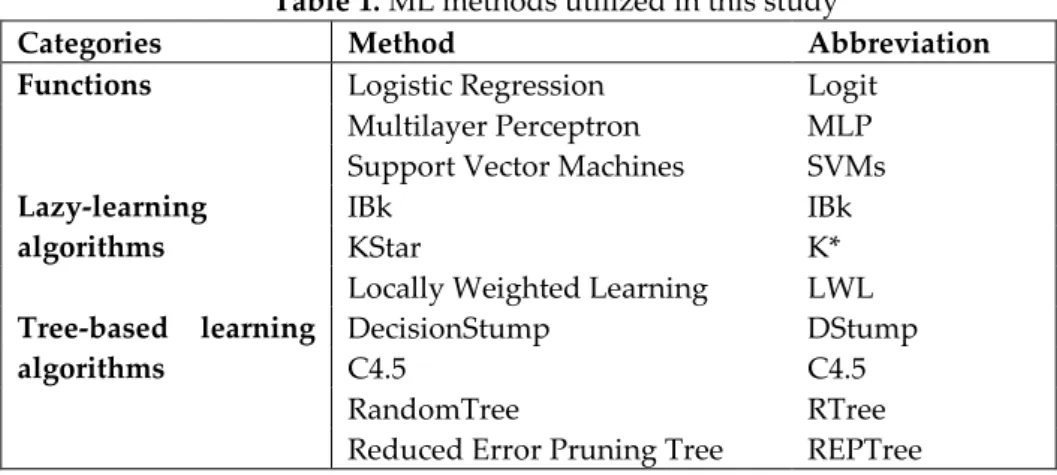
Table 1 demonstrates the ML techniques utilized in this study. We handled these techniques in three categories; Functions, Lazy-learning Algorithms, and Tree-based Learning Algorithms, stated by The Waikato Environment for Knowledge Analysis (WEKA) platform.
Table 1. ML methods utilized in this study
Categories Method Abbreviation
Functions Logistic Regression Logit
Multilayer Perceptron MLP
Support Vector Machines SVMs
Lazy-learning algorithms
IBk IBk
KStar K*
Locally Weighted Learning LWL
Tree-based learning algorithms
DecisionStump DStump
C4.5 C4.5
RandomTree RTree
Logistic Regression (Logit)
Logit is a regression model for binomially distributed dependent variables. It is practical for modeling the probability of an event occurring as a function of other factors. As its link function, logistic regression is a generalized linear model which uses the logit. In literature other wide used names for logistic regression for various other application areas are logistic model, logit model, and maximum-entropy classifier (Hosmer and Stanley, 2000).
Binary logit is a type of regression, which is used when the dependent variable has a dichotomy and the independent variables are of any form. Multinomial logistic regression is useful to cope with the case of dependent variable with more classes than two. When multiple classes of the dependent variable might be ranked, then ordinal logistic regression is preferred to multinomial logit. Only the exact variables (not continuous) can be used as dependent variables in logit. Logit applies maximum likelihood prediction after transforming the dependent into a logit variable. Therefore, logit predicts the probability of occurrence of a certain event (Chandra et al., 2009).
Multilayer Perceptron (MLP)
Multilayer perceptrons, one of the neural network approaches, have superiors generalisation potential to seize complex interrelation between inputs and outputs. MLP is often trained with error back-propagation algorithm based on the error correction learning rule (Aydogmus and Turkan, 2016).
A common MLP can be mathematically describe in Eqs. (1)–(5) (Erdal et al., 2013; Erdal, 2015; Namlı et al., 2016);
The output signal for the lth neuron in the nth layer is computed by
]
)
(
)
(
[
)
(
1 1
p j n l n j n lj n lt
w
t
y
t
y
(1)where
(
)
is the activation function,w
ljn is the connection weight, t is the time index and)
(
0t
w
ln n l
is the weighted. For an n-layer network, the synaptic weightw
nji(t
)
is computed by)
(
)
(
)
1
(
t
w
t
w
t
w
nji
nji
nji (2)subject to
l
n
N
and it could be revised as computed by)
(
)
(
)
(
t
t
y
1t
w
in n j n ji
(3) subject to0
1
where
is the learning rate, and t nj nj
(
t
)
E
u
is the local error gradient. To evolve theback-propagation algorithm, a momentum term
is put in)
1
(
)
(
)
(
)
(
1
t
w
t
y
t
t
w
nji
nj in
nji (4) subject to0
1
For the output layer, the local error gradient is computed by
)]
(
[
)
(
)]
(
[
)]
(
)
(
[
)
(
t
d
jt
y
Njt
u
Njt
e
jt
u
Njt
N j
(5)Support Vector Machines (SVMs)
SVMs are originally developed by Vapnik (1995) to handle with the classification problems and have been increasingly used in different forecasting problems (Aydogmus et al., 2015). The SVMs can be defined as fallowed (Erdal et al., 2013; Aydogmus et al., 2015; Ozturk et al., 2015):
b x w x
f( ) ( ) (6)
where
w
n,b
,
denotes the dot product in
n, and
is a non-linear transformation from
mto the high-dimensional space
n(i.e.,n
m
).
i(
x
)
iI1 are the features of inputs,
I i i
w
1and
b
are coefficients. The coefficients are estimated by minimizing the regularized risk function (7):2 1 2 1 ) , ( 1 ) (
L d y w I C C R i i I i (7)where If
d
y
thenL
(
d
,
y
)
d
y
, otherwiseL
(
d
,
y
)
0
and
is a prescribed parameter (Erdal and Ekinci, 2013; Ozturk et al., 2016).IBk
The IBk is an instance-based learning, works as a k-nearest-neighbor classifier, is one of the most widely used instance-based or lazy method for both classification and regression problems. In this paper, it is used for a regression problem. The main assumption behind this algorithm is that the closest instances to the query point have similar target values to the query (Jiawei and Kamber, 2001).
KStar (K*)
KStar is also an instance-based classifier developed for regression with a generalized distance function based on transformations (Türkan et al., 2016). The KStar algorithm uses entropic measure, based on probability of transforming instance into another by randomly selecting between all possible transformations (Painuli et al., 2014).
Locally Weighted Learning (LWL)
The LWL uses an instance-based algorithm, assigns instance weights. This algorithm can perform both classification and regression. The principle idea behind the LWL is that any non-linearity can be approximated by a linear model, if the output surface is smooth (Türkan et al., 2016). Therefore, instead of looking for a complex global model, it is easy to approximate non-linear functions by using simple local models (Arif et al., 2001).
DecisionStump (DStump)
DStump is a decision tree which uses just a single attribute for splitting. It constructs one-level binary decision trees for datasets with a categorical or numeric class, handling with missing values by treating them as a separate value and extending a third branch from the stump (Witten et al., 2011).
C4.5
C4.5 is one of the popular decision tree classifier, which based on information theoretic concepts. It examines the normalised information gain (entropy difference) that results from choosing an attribute for splitting the data. The attribute with the highest normalised information gain is the one used to make the decision (Brown and Mues, 2012). The algorithm is a successor of ID3, which determines at each step the most predictive attribute, and splits a node based on this attribute. Every node represents a decision point over the value of some attribute (Al Snousy et al., 2011). The algorithm then recurs on the smaller subsets.
RandomTree (RTree)
RTree is a regression-based decision tree algorithm. Trees built by RTree consider K randomly selected attributes at each node. RTree performs no pruning nad also has an option to allow prediction of class probabilities based on a hold-out set (backfitting) (Erdal and Karahanoğlu, 2016).
Reduced Error Pruning Tree (REPTree)
REPTree algorithm generates a tree utilizing the node statistics and prunes it utilizing reduced-error pruning (Portnoy and Koenker, 1997). One can set the minimum number of instances per each leaf, maximum tree depth, minimum proportion of training set variance for a split (numeric classes only), and number of folds for pruning (Erdal and Karahanoğlu, 2016).
EXPERIMENTAL DESIGN
Data Acquisition
Customer questionnaire was conducted to collect the required data. The questionnaire was prepared using items and questions prepared solely for the purpose of this study. It was pre-tested on several customers and iterative changes were made on vague items and expressions. The questionnaire was composed of three sections, covering demographic profile, characteristics of service, and patients intentions.
The questionnaire was applied to adult patients who received services from 17 clinics in Palandöken Hospital in Erzurum/Turkey. Among them, 53.6% was male and 46.4% was female.
When the underlying questionnaire was conducted, the total number of the patients in the hospital was 698. The relevant sample size of the questionnaire was calculated with respect to the following formula (Özer, 2004);
𝑛 = NPQZ
2
(N − 1)d2+ PQZ2 (8)
where n denotes the sample size; N denotes the population size (here in the number of patients at that year); P = the probability of the occurrence for a given event (the ratio of respondents was revisited the hospital); Q equals to 1 – P; Z denotes the test statistic under the (1 –α)% significance level; and finally d denotes the tolerance. In this respect, the minimum representative sample size of the survey can be calculated as;
𝑛 = 608003(0.2025)(0.7975)(1,96)
2
During the data collection procedure, 252 questionnaires were transformed and coded to a convenient computer-ready form, which exceeds the number of objective minimum sample size and there were no missing value.
The dependent variable of this study was the patient revisit intension, that was binary in nature where Y = will revisit, N = will not.
Variables was measured using the 5-point Likert-scale ranging from ‘Not at all satisfied (NAS)’ to ‘Highly satisfied (HS)’.
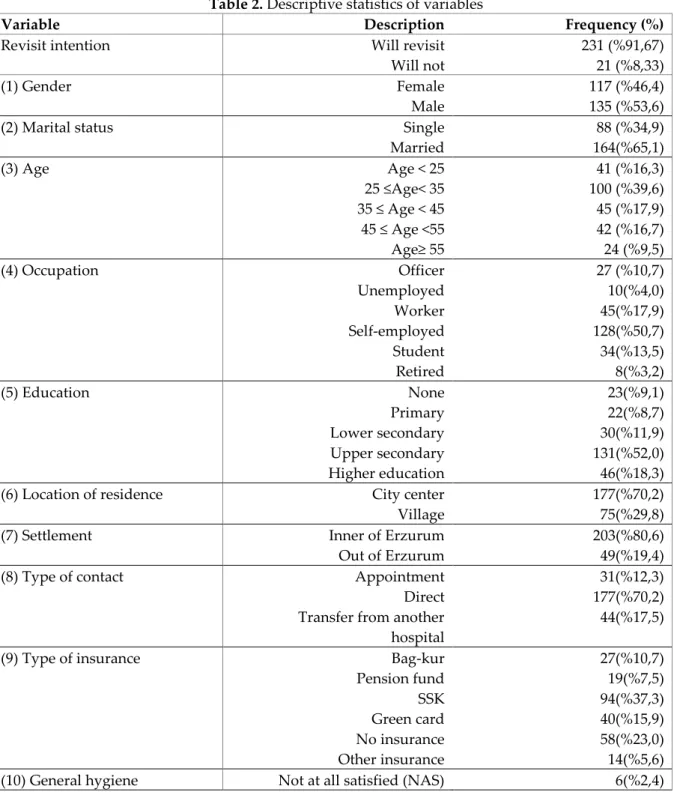
According to descriptive statistics of dependent variable, most of the respondents (91,67%) are generally respondents have a high revisit intention to the corresponding hospital. Table 2. demonstrates the descriptive statistics of patients in the corresponding hospital.
Table 2. Descriptive statistics of variables
Variable Description Frequency (%)
Revisit intention Will revisit
Will not 231 (%91,67) 21 (%8,33) (1) Gender Female Male 117 (%46,4) 135 (%53,6)
(2) Marital status Single
Married 88 (%34,9) 164(%65,1) (3) Age Age < 25 25 ≤Age< 35 35 ≤ Age < 45 45 ≤ Age <55 Age≥ 55 41 (%16,3) 100 (%39,6) 45 (%17,9) 42 (%16,7) 24 (%9,5) (4) Occupation Officer Unemployed Worker Self-employed Student Retired 27 (%10,7) 10(%4,0) 45(%17,9) 128(%50,7) 34(%13,5) 8(%3,2) (5) Education None Primary Lower secondary Upper secondary Higher education 23(%9,1) 22(%8,7) 30(%11,9) 131(%52,0) 46(%18,3)
(6) Location of residence City center
Village
177(%70,2) 75(%29,8)
(7) Settlement Inner of Erzurum
Out of Erzurum
203(%80,6) 49(%19,4)
(8) Type of contact Appointment
Direct Transfer from another
hospital
31(%12,3) 177(%70,2)
44(%17,5)
(9) Type of insurance Bag-kur
Pension fund SSK Green card No insurance Other insurance 27(%10,7) 19(%7,5) 94(%37,3) 40(%15,9) 58(%23,0) 14(%5,6)
Not satisfied (NS) Partially satisfied(PS) Satisfied(S) Highly satisfied(HS) 7(%2,8) 33(%13,1) 133(%52,7) 73(%29,0)
(11) Doctor’s courtesy NAS
NS PS S HS 9(%3,6) 15(%6,0) 17(%6,7) 128(%50,8) 83(%32,9)
(12) Doctor’s response NAS
NS PS S HS 8(%3,2) 15(%6,0) 50(%19,8) 109(%43,3) 70(%27,8)
(13) Trust to doctor NAS
NS PS S HS 7(%2,8) 18(%7,1) 38(%15,1) 108(%42,9) 81(%32,1)
(14) Trust to caregiver NAS
NS PS S HS 11(%4,4) 18(%7,1) 45(%17,9) 116(%46,0) 62(%24,6)
(15) Overall Patient satisfaction NAS
NS PS S HS 6(%2,4) 16(%6,3) 57(%22,6) 94(%37,3) 79(%31,4) Evaluation criteria
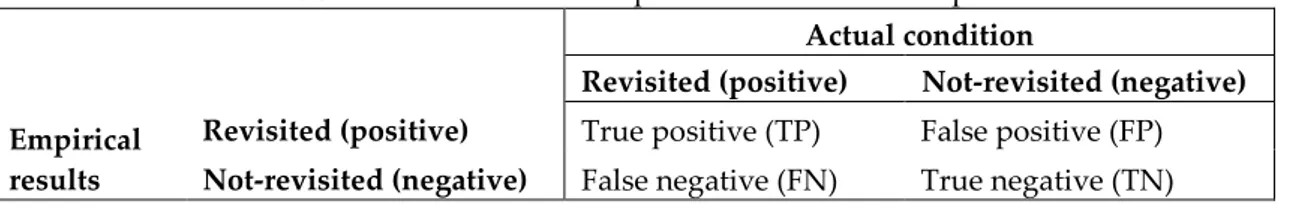
In this paper, it is preferred to utilized a combination of Type-I error, Type-II error and average accuracy, rather than a single measure, to evaluate the patient revisit intention prediction methods. That is an error to predict actually not revisited patients who have been predicted as actually revisited. This kind of error can be describe as Type-I error. Similarly, predicting actually revisited patients who have been predicted as actually not revisited is also an error. This kind of error can be describe as Type-II error. From a theoretical point of view, it is better to utilize prediction models with lower type-I errors (actually not revisited patients who have been predicted as actually revisited), but in practice it is also of great importance for the hospitals to achieve an appropriate balance between both error types so as not to assess potentially customers as not revisited ones (Ekinci and Erdal, 2011; Erdal and Ekinci, 2015). The definition of these measures can be explained with respect to a confusion matrix as demonstrated in Table 3.
Table 3. Confusion matrix for patient revisit intention prediction Actual condition
Revisited (positive) Not-revisited (negative) Empirical
results
Revisited (positive) True positive (TP) False positive (FP) Not-revisited (negative) False negative (FN) True negative (TN)
Type-I error, Type-II error and Average accuracy can be mathematically describe in Eqs. (9)–(11) (Marqués et al., 2012; Yaprakli and Erdal, 2016);
(TP+FN)
FN
or=
Type I err
(9)(TN+FP)
FP
ror=
Type II er
(10) TN) (TP+FP+FN+ (TP+TN) curacy= Average ac (11)As stated by Caouette et al. (2008), the misclassification costs associated with type-I errors are typically much higher than those associated with type-II errors. And the accuracy ignores the different cost of both type-I and type-II errors.
Experimental procedure
The common implementation to evaluate repurchase intention models is to utilize a sufficient sample since huge sets of past applicants are mostly available. In some conditions, the data are inadequate to create an accurate prediction and so, other implementations have to be utilized so that to obtain better prediction performance. In this framework, the most widely used implementation is cross-validation (Marqués et al., 2012).
The evaluation is conducted with the k-fold cross validation. k-fold cross-validation is used to optimize bias with regard to the random sampling of the training and testing data when comparing the prediction accuracy of various models. Kohavi (1995) stated that 10 folds were optimal. In this study we used 10-fold cross-validation.
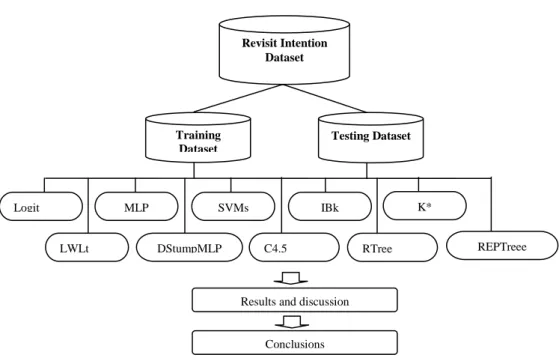
As mentioned above, the ML algorithms, used in this paper, divided into three categories; Functions, Lazy-learning Algorithms, and Tree-based Learning Algorithms. Functions classify the test data based on a specific function. The Logit, MLP and SVM are the most widely used function algorithms. Lazy-learning algorithms, unlike other classification or regression techniques, save the training data and build the model after receiving the test data. The IBK, K* and LWL are the most common lazy classifiers, used in this study. Tree-based learning algorithms classify the test data by building a decision tree. In tree-based learning algorithms, internal nodes are tests on an attribute value or multiple attributes values, branches are outcomes of the tests, and leaf nodes are class labels (Moshtari et al., 2013). DStump, C4.5, RTree, REPTree are four instances of tree-based learning algorithms. Hereinafter the experimental procedure is presented in Figure 1.
Figure 1. Experimental procedure
Now the results of the individual ML methods are discussed. RESULTS AND DISCUSSIONS
In this paper, data mining toolkit WEKA version 3.7.11 was utilized for case study.
All the ML algorithms are used with their default parameter settings, as defined in Weka 3.7.11, to reduce the danger of over fitting due to excessive parameter tuning.
Our goal in this study is to investigate which ML technique is the most appropriate for patient revisit intention prediction problem.
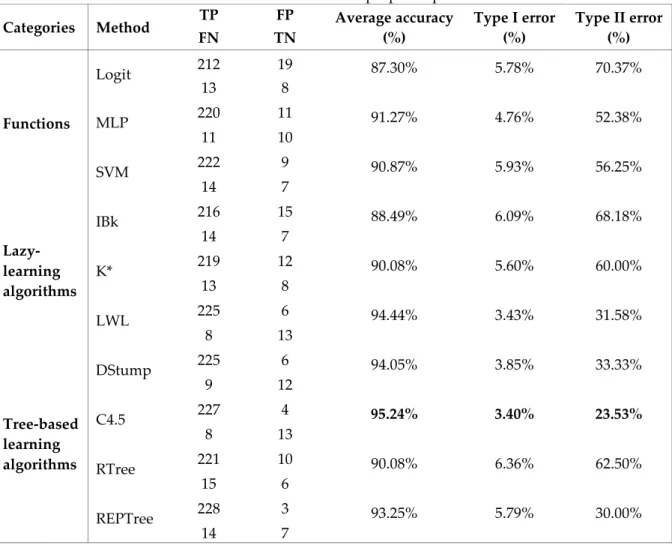
To evaluate ten ML techniques, we averaged the performance indicators. Table 4. summarizes the performance indicators of the predictive models on the gathered datasets.
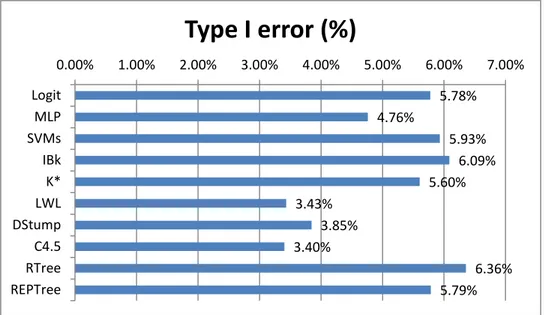
In terms of average accuracy, all ten algorithms can reach more than 87% of classification correctly. For all three performance indicators, presented in Table 4 and Figures 2-4., C4.5 performs best (95.24%, 3.40%, 23.53%) since it has the highest overall Average Accuracy and a very low percentage error on both Type I and Type II errors, closely followed by the LWL (94.44%, 3.43%, 31.58%) and DStump (94.05%, 3,85%, 30.00%), whereas the Logit and the IBk algorithms appear to be the worst in terms of Average Accuracy (87.30% and 88.49%, respectively) and Type II error (70.37% and 68.18%, respectively). Besides, the RTree (6.36%) and the IBk (6.09%) algorithms appear to be the worst in terms of Type I error.
Note from the table and figures, obtained performance indicators are presented, the tree-based learning algorithms yield significant prediction performance. C4.5 is using entropy-based segmentation algorithm and it is used widely for designing decision trees. C4.5 can generate decision trees by numeric values. Beside it also offers a solution to build decision trees when there are missing values. C4.5 algorithm makes possible to classify the datasets that has quantitative attributes, also both continuous and discrete attributes. In order to handle continuous attributes, C4.5 creates a threshold and then splits the list into those whose attribute value is above the threshold and those that are less than or equal to it (Özsoy et al., 2015). Since it is experienced numerously that C 4.5 had a pretty good performance on such a dataset that has many quantitative varibles and missing values like our dataset.
Logit MLP SVMs
LWLt DStumpMLP C4.5
Results and discussion
Conclusions Revisit Intention Dataset Training Dataset Testing Dataset K* IBk REPTreee RTree
Table 4. Performance statistics of proposed predictive models
Figures 2-4. demonstrates the performance indicators, i.e., Type-I error, Type-II error and Average Accuracy.
Figure 2. Results (average) of average accuracy. 87.30% 91.27% 90.87% 88.49% 90.08% 94.44% 94.05% 95.24% 90.08% 93.25% 82.00% 84.00% 86.00% 88.00% 90.00% 92.00% 94.00% 96.00% Logit MLP SVMs IBk K* LWL DStump C4.5 RTree REPTree
Average accuracy (%)
Categories Method TP FP Average accuracy (%) Type I error (%) Type II error (%) FN TN Functions Logit 212 19 87.30% 5.78% 70.37% 13 8 MLP 220 11 91.27% 4.76% 52.38% 11 10 SVM 222 9 90.87% 5.93% 56.25% 14 7 Lazy-learning algorithms IBk 216 15 88.49% 6.09% 68.18% 14 7 K* 219 12 90.08% 5.60% 60.00% 13 8 LWL 225 6 94.44% 3.43% 31.58% 8 13 Tree-based learning algorithms DStump 225 6 94.05% 3.85% 33.33% 9 12 C4.5 227 4 95.24% 3.40% 23.53% 8 13 RTree 221 10 90.08% 6.36% 62.50% 15 6 REPTree 228 3 93.25% 5.79% 30.00% 14 7
Figure 3. Results (average) of type-I error.
Figure 4. Results (average) of type-II error.
CONCLUSION AND FUTURE DIRECTIONS
The trend of patient revisit intention analysis is an improved reliance on computerized decision making models. Computerized decision-making may never take the place of the hospital managers, but it can provide decision support via a simple questionnaire.
Specifically, this study has demonstrated the promising attempt of incorporating sentiment classification into patient revisit intention.
Findings of this paper are likely to lead to a new trend of managerial processing in healthcare sector. This could influence the design of managerial systems in healthcare organizations in different functional areas. As well, empirical results of this study can provide insights to study how ML techniques can provide decision support about patients intentions.
This paper has focused on a comparative analysis of various widely used prediction algorithms on patient revisit intention prediction. With this aim, ten ML techniquies have been utilized to a hospital managerial problem. 5.78% 4.76% 5.93% 6.09% 5.60% 3.43% 3.85% 3.40% 6.36% 5.79% 0.00% 1.00% 2.00% 3.00% 4.00% 5.00% 6.00% 7.00% Logit MLP SVMs IBk K* LWL DStump C4.5 RTree REPTree
Type I error (%)
70.37% 52.38% 56.25% 68.18% 60.00% 31.58% 30.00% 23.53% 62.50% 33.33% 0.00% 10.00% 20.00% 30.00% 40.00% 50.00% 60.00% 70.00% 80.00% Logit MLP SVMs IBk K* LWL DStump C4.5 RTree REPTreeType II error (%)
Experimental results reveal that the C4.5 tree demonstrates to be the most suitable predictive model since it has the highest overall average accuracy and a very low percentage error on both Type I and Type II errors, closely followed by the locally weighted learning and decisionstump, whereas the logistic regression and the IBk algorithms appear to be the worst in terms of average accuracy and type II error. Besides the randomtree and the IBk algorithms appear to be the worst in terms of type I error.
For further research, the present analysis could be to extend to other individual ML algorithms and ensemble approaches and extend to the other sectors and studies on costumer relations. A natural extension of this research is to expand the number of hospitals and provinces. Although this study has analyzed the data for central Erzurum, the applicability of the presented classification methods in other hospitals remain unknown and is thus worthwhile for future investigation. Another direction for future research is that since costumers change their perception frequently it would be interesting to do a longitudinal study to compare the findings between different time periods.
In this paper, data mining toolkit WEKA version 3.7.11 was utilized for case study.
All the ML algorithms are used with their default parameter settings, as defined in Weka 3.7.11, to reduce the danger of over fitting due to excessive parameter tuning.
REFERENCES
Al-Refaie, A., 2011, “A Structural Model to Investigate Factors Affect Patient Satisfaction and Revisit Intention in Jordanian Hospitals”, International Journal of Artificial Life Research, Vol. 2(4), pp. 43-56.
Al Snousy, M. B., El-Deeb, H. M., Badran, K., Al Khlil, I. A., 2011, “Suite of Decision Tree-based Classification Algorithms on Cancer Gene Expression Data”, Egyptian Informatics Journal, Vol. 12(2), pp. 73-82.
Aliman, N. K., Mohamad, W. N. (2013). “Perceptions of Service Quality and Behavioral Intentions: A Mediation Effect of Patient Satisfaction in the Private Health Care in Malaysia”, International Journal of Marketing Studies, Vol. 5(4), pp. 15-29.
Anbarasi, M., Anupriya, E., Iyengar, N. C. S. N., 2010, “Enhanced Prediction of Heart Disease with Feature Subset Selection using Genetic Algorithm”, International Journal of Engineering Science and Technology, Vol. 2(10), pp. 5370-5376.
Arif, M., Ishihara, T., Inooka, H., 2001, “Incorporation of Experience in Iterative Learning Controllers using Locally Weighted Learning”, Automatica, Vol. 37(6), pp. 881-888.
Aydogmus, H.Y., Ekinci, A., Erdal, H.İ., Erdal, H., 2015, “Optimizing the Monthly Crude Oil Price Forecasting Accuracy via Bagging Ensemble Models”, Journal of Economics and International Finance, Vol. 7(5), pp. 127-136.
Aydogmus, H.Y., Erdal, H.İ., Karakurt, O., Namli, E., Turkan, Y.S., Erdal, H., 2015, “A Comparative Assessment of Bagging Ensemble Models for Modeling Concrete Slump Flow”, Computers and Concrete, Vol. 16(5), pp. 741-757.
Aydogmus, H.Y., Turkan, Y.S., 2016, “Passenger Demand Prediction for Fast Ferries Based on Neural Network and Support Vector Machine”, Uluslararası Alanya İşletme Fakültesi Dergisi, Vol. 8(1), pp. 209-216.
Boshoff, C., Gray, B., 2004, “The Relationships Between Service Quality, Customer Satisfaction and Buying Intentions in The Private Hospital Industry”, South African Journal of Business Management, Vol. 35(4), pp. 27-37.
Brown, I., Mues, C., 2012, “An Experimental Comparison of Classification Algorithms for Imbalanced Credit Scoring Data Sets”, Expert Systems with Applications, Vol. 39(3), pp. 3446-3453.
Bushinak, H., AbdelGaber, S., AlSharif, F. K., 2011, “Recognizing The Electronic Medical Record Data from Unstructured Medical Data Using Visual Text Mining Techniques”, International Journal of Computer Science and Information Security, Vol. 9(6), pp. 25-35.
Caouette, J., Altman, E., Narayanan, P., Nimmo, R., 2008, Managing Credit Risk: The Great Challenge for Global Financial Markets, Hoboken, NJ: Wiley.
Chandra, D.K., Ravi, V., Bose, I., 2009, “Failure Prediction of Dotcom Companies using Hybrid Intelligent Techniques”, Expert Systems with Applications, Vol. 36(3), pp. 4830-4837.
Cho, B. H., Yu, H., Kim, K. W., Kim, T. H., Kim, I. Y., Kim, S. I., 2008, “Application of Irregular and Unbalanced Data to Predict Diabetic Nephropathy using Visualization and Feature Selection Methods”, Artificial Intelligence in Medicine, Vol. 42(1), pp. 37-53.
Cooper, G. F., Aliferis, C. F., Ambrosino, R., Aronis, J., Buchanan, B. G., Caruana, R., Janosky, J. E., 1997, “An evaluation of Msachine-learning Methods for Predicting Pneumonia Mortality”, Artificial Intelligence in Medicine, Vol. 9(2), pp. 107-138.
De Bruin, J. S., Adlassnig, K. P., Blacky, A., Koller, W., 2016, “Detecting Borderline Infection in An Automated Monitoring System for Healthcare-associated Infection using Fuzzy Logic”, Artificial Intelligence in Medicine, Vol. 69, pp. 33-41.
Duch, W., Swaminathan, K., Meller, J., 2007, “Artificial Intelligence Approaches for Rational Drug Design and Discovery”, Current Pharmaceutical Design, Vol. 13(14), pp. 1497-1508.
Ekinci, A., Erdal, H. İ., 2011, “Türkiye’de Banka Başarısızlıklarının Tahmini Üzerine Bir Uygulama”, Iktisat Isletme ve Finans, Vol. 26(298), pp. 21-44.
Erdal, H., 2015, “Makine Öğrenmesi Yöntemlerinin İnşaat Sektörüne Katkısı: Basınç Dayanımı Tahminlemesi”, Pamukkale Üniversitesi Mühendislik Bilimleri Dergisi, Vol. 21(3), pp. 109-114. Erdal, H., Karahanoğlu, İ., 2016, “Bagging Ensemble Models for Bank Profitability: An Emprical
Research on Turkish Development and Investment Banks”, Applied Soft Computing, Vol. 49, pp. 861-867.
Erdal, H. I., Baray, A., Esnaf, Ş., 2013, “Estimation of The Manufacturing Industry Sub-sectors’ Capacity Utilization Rates using Support Vector Machines”, Artificial Intelligence Research, Vol. 3(1), pp. 1-11.
Erdal, H. I., Ekinci, A., 2013, “A Comparison of Various Artificial Intelligence Methods in The Prediction of Bank Failures”, Computational Economics, Vol. 42(2), pp. 199-215.
Erdal H. I., Ekinci, A., 2015, “Bank Failure Prediction Using Hybrid Classifier Ensembles of Random Sub-Spaces and Bagging”, The Second Yandex School of Data Analysis, Machine Learning: Prospects and Applications, 5-8 October 2015, Berlin, Germany.
Erdal, H. I., Karakurt, O., Namli, E., 2013, “High Performance Concrete Compressive Strength Forecasting using Ensemble Models Based on Discrete Wavelet Transform”, Engineering Applications of Artificial Intelligence, Vol. 26(4), pp. 1246-1254.
Erdal, H.I., Namli, E., Aydogmus, H.Y., Turkan, Y.S., 2013, “Comparing Ensembles of Decision Trees and Neural Networks for One-day-ahead Streamflow Prediction”, Scientific Research Journal, Vol. I (IV), pp. 43-55.
Fiannaca, A., La Rosa, M., Rizzo, R., Urso, A., 2015, “A k-mer-based Barcode DNA Classification Methodology Based on Spectral Representation and A Neural Gas Network”, Artificial Intelligence in Medicine, Vol. 64(3), pp. 173-184.
Güzel, D., 2014, “A Research of Various Work Variables on Pharmacists Operating in Service Industry: the Province of Erzurum Sample”. 13th International Academic Conference, Antibes, French Riviera, 15-18 September 2014,.
Hanson III, C. W., Marshall, B. E., 2001, “Artificial Intelligence Applications in The Intensive Care Unit”, Critical Care Medicine, Vol. 29(2), pp. 427-435.
Hosmer, D. W., Stanley, L., 2000, Applied Logistic Regression, (2nd ed.), New York: Chichester, Wiley. Jerez, J. M., Molina, I., García-Laencina, P. J., Alba, E., Ribelles, N., Martín, M., Franco, L., 2010, “Missing
Data Imputation using Statistical and Machine Learning Methods in A Real Breast Cancer Problem”, Artificial Intelligence in Medicine, Vol. 50(2), pp. 105-115.
Jiawei, H., Kamber, M., 2001, Data Mining: Concepts and Techniques, San Francisco, CA, itd: Morgan Kaufmann.
Kalantarian, H., Motamed, B., Alshurafa, N., Sarrafzadeh, M., 2016, “A Wearable Sensor System for Medication Adherence Prediction”, Artificial Intelligence in Medicine, Vol. 69, pp.43-52.
Kang, M. H., Yoon, S. Y., Kwon, M. J., Shim, H. S., 2013, “Emotional Labor of Nurses as Perceived by Patients, Satisfaction with Nursing Service, and Intention to Revisit the Hospital”, International Journal of Digital Content Technology and its Applications, Vol. 7(12), pp. 289-293.
Khalilia, M., Chakraborty, S., Popescu, M., 2011, “Predicting Disease Risks from Highly Imbalanced Data using Random Forest”, BMC Medical Informatics and Decision Making, Vol. 11(1), pp.51-60. Kohavi, R., 1995, “A Study of Cross-validation and Bootstrap for Accuracy Estimation and Model
Selection”, 14th Int. Joint Conf. on Artificial Intelligence, San Francisco, pp. 1137-1143. Morgan Kaufmann.
Kononenko, I., 2001, “Machine Learning for Medical Diagnosis: History, State of The Art and Perspective”, Artificial Intelligence in Medicine, Vol. 23(1), pp. 89-109.
Lin, R. H., 2009, “An Intelligent Model for Liver Disease Diagnosis”, Artificial Intelligence in Medicine, Vol. 47(1), pp. 53-62.
Li, Z., Wen, G., Xie, N., 2015, “An Approach to Fuzzy Soft Sets in Decision Making Based on Grey Relational Analysis and Dempster–Shafer Theory of Evidence: An Application in Medical Diagnosis”, Artificial Intelligence in Medicine, Vol. 64(3), pp. 161-171.
Marqués, A.I., García, V., Sánchez, J.S., 2012, “Two-level Classifier Ensembles for Credit Risk Assessment”, Expert Systems with Applications, Vol. 39(1), pp. 10916-10922.
Milovic, B., Milovic, M., 2012, “Prediction and Decision Making in Health Care using Data Mining”, International Journal of Public Health Science, Vol. 1(2), pp.69-78.
Moshtari, S., Sami, A., Azimi, M., 2013, “Using Complexity Metrics to Improve Software Security”, Computer Fraud & Security, Vol. 2013(5), pp. 8-17.
Namlı, E., Erdal, H.İ., Erdal, H., 2016, “Dalgacık Dönüşümü ile Beton Basınç Dayanım Tahmininin İyileştirilmesi”, Politeknik Dergisi, Vol. 19(4), pp. 471-480.
Özer, H., 2004, Nitel Değişkenli Ekonometrik Modeller: Teori ve Bir Uygulama, Nobel Yayın Dağıtım, Ankara. Özsoy, S., Gümüş, G., Khalilov, S. (2015), “C4. 5 Versus Other Decision Trees: A Review”, Computer
Engineering and Applications Journal, Vol. 4(3), pp. 173-182.
Öztürk, H., Namli, E., Erdal, H. I., 2015, “Reducing Overreliance on Sovereign Credit Ratings: Which Model Serves Better? ”, Computational Economics, Vol. 48(1), pp. 59-81.
Öztürk, H., Namli, E., Erdal, H. I., 2016, “Modelling Sovereign Credit Ratings: The Accuracy of Models in A Heterogeneous Sample”, Economic Modelling, Vol. 54, pp. 469-478.
Painuli, S., Elangovan, M., Sugumaran V., 2014, “Tool Condition Monitoring using K-star Algorithm”, Expert Systems with Applications, Vol. 41, pp. 2638-2643.
Park, H. S., Seo, Y. J., 2014, “Determinants of Inpatients Satisfaction and Intent to Revisit Oriental Medical Hospitals”, Journal of Korean Medicine, Vol. 35(4), PP. 65-73.
Parthiban, L., Subramanian, R., 2007, “Intelligent Heart Disease Prediction System using CANFIS and Genetic Algorithm”, International Journal of Biological, Biomedical and Medical Sciences, Vol. 1(5), pp. 278-281.
Portnoy, S., Koenker, R., 1997, “The Gaussian Hare and The Laplacian Tortoise: Computability of Squared-error Versus Absolute-error Estimators”, Statisticals Sciences, Vol. 12(4), pp. 279-300. Sarker, A., Mollá, D., Paris, C., 2015, “Automatic Evidence Quality Prediction to Support Evidence-based
Decision Making”, Artificial Intelligence in Medicine, Vol. 64(2), pp. 89-103.
Sarvari, N. G., 2012, Destination Brand Equity, Satisfaction And Revisit Intention: An Application In TRNC As a Tourism Destination, Doctoral Dissertation, Eastern Mediterranean University, Cyprus. Soni, J., Ansari, U., Sharma, D., Soni, S., 2011, “Predictive Data Mining for Medical Diagnosis: An
Overview of Heart Disease Prediction”, International Journal of Computer Applications, Vol. 17(8), pp. 43-48.
Stühlinger, W., Hogl, O., Stoyan, H., Müller, M., 2000, “Intelligent Data Mining for Medical Quality Management”, Proceedings Fifth Workshop Intelligent Data Analysis in Medicine and Pharmacology (IDAMAP-2000).
Tüfekci, P., 2014, “Prediction of Full Load Electrical Power Output of A Base Load Operated Combined Cycle Power Plant using Machine Learning Methods”, International Journal of Electrical Power & Energy Systems, Vol. 60, pp. 126-140.
Türkan, Y. S., Aydoğmuş, H. Y., Erdal, H., 2016, The Prediction of The Wind Speed at Different Heights by Machine Learning Methods, An International Journal of Optimization and Control: Theories & Applications, Vol. 6(2), pp. 179-187.
Verplancke, T., Van Looy, S., Benoit, D., Vansteelandt, S., Depuydt, P., De Turck, F., Decruyenaere, J., 2008, “Support Vector Machine Versus Logistic Regression Modeling for Prediction of Hospital Mortality in Critically Ill Patients with Haematological Malignancies”, BMC Medical Informatics and Decision Making, Vol. 8(1), pp. 56-64.
Witten, I.H., Frank, E., Hall, M.A., 2011, Data Mining Practical Machine Learning Tools and Techniques, Third Edition, San Francisco, Morgan Kaufmann.
Yapraklı, T.Ş., Erdal, H., 2016, “Firma Başarısızlığı Tahminlemesi: Makine Öğrenmesine Dayalı Bir Uygulama”, International Journal of Informatics Technologies, Vol. 9(1), pp. 21-31.
Yeang, C. H., Ramaswamy, S., Tamayo, P., Mukherjee, S., Rifkin, R. M., Angelo, M., Golub, T., 2001, “Molecular Classification of Multiple Tumor Types”, Bioinformatics, Vol. 17(suppl 1), pp. 316-322.