MARKET-BASED ENVIRONMENTAL REGULATION IN THE POST-KYOTO WORLD:
ANALYSIS OF TURKEY’S ACTION PLAN IN GENERAL EQUILIBRIUM FRAMEWORK
Graduate School of Economics and Social Sciences of
İhsan Doğramacı Bilkent University
by
GÖKÇE AKIN OLÇUM
In Partial Fulfillment of the Requirements for the Degree of DOCTOR OF PHILOSOPHY
in
THE DEPARTMENT OF ECONOMICS İHSAN DOĞRAMACI BİLKENT UNIVERSITY
ANKARA July 2012
I certify that I have read this thesis and have found that it is fully adequate, in scope and in quality, as a thesis for the degree of Doctor of Philosophy in Economics.
________________________ Prof. Dr. Erinç Yeldan Supervisor
I certify that I have read this thesis and have found that it is fully adequate, in scope and in quality, as a thesis for the degree of Doctor of Philosophy in Economics.
________________________ Prof. Dr. Serdar Sayan
Examining Committee Member
I certify that I have read this thesis and have found that it is fully adequate, in scope and in quality, as a thesis for the degree of Doctor of Philosophy in Economics.
________________________ Assoc. Prof. Dr. Selin Sayek Böke Examining Committee Member
I certify that I have read this thesis and have found that it is fully adequate, in scope and in quality, as a thesis for the degree of Doctor of Philosophy in Economics.
________________________
Assoc. Prof. Dr. Süheyla Özyıldırım Examining Committee Member
I certify that I have read this thesis and have found that it is fully adequate, in scope and in quality, as a thesis for the degree of Doctor of Philosophy in Economics.
________________________ Assist. Prof. Dr. H. Çağrı Sağlam Examining Committee Member
Approval of the Graduate School of Economics and Social Sciences
________________________ Prof. Dr. Erdal Erel
iii
ABSTRACT
MARKET-BASED ENVIRONMENTAL REGULATION IN
THE POST-KYOTO WORLD:
ANALYSIS OF TURKEY’S ACTION PLAN IN
GENERAL EQUILIBRIUM FRAMEWORK
Akın Olçum, Gökçe Ph.D., Department of Economics Supervisor: Prof. Dr. Erinç Yeldan
July 2012
The purpose of this dissertation is to investigate the economic impacts of Turkey’s environmental regulation based on emission trading schemes in the post-Kyoto world. The dissertation is composed of two main parts. The first part is dedicated to the methodology underlying the Multi-Region Environmental and Trade Policy Analysis (MR-ETPA) model, which is developed for simulating market-based environmental regulation policies in general equilibrium framework. In the second part, the MR-ETPA model is further used for simulating the potential emission trading schemes that Turkey considers to apply, i.e. unilateral nationwide trading and international trading of permits within the European Union Emission Trading Scheme (EU ETS). The results indicate that Turkey has economic gains under bilateral trading within the EU ETS in comparison to domestic trading schemes. The economic benefits of the European Union highly depend on the design of the Turkish emission trading scheme. While unilateral trading schemes result in economic gains for the European Union, the net effect under bilateral trading very much depends on the total cost burden that Turkey imposes on the individual sectors.
Keywords: Climate mitigation policy, emission trading systems, computable general equilibrium models, Turkey, European Union
iv
ÖZET
KYOTO SONRASI MARKET TEMELLİ
ÇEVRESEL REGÜLASYON UYGULAMALARI:
GENEL DENGE MODELİ ÇERÇEVESİNDE
TÜRKİYE’NİN EYLEM PLANININ ANALİZİ
Akın Olçum, Gökçe Doktora, Ekonomi Bölümü Tez Yöneticisi: Prof. Dr. Erinç Yeldan
Temmuz 2012
Bu tezin amacı, Türkiye ekonomisi için Kyoto sonrası dönemde uygulanması planlanan emisyon ticaretine dayalı çevresel regülasyonların iktisadi etkilerini analiz etmektir. Tez iki ana kısımdan oluşmaktadır. İlk kısımda, genel denge sistematiğine dayalı olarak geliştirilmiş ve market temelli çevresel regülasyon politikalarını analiz etmekte kullanılan “Çok Ülkeli Çevresel ve Ticari Politikaların Analizi” (MR-ETPA) modelinin metodolojisi ele alınmaktadır. İkinci kısımda, MR-ETPA modeli kullanılarak Türkiye’nin Kyoto sonrası dönemde uygulamayı planladığı muhtemel emisyon ticareti modellerinin iktisadi analizleri yapılmaktadır. Bu modellerden başlıcaları yerel ölçekte emisyon ticareti uygulaması ile Avrupa Birliği Karbon Piyasası (EU ETS) ile entegre olmuş yerel emisyon piyasası uygulamalarıdır. Çalışmanın sonuçları, Türkiye’nin yerel ölçekli emisyon ticareti uygulamalarına kıyasla EU ETS’ye entegre olmuş yerel emisyon piyasası uygulamalarından daha fazla iktisadi kazanımları olacağını göstermektedir. Avrupa Birliği Türkiye’nin yerel ölçekli emisyon ticareti uygulamalarından mutlak iktisadi kazanımlar sağlarken, EU ETS ile entegrasyon altındaki iktisadi etkiler Türkiye’nin emisyon marketi kurgusuna bağlı olarak değişmektedir. Bu bağlamda, Türkiye’nin toplam kota uygulamalarının ve bunun sektörler arası ayrıştırılmasının Avrupa Birliği açısından önem taşıdığı görülmektedir.
Anahtar Kelimeler: İklim değişikliği politikaları, emisyon ticareti sistemleri, hesaplanabilir genel denge modelleri, Türkiye, Avrupa Birliği
v
ACKNOWLEDGEMENTS
The completion of this thesis would not have been possible without the support and assistance of many others. I would like to take this opportunity to acknowledge my gratitude to them.
First and foremost, I would like to express my gratitude to Prof. Dr. Erinç Yeldan for his continuous encouragement, patience and support. I have always felt privileged and fortunate that I found the opportunity to work with him.
I would like to thank Prof. Dr. Christoph Böhringer from the bottom of my heart for his sincere support, insightful feedback and invaluable opinions. I wish to express my sincere appreciation to Prof. Dr. Serdar Sayan, Assoc. Prof. Dr. Selin Sayek Böke, Assoc. Prof. Dr. Süheyla Özyıldırım and Assist. Prof. Dr. Çağrı Sağlam for serving on my dissertation committee and for their invaluable feedback, support and encouragement.
Additionally, I would like to express my gratitude to Assoc. Prof. Dr. Fatma Taşkın and Assoc. Prof. Dr. Refet Gürkaynak for supporting and giving me the opportunities to enlarge my vision during my studies.
I wish to express appreciation to the Department of Economics at Bilkent University and TÜBİTAK, as this thesis would not have been possible without their financial supports.
I wish to express my gratitude to my friends Onur Doğan, Ezgi Kargan, Doruk Başar and Finn Marten Körner. I have always felt fortunate that I got the chance to know you. I am deeply indebted to you for all the joy that you brought in my life.
And my beloved parents, Semiye and Kadir Yaşar... I would like to express my eternal gratitude to you for your everlasting love, understanding and support.
The last but definitely not the least, I am deeply indebted to my husband, Selim, for his endless love, encouragement and support. I hope all this effort and time bring us a happy and meaningful life together.
vi
TABLE OF CONTENTS
ABSTRACT ... iii ÖZET ... iv ACKNOWLEDGEMENTS ... v TABLE OF CONTENTS ... vi LIST OF TABLES ... ixLIST OF FIGURES ... xii
... 1
CHAPTER 1 Introduction ... 1
... 6
CHAPTER 2 Market-Based Environmental Regulation ... 6
2.1. Introduction ... 6
2.2. Market-based Instruments ... 7
2.3. Market-based Regulation in the European Union ... 10
2.3.1. Kyoto world ... 10
2.3.2. Post-Kyoto world ... 13
2.4. Market-based Regulation in Turkey ... 15
2.4.1. Kyoto world ... 15
2.4.2. Post-Kyoto world ... 19
2.5. Longer Term Perspective on Market-based Regulations ... 22
2.5.1. Linking regional cap-and-trade systems... 22
vii
2.6. Concluding Comments ... 25
... 27
CHAPTER 3 Analysis of Market-based Environmental Regulation in General Equilibrium Framework ... 27
3.1. Introduction ... 27
3.2. Model Description ... 28
3.3. Model Formulation ... 33
3.3.1. Characterization of economic equilibrium ... 33
3.3.2. Activities and zero profit conditions ... 34
3.3.3. Commodities and market clearance conditions ... 43
3.3.4. Macro Balances ... 46
3.4. Model Implementation ... 48
3.5. Tables of Model Variables, Parameters and Sets ... 48
3.6. Tables of Ancillary Variables... 52
3.7. Theoretical Basics for MCP Approach ... 52
3.7.1. General equilibrium ... 52
3.7.2. Computable general equilibrium modeling ... 54
3.8. Constant Elasticity of Substitution Functions ... 57
... 59
CHAPTER 4 Model Calibration and Benchmark Equilibrium ... 59
4.1. Introduction ... 59
4.2. Overview ... 59
4.3. Data Aggregation ... 60
4.4. Regional and Global Social Accounting Matrices... 62
4.5. Constructing the Benchmark Equilibrium ... 64
4.5.1. Optimality (zero profit) conditions ... 65
4.5.2. Market clearing conditions ... 69
viii
4.5.4. Energy use and CO2 emissions ... 71
4.6. Country Profiles at Benchmark Equilibrium ... 72
4.6.1. Turkey ... 72
4.6.2. The European Union ... 75
4.6.3. The rest of the world ... 78
4.7. Social Accounting Matrices at Benchmark Equilibrium ... 81
... 82
CHAPTER 5 Economic Impacts of Market-based Environmental Regulation in Turkey ... 82
5.1. Introduction ... 82
5.2. Business-As-Usual Scenario ... 82
5.3. Description of Policy Scenarios ... 85
5.4. NOACT: No Abatement Case ... 88
5.5. NP_rETS: Non Partitioned Regional ETS Market ... 95
5.6. P_rETS: Partitioned Regional ETS Market ... 103
5.7. EU_ETS: The European Union ETS market ... 110
5.8. Concluding Comments ... 119
... 127
CHAPTER 6 Conclusions and Future Directions ... 127
BIBLIOGRAPHY ... 131
The GTAP 7 Data Base ... 139
APPENDIX A Mappings for Data Aggregation ... 141
APPENDIX B Trade Flows in the GTAP 7 Data Base ... 143
APPENDIX C C.1 Turkey... 143
C.2 The European Union ... 145
ix
LIST OF TABLES
Table 2.1: Key indicators of the European Union ... 12
Table 2.2: Key indicators of Turkey ... 16
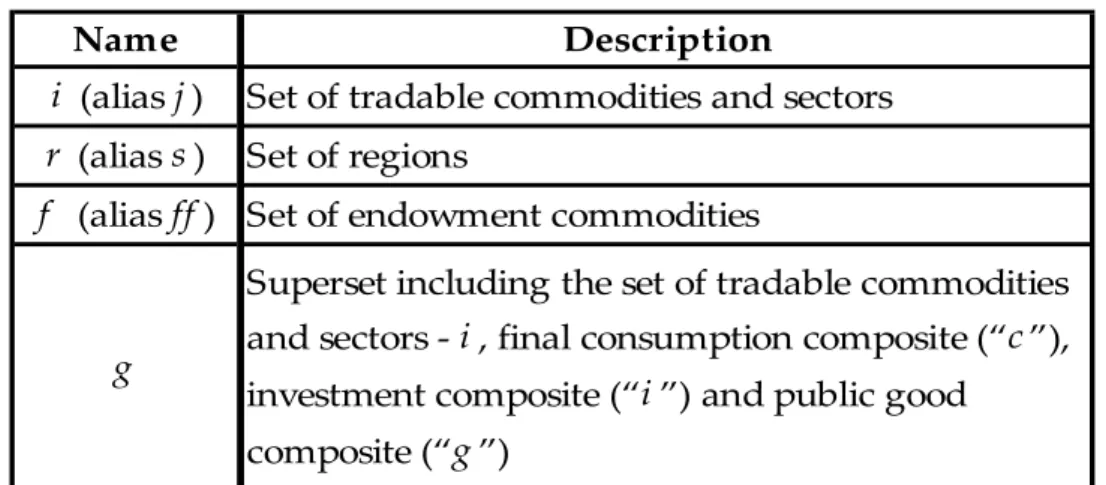
Table 3.1: Sets in the MR-ETPA model ... 48
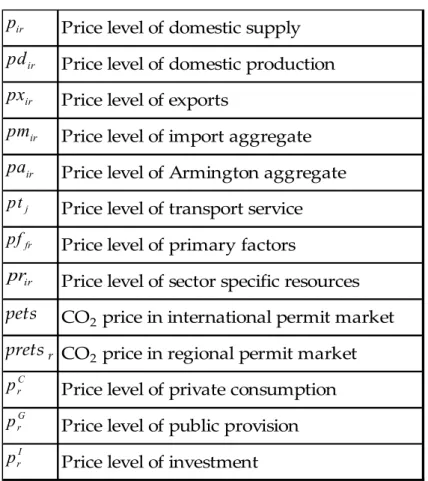
Table 3.2: Price variables in the MR-ETPA model... 49
Table 3.3: Quantity variables in the MR-ETPA model ... 49
Table 3.4: Tax parameters in the MR-ETPA model ... 50
Table 3.5: Cost share parameters in the MR-ETPA model ... 50
Table 3.6: Exogenous parameters in the MR-ETPA model... 51
Table 3.7: Constants of elasticity of substitution in the MR-ETPA model 51 Table 3.8: Ancillary variables ... 52
Table 4.1: List of sectors ... 61
Table 4.2: List of factors and regions ... 61
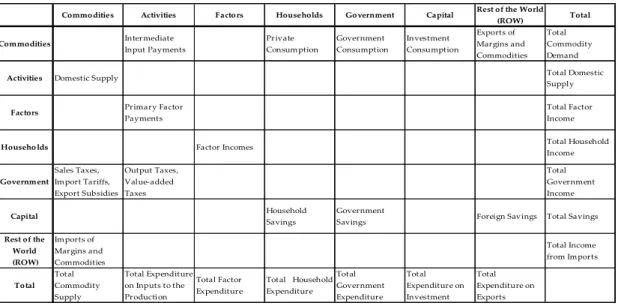
Table 4.3: Structure of the social accounting matrix ... 62
Table 4.4: Sets (indices) ... 65
x
Table 4.6: Sector outputs of the European Union ... 75
Table 4.7: Sector outputs of the rest of the world ... 78
Table 4.8: SAM of Turkey for year 2004 ... 81
Table 4.9: SAM of the European Union for year 2004 ... 81
Table 4.10: SAM of the Rest of the World for year 2004 ... 81
Table 5.1: Emission Reduction Requirements for the European Union ... 86
Table 5.2: Emission Reduction Requirements for Turkey ... 87
Table 5.3: Marginal abatement costs in the EU ... 89
Table 5.4: Real GDP under NOACT scenario ... 90
Table 5.5: Commodity trade volumes under NOACT scenario ... 92
Table 5.6: CO2 emission profile under NOACT scenario ... 94
Table 5.7: Marginal Abatement Costs in Turkey ... 95
Table 5.8: CO2 emission profile under NP_rETS scenario ... 96
Table 5.9: Real GDP under NP_rETS scenario ... 97
Table 5.10: Commodity trade volumes under NP_rETS scenario... 100
Table 5.11: CO2 emission profile under P_rETS scenario ... 103
Table 5.12: Real GDP under P_rETS scenario ... 105
Table 5.13: Comparison table for commodity exports ... 106
xi
Table 5.15: Comparison table for commodity imports ... 107
Table 5.16: CO2 emission profile under EU_ETS scenario ... 111
Table 5.17: Real GDP under EU_ETS scenario ... 113
Table 5.18: Comparison table for total economic activity ... 116
Table 5.19: Commodity trade volumes under EU_ETS scenario ... 117
Table 5.20: Sector outputs in Turkey ... 122
Table 5.21: Sector outputs in the European Union ... 123
Table 5.22: Commodity export volumes of Turkey ... 124
Table 5.23: Commodity import volumes of Turkey ... 125
Table 5.24: Carbon intensity, CO2 / GDP ... 126
Table A.1: Sets (indices) ... 139
Table A.2: Tax parameters ... 139
Table A.3: Data arrays in the GTAP 7 data file ... 140
Table B.1: Sector aggregations in the MR-ETPA model ... 141
Table B.2: Region aggregations in the MR-ETPA model ... 142
xii
LIST OF FIGURES
Figure 2.1: Turkey’s estimated TPES Balance ... 18
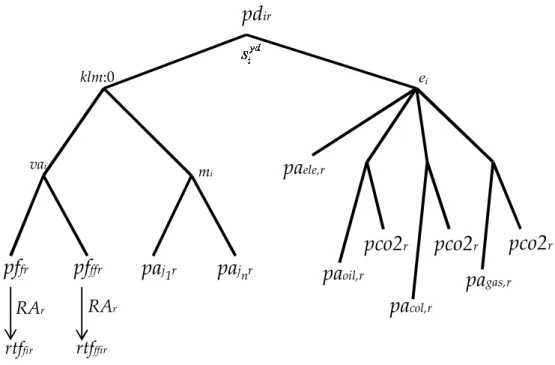
Figure 3.1: Production functions of non-extractive industries ... 37
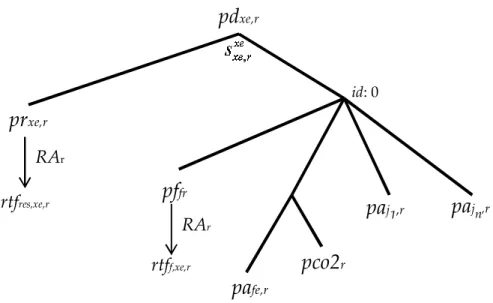
Figure 3.2: Production functions of extractive industries ... 38
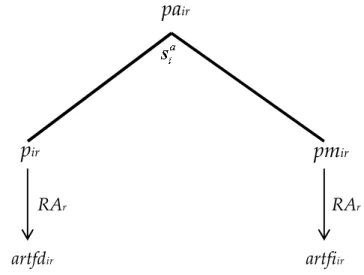
Figure 3.3: Nesting in Armington aggregation activity ... 39
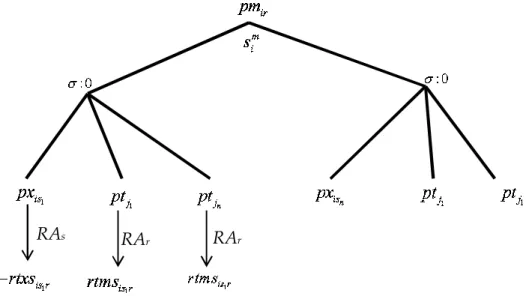
Figure 3.4: Nesting structure of import activity ... 40
Figure 3.5: CET transformation function ... 41
Figure 4.1: The distribution of CO2 emissions across sectors in Turkey .. 73
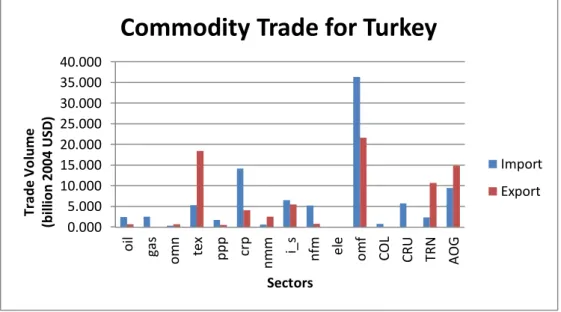
Figure 4.2: Commodity trade volumes of Turkey. ... 74
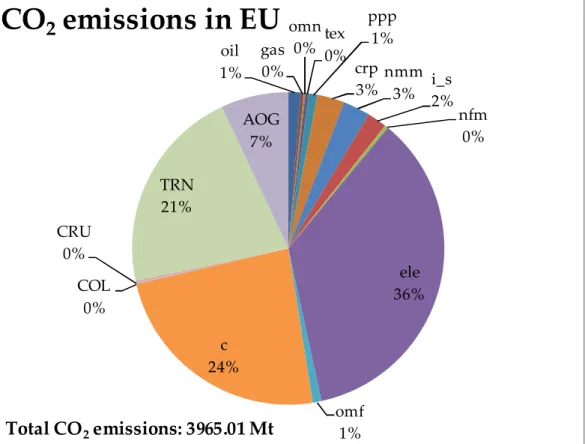
Figure 4.3: The distribution of CO2 emissions across sectors in the EU ... 76
Figure 4.4: Commodity trade volumes of the European Union. ... 77
Figure 4.5: The distribution of CO2 emissions across sectors in the ROW 79 Figure 4.6: Commodity trade volumes of the rest of the world. ... 80
Figure 5.1: Welfare costs of abatement strategies for the EU ... 90
xiii
Figure C.1: Import profile of Turkey from the European Union ... 143
Figure C.2: Import profile of Turkey from the Rest of the World ... 144
FigureC.3: Export profile of Turkey to the European Union ... 144
Figure C.4: Export profile of Turkey to the Rest of the World ... 145
Figure C.5: Import profile of the European Union from Turkey ... 145
Figure C.6: Import profile of the European Union from the Rest of the World ... 146
Figure C.7: Export profile of the European Union to Turkey ... 146
Figure C.8: Export profile of the European Union to the Rest of the World ... 147
Figure C.9: Import profile of the Rest of the World from Turkey ... 147
Figure C.10: Import profile of the Rest of the World from the European Union ... 148
Figure C.11: Export profile of the Rest of the World to Turkey ... 148
Figure C.12: Export profile of the Rest of the World to the European Union ... 149
1
CHAPTER 1
Introduction
This dissertation intends to study the economic impacts of market-based mitigation policy alternatives of Turkish economy in its efforts to stabilize greenhouse gas emissions in the post-Kyoto period. The potential alternatives studied are national emission trading scheme under various market structures and direct linking of national emission market with the European Union emission trading market (EU ETS), as part of the negotiations for the full membership to the European Union (EU).
This chapter continues with a brief introduction to the evolution of the need for studying these environmental policy issues and further outlines the structure of the dissertation.
The Kyoto Protocol is the first official attempt to stabilize greenhouse gas emissions. The Protocol enforces industrialized countries1 to reduce their emissions by 5.2% relative to 1990 levels over the period 2008-2012
1 These countries are known to be the Annex I countries and include EU-15 countries, Norway, Switzerland, Iceland, Canada, United States, Australia, Japan, New Zealand, Croatia, Russian Federation, Turkey, Ukraine, Belarus and Malta.
2
(UNFCCC 1998). Although some of the Annex I parties, i.e. Turkey2, United States, Belarus and Malta, have not ratified the Kyoto Protocol by the time it entered into force, it is so far the most comprehensive agreement for mitigation targets at international level.
While global mitigation efforts have sped up the turn-around in developing sustainable mitigation policies, emission trading has become the most widely used market-based instrument. As of 2011, emission trading schemes (ETSs) reach a total market value of $148,881 million (World Bank 2012). Among the operational ETS, the EU ETS is the largest scheme with the value of $147,848 million (World Bank 2012)3.
As the Kyoto Protocol expires by the end of 2012, the nations have been negotiating on the post-Kyoto (post-2012) mitigation targets since the 13th Conference of the Parties to the UNFCCC held in Bali in 2007. Ensuring the participation of both industrialized and developing nations to international mitigation efforts and cost effectiveness stay to be the biggest challenges in designing a future international mitigation action. In that regard, it is indispensible to have more widespread use of ETSs worldwide and direct linkages between these systems as they enhance the cost effectiveness and cooperation via burden sharing. The increasing number of existing and planned ETSs4 shows that linkage of these systems is to become a significant
2 Upon Turkey’s request for its “special circumstances” as a developing market economy, Turkey was granted its exception from international mitigation activities in the Kyoto period (UNFCCC 2001).
3 The other operational emission trading schemes are as follows: Norway, Iceland, Switzerland, New Zealand, Australia, Tokyo, the Regional Greenhouse Gas Initiative in the United States, Alberta, Canada.
4 In post-2012 period, in addition to the existing ETSs, China, India, Republic of Korea, Japan, Mexico and Brazil have also been planning to adopt national ETS.
3
aspect of post-Kyoto mitigation policies. From that point of view, the EU ETS serves as a unique model as it involves a diverse set of sovereign nations. Furthermore, Europe’s vision to link the EU ETS with other compatible ETSs worldwide in the post-2012 period carries the EU ETS beyond being just a model but constitutes it as a global prototype.
In the current conjuncture, Turkey has experienced rapid growth in its greenhouse gas emissions since 1990. As of 2009, the rate of increase in total emissions is 102% compared to the 1990 levels (IEA 2011a). As a member of OECD and a candidate country for the EU, sooner or later, Turkey will have to face the challenge of stabilizing its emissions while sustaining its carbon intense economic growth. With these incentives, Turkey has developed its national vision in mitigation policies and declared its environmental objectives in the National Climate Change Action Plan: 2011-2023 (Ministry of Environment and Urbanization 2011). The Action Plan strongly emphasizes the need for establishing the national ETS by 2015 and its integration with the international carbon markets. Meanwhile, the environment chapter in the EU enlargement process has opened, which urges Turkey to take necessary steps in order to comply with European Environmental Law, including the integration with the EU ETS.
Despite the incentives in the political ground, there are quite a few challenges that both Turkey and the European Union faces in formalizing their post-2012 strategies for market-based environmental regulation. The lack of adequate economic analysis also makes it even harder to resolve these challenges. In that regard, one of the main contributions of this dissertation to the environmental economics literature is that this study is unique in its novelty and scope to analyze the unilateral use of market-based instruments in Turkey as part of its contribution to the international mitigation efforts in the post-Kyoto period. Secondly, this study is also the
4
first to explore the environmental and economic impacts of linkage provisions of permit markets on both the EU and Turkey as part of the EU’s enlargement policies in post-2012 period.
Within that perspective, CHAPTER 2 starts with a brief introduction to the theory of market-based instruments. The evolution of European and Turkish economies in the Kyoto period are investigated. Post-2012 mitigation alternatives for both the EU and Turkey are given with a discussion on the relevant literature.
CHAPTER 3 continues with the modeling framework and algebraic structure of the Multi-Region Environmental and Trade Policy Analysis (MR-ETPA) model, which is the other contribution of this dissertation to the economic literature. The MR-ETPA model is a multi-country, multi-sector computable general equilibrium (CGE) model that I developed for various environmental and trade policy analysis. As its theoretical underpinnings, the model has Arrow-Debreu general equilibrium framework. The underlying optimization framework increases the model’s reliability and relevance for the policy analysis since the outcome of a policy simulation can be traced back to rational behavior. General equilibrium framework with multi-country setting further enhances the ability of the model in quantifying the direct and indirect economic costs of environmental policies. Direct costs arise as a result of internalizing environmental externalities. The associated indirect costs occur due to the feedback effects as a result of changes in international competitiveness and pre-existing market distortions. Unlike the classical emission trading models, in the MR-ETPA model, permit trading is not modeled via explicit analysis over marginal abatement cost (MAC) curves of the traders. Instead, MAC curves are formulated as functions of all price levels prevailing in both domestic and world markets and permit price is implicitly calculated as the point
5
where MACs are equalized across all emitters. This approach gives the MR-ETPA model the advantage to have a robust representation of permit trading markets over the classical emission trading models. Hence, the permit market outcomes, i.e., permit price, allocation of permits and aggregate costs of abatement are assured to be robust against changes in environmental and economic policies. Furthermore, with this approach, the MR-ETPA model is also capable of capturing the carbon leakage effects, which cannot be captured by the classical emission trading models.
The model calibration to a certain benchmark economy is discussed in CHAPTER 4. The discussion starts with a brief overview of the GTAP 7 data set and how it is aggregated and modified in order to make it compatible with the MR-ETPA model and the current policy questions. Finally, an overview on country profiles at benchmark economy is given.
CHAPTER 5 starts with the discussion on the need for choosing a potential target year for mitigation policies and setting up a Business-As-Usual scenario for each economy according to the target year. Following that, the forward calibration technique used for constructing the Business-As-Usual economies, i.e. future economies under no mitigation targets, is introduced. This chapter continues with the description of policy scenarios. The main attention in the design of policy scenarios is given to the overall mitigation target and to the structure of the permit trading market. CHAPTER 5 concludes with the discussion on the economic impacts of the simulated policy scenarios.
CHAPTER 6 concludes with the overall comments and discussion on the possible further research questions and, accordingly, on the necessary extensions of the MR-ETPA model. The supplementary materials for model calibration are given in appendices.
6
CHAPTER 2
Market-Based Environmental Regulation
2.1. Introduction
This chapter analyzes the use of market-based instruments in regulating carbon dioxide emissions5 with a special focus on the applications in the European Union and Turkey.
Section 2.2 provides a brief introduction to the theory of market-based instruments in their use for internalizing the environmental externalities. Two main categories are defined, i.e. price and quantity mechanisms. The potential advantages and disadvantages of these instruments are further discussed.
Section 2.3 analyzes the use of cap-and-trade system as a market-based instrument in the European Union. The development of the European Union Emission Trading System (EU ETS) is analyzed in two parts: in Kyoto world
5 Throughout this work, the general focus is on policies for curbing carbon dioxide emissions from fossil fuel use. Yet, the current context is also applicable to the regulation of other greenhouse gas emissions.
7
and in post-Kyoto world. The evolution of the European economy under carbon dioxide abatement is further analyzed with the statistics.
Section 2.4 starts with the overview of the evolution of Turkish economy under no mitigation targets in Kyoto world. Then, the alternative market-based instruments that Turkey is considering to apply as part of its national climate change strategy in post-Kyoto world are stated. With the help of the existing literature, the pros and cons of these instruments are discussed.
Section 2.5 talks about the longer term perspectives on the use of market-based regulations in the European Union and in Turkey. The theoretical discussions on the advantages and disadvantages of linking are given. The potential options for linking are discussed with the help of existing literature.
Section 2.6 briefly summarizes and explains how this work fits in the economic literature in search for the needs of current environmental policy agenda of the European Union and also Turkey.
2.2. Market-based Instruments
Market-based instruments are kind of policy instruments which are widely used in internalizing environmental externalities, i.e. CO2 emissions. Theoretically, these instruments work to equate marginal benefit out of an environmental policy and marginal cost (Baumol & Oates 1988).
It is common to compare the performances of these instruments in terms of cost and dynamic efficiencies and also environmental effectiveness. Cost efficiency is defined as the ability of the instrument to reach the environmental target at the lowest possible cost. In case of abatement policies, equalization of marginal abatement costs across
8
emitters assures cost efficiency (Perman et al. 1996). Environmental effectiveness is the ability of the instrument in meeting the target level of emissions. Dynamic efficiency is used as a measure for the spillover effects, such as technological change and economic development.
Market-based instruments can be classified into two broad categories: price instruments and quantity instruments. A price mechanism is basically to impose a Pigouvian tax on the source of the negative externality (Pigou 1960). In the context of CO2 emissions, this translates into a carbon tax which charges CO2 emitters a fixed fee for every ton of CO2 emitted. This fee can either be levied directly on fossil fuel producers or on fossil fuel consumers. Price mechanisms give different incentives to each emitter. The ones who cannot reduce emissions at a lower cost than the fixed fee are better off paying the charge for every ton of emission they create. On the other hand, emitters who can reduce emissions at a cost lower than the fixed fee are better of reducing their emissions. In that regard, price mechanisms are cost-effective as the total abatement is guaranteed to be taken at the lowest possible cost.
A quantity mechanism works on the basis of tradable permits and usually referred to as a permit or a cap-and-trade system (Dales 1968). The rationale underlying cap-and-trade systems is that lack of well defined property rights causes externalities (Coase 1960). Thus, property rights of emitters are clearly defined simply by allocating permits, i.e. rights to emit, to each emitter. In a cap-and-trade system, total number of permits is limited by CO2 quotas and emitters are obliged to hold a permit for each ton of CO2 they emit. Just like the price mechanism, the requirement to hold permits can be imposed either on the users of fossil fuels or on the producers of fossil fuels. In case of CO2 emissions, it is common to require fuel producers to hold permits, since CO2 emissions can be accurately calculated from the total volume of fossil
9
fuels used. The basic advantage of quantity mechanism over price mechanism is that in a cap-and-trade system emitters are also allowed to buy and sell permits in order to get the lowest abatement cost option for them. In the market place, the emitters that have cheaper mitigation options, i.e. low marginal abatement costs, will prefer to do so and sell the excess permits. Similarly, the emitters with high marginal cost of abatement will have the incentive not to mitigate but instead to buy permits in the market. Hence, total emissions will exactly match the total quota while assuring the cost-effectiveness.
When the marginal abatement costs are correctly estimated and not subject to any uncertainty, price and quantity mechanisms lead to the same cost efficient outcome (Montgomery 1972). A price mechanism leads to the cost efficient outcome by adjusting for the total level of emissions while keeping the price level fixed. A quantity mechanism leads to the cost efficient outcome by adjusting for the permit price while holding the emission levels constant. Hence, under certainty, both instruments can be used in exchange. Furthermore, Pezzey (1992) and Farrow (1995) proves the equivalence between an emission trading scheme, with auctioned permits, and levying a carbon tax at the auction price. Thus, the permit price is equal to the carbon tax under the same pollution target. However, under a given target level of pollution, carbon tax requires the aggregate marginal abatement cost curves to be determined beforehand in order to impose the correct tax rate. Thus, cap-and-trade systems have their major advantages in having control over total emissions without need for direct information regarding the marginal abatement cost structure at the aggregate level (Cropper & Oates 1992).
In case of any uncertainty, the choice of the instrument should depend on the tradeoff between marginal benefits and costs. That is to say, if the damage increases severely with the level of pollution while the change in
10
abatement cost stays relatively more stable than that, then quantity mechanism should be preferred not to suffer too much from pollution. On the contrary, if the marginal damage changes slowly but the marginal cost increases severely, then it should be preferable to use price mechanisms not to risk high levels of mitigation cost for low levels of environmental benefits. Hence, as Jacoby and Ellerman (2002) states, the key element in choosing the appropriate instrument is the difference in how rapidly costs and benefits adjust when level of emission control changes.
The use of tradable permits raises the question of how to allocate permits to the emitters. In that regard, there exist two possibilities, which have been used so far: grandfathering, i.e. allocating permits for free based on historic emission levels and auctioning permits. For the sake of political acceptance of market-based instruments, grandfathering is seen as an advantage especially at the beginning (Tietenberg 2006). While it is shown that the initial allocation of permits does not affect the final allocation, auctioning has been the main choice of preference. Montgomery (1972) and Cramton and Kerr (2002) state the possible reasons to prefer auctioning over grandfathering as increased flexibility in distribution of abatement costs and also providing more incentives for innovation. Thinking in terms of the functioning of market, it should also be noted that auctioning improves the liquidity in the market as signaling a price level at the beginning of trading.
2.3. Market-based Regulation in the European Union
2.3.1. Kyoto world
The Kyoto Protocol set binding emission targets for the EU 15 countries for the period 2008 and 2012. The overall EU emission target is stated as a
11
reduction of 8% compared to the emission level in 1990. Consequently, the EU member countries agreed on a burden-sharing arrangement, distributing the overall emission target to the member states (European Commission 2002). In meeting their mitigation targets, the European Union member countries have started to use cap-and-trade systems extensively. The European Union Emission Trading System (EU ETS) has become the largest cap-and-trade system in the world, which is used to regulate CO2 emissions.
The EU ETS started with a learning phase (Phase I), which covered the period between 2005 and 2007. The system is now in its second phase of trading (Phase II) between 2008 and 2012, which is designed to coincide with the first commitment phase of the Kyoto Protocol.
Phase I was implemented mainly to gain some experience and also to establish the necessary infrastructure for permit trading. Due to over allocation of allowances, permit prices in this first trading period converged to zero. The prices in the second “Kyoto” period have been relatively more stable. The allowances were traded at EUR 25 per ton for much of 2008, and in a range between EUR 13 per ton and EUR 16 per ton in the period between 2009 and 2011 (World Bank 2012). The amount of allowances traded in the EU ETS has been steadily increasing since 2005. In 2010, the amount is recorded as 6789 MtCO2eq of allowances at a market value of $134 billion. In 2011, the number of traded allowances increases to 7853 MtCO2eq with a market value of $148 billion (World Bank 2012).
The EU ETS regulates emissions from downstream entities. Thus, the liable entities to hold allowances in equal amounts to their emissions are defined to be the final users of dirty inputs, rather than the producers of dirty inputs. The emitters covered by the EU ETS are electricity generators,
12
oil refineries, coke ovens, ferrous metal production, steel industry, pulp and paper production, as well as cement production. Phase I and Phase II trading covered only CO2 emissions from ETS sectors, which amount to 45% of total CO2 emissions in the EU (IEA 2011a).
In Phase I, 95% of total allowances were allocated for free to the liable entities. In the second phase, the ratio of grandfathered allowances has decreased to 90%.
In order to reduce the compliance costs for participants, the EU Linking Directive (European Commission 2004) also allows offsets from credit systems to be used in the EU ETS market. These credit systems are defined to be the ones established by the Kyoto Protocol, i.e. Clean Development Mechanism (CDM) and Joint Implementation (JI).
Table 2.1: Key indicators of the European Union
EU 1990 1995 2000 2005 2007 2008 2009 %change 90-09 CO2 (Mt of CO2) 4051.9 3847.5 3831.2 3978.9 3941.9 3868.2 3576.8 -11.7% TPES (Mtoe) 1348.5 1406.2 1487 1565.2 1538.6 1536.4 1459.1 8.2% GDP PPP (billion 2000 USD) 8556.4 9163.0 10591.8 11667.3 12445.5 12537.9 12007.6 40.2% Population (millions) 472.9 478.7 482.9 492.1 496.4 498.7 500.4 5.8% CO2/TPES (t CO2 per TJ) 59.1 56.1 54.3 53.4 53.6 52.8 51.6 -12.8% CO2/GDP PPP
(kg CO2 per 2000 USD) 0.47 0.42 0.36 0.34 0.32 0.31 0.3 -37.0% CO2/population
(t CO2 per capita) 8.57 8.04 7.93 8.09 7.94 7.76 7.15 -16.6% Source: IEA (2011a)
Table 2.1 gives changes in some of the EU’s key environmental indicators. As of 2009, total CO2 emissions of the EU decreases to 3576.8 Mt of CO2. This decrease is quantified as 11.7% compared to the CO2 emission level in 1990.
13
It is worth noting that this reduction amount is already under the level set by the Kyoto Protocol.
Within the period between 1990 and 2009, the GDP increases 40.2% from $8566.4 billion to $12007.6 billion. As the data reveals, there is a severe decline in GDP during 2009, which is due to the European Economic Crisis. Hence, some of the decline in CO2 emission level is also dependent on this negative scale effects. However, it is still a statistical fact that the EU has managed to decrease its level of emissions while having a certain level of economic growth. In the current context, this occurrence can be due to two main reasons. One is the increase in the ability to transform the carbon dependent economy to a greener economy. The other one is the ability to recycle the revenues from cap-and-trade systems in a way fostering economic growth in the long run. It is clear in Table 2.1 that some of the decrease in the overall CO2 emission level is attributed to the decrease in CO2 intensity of the EU’s total primary energy supply (TPES). As renewable energy, i.e. hydro, solar, wind, bio-fuels and waste, has become more commonly used in the EU, the CO2/TPES ratio has also steadily declined from 59.1 tCO2 per TJ to 51.6 tCO2 per TJ. CO2 intensity of GDP also reveals this fact with a decline of 37% as of 2009, compared to the level in 1990. Thus, it is clear that the EU has managed to transform its economy to a greener economy in comparison to the past years. Taking into account the wide use of grandfathering during Phase I and II, much of the decrease in CO2 intensity of the European economy should be attributed to the increasing use of renewable energy in total energy supply.
2.3.2. Post-Kyoto world
The EU has already committed itself to its post-Kyoto targets, the EU 20-20-20 targets. The European Council has agreed upon a 20% share of
14
renewable energy sources in final energy consumption, 20% increase in energy efficiency and 20% decrease in its greenhouse gas emissions, compared to their 1990 levels, by 2020. In case of a comprehensive international agreement, the EU further confirmed its commitment to moving to a 30% reduction in its greenhouse gas emissions (European Commission 2008).
The EU ETS, which is the cornerstone of the EU climate policy in curbing emissions, will enter its third phase (Phase III) from 2013 to 2020. According to the revision in the legislation, there will be some major changes in the third phase compared to the first and second trading periods. Firstly, auctioning will start to be used more extensively in the third period. Free allocation of allowances will gradually decline to 80% in 2013 and to 30% in 2020. Full auctioning is supposed to be applied by 2027. Secondly, the EU ETS will start to cover all greenhouse gases from 2013 onwards, while it has covered only CO2 emissions in Phase I and II. Lastly, aviation and aluminum sectors will also be included in the EU ETS.
For the post-Kyoto period, the EU’s climate policy undergoes highly significant changes in comparison with the past years. While the EU ETS market is kept as the central pillar in curbing emissions, the necessity of supporting that with certain levels of technological change is also included in the climate policy objectives. This kind of a policy structure can have different economic implications in the short run and in the long run. Within this framework, the EU backs the segmented market structure in permit trading and aims to use additional policy instruments to complement with the EU ETS, i.e. promotion of renewable energy use and increasing energy efficiency. Hence, potential side effects exist in the form of efficiency losses and excess abatement costs due to using different policy tools for the same environmental target. Tietenberg (2006) points out that potential loss in cost
15
effectiveness are likely to occur in case of any market segmentation. In addition to that, Tinbergen (1952) and Johnstone (2003) argue that using a mix of different policy instruments in achieving a total emission target can be redundant, at the worst case, leads to high levels of cost burden. Bohringer et al. (2009a) and Bohringer et al. (2009b) show in their comparative statics analysis within a general equilibrium framework that the use of second-best policies in achieving the EU 20-20-20 targets lead to considerable increase in cost compared to the comprehensive trading case. It is shown that two separate cap-and-trade systems EU wide, one for ETS sectors and one for non ETS sectors, increase compliance costs by 50%. Market structure with one ETS market and 27 separate non ETS markets in each member state increases the compliance costs by another 40%. The binding quota on the use of renewable energy also increases the compliance costs by around 90%. It should be noted that in these studies, the technical change and its potential effects in emissions in the long run are not taken into account while quantifying the costs of compliance. Hence, the validity of the results only holds for the short run.
2.4. Market-based Regulation in Turkey
2.4.1. Kyoto world
When the UNFCCC was adopted in 1992, Turkey was initially included among Annex I and II countries. However, at the 7th Conference of Parties held in Marrakech in 2001, the UNFCCC parties agreed to the removal of Turkey from the Annex II list, upon Turkey’s request. Although listed in the Convention’s Annex I, since Turkey was not Party to the Convention when the Kyoto Protocol was adopted, Turkey was not in the Protocol’s Annex B list. Therefore, while the Protocol set binding emission targets for Annex B countries during the period between 2008 and 2012, Turkey has not had any
16
official emission reduction targets. Due to the lack of incentives for curbing emissions, Turkey has not made use of any of market-based instruments during the first commitment period of the Protocol.
Table 2.2 summarizes how the Turkish economy evolved in the period over 1990 and 2009. Turkey’s GDP has shown a steady increase except for the year 2009 where the contraction in the economy was due to the global recession of the late 2000s. The rate of increase in GDP between 1990 and 2009 is recorded as 92%. Following this considerable rise in GDP level, Turkey has also experienced a rapid increase in its total primary energy supply. The increase in TPES is reported as 85.1% between the years 1990 and 2009.
Table 2.2: Key indicators of Turkey
1990 1995 2000 2005 2007 2008 2009 %change 90-09 CO2 (Mt of CO2) 126.91 152.66 200.56 216.36 265 263.53 256.31 102.00% TPES (Mtoe) 52.76 61.55 76.35 84.38 100.01 98.5 97.66 85.10% GDP PPP (billion 2000 USD) 411.06 481.43 589.24 736.17 823.66 829.09 789.08 92% Population (millions) 55.12 59.76 64.26 68.58 70.26 71.08 71.9 30.40% CO2/TPES (t CO2 per TJ) 57.5 59.2 62.7 61.2 63.3 63.9 62.7 9.10% CO2/GDP PPP
(kg CO2 per 2000 USD) 0.31 0.32 0.34 0.29 0.32 0.32 0.32 5.20% CO2/population
(t CO2 per capita) 2.3 2.55 3.12 3.15 3.77 3.71 3.57 54.80%
Source: IEA (2011a)
As it is seen in Figure 2.1, total primary energy supply of Turkey highly depends on coal and peat with 32%, on natural gas with 30% and on crude oil and oil products with 27%. The figure gives the estimated balance in TPES for year 2010. Although Turkey’s energy supply policy has been changed in favor of natural gas in the late 1980s and the share of natural gas
17
in TPES has been rising steadily since then, the composition of TPES has been more stable starting with 2005. The share of renewable resources in TPES stays fairly low at 4% for hydro, 5% for bio-fuels and 2% for geothermal and solar resources. As coal, peat, oil and natural gas are energy sources which are rich in carbon contents, it is not surprising to see the highly significant rise in Turkey’s CO2 emissions between the period 1990 and 2009. Turkey’s CO2 emissions increase from 126.91 Mt CO2 in 1990 to 256.31 Mt CO2 in 2009, corresponding to a rise of 102%. Within the same period of time, the increase in CO2 emissions of OECD countries is 8%, while the European Union experiences a decline in total emission level at rate 11.7%.
In their quantitative studies, Lise (2006), Tunc et al. (2009) and Kumbaroglu (2011) try to unfold the effects underlying the increase in CO2 emissions of Turkey. The potential effects are assumed to be scale effect, i.e. change in emissions due to changing activity levels, composition effect, i.e. change in emissions due to changes in the composition of sectors, energy-intensity effect, i.e. change in emissions due to changes in the efficiencies of the energy processes and conversion technologies and carbon-intensity effect, i.e. change in emissions due to fuel substitution. As a result, it is seen that the largest portion of the increase in CO2 emissions is mainly due to the expansion of the economy (scale effect), which is further accompanied by the composition effect. Taking into account this fact, Telli et al. (2008) predicts that the increase in total CO2 emissions by 2020 will be 99% compared to the 2009 levels.
18
Figure 2.1: Turkey’s estimated TPES Balance
Source: IEA and OECD (2011)
By 2009, with per capita CO2 emissions of 3.57 tones, Turkey lies below the OECD average of 9.83 tones and also the EU-27 average of 7.15 tones. However, it is crucial to note the difference in the movements of per capita CO2 emissions. While Turkey has been experiencing 54.8% growth in its per capita CO2 emissions between 1990 and 2009, OECD and the EU 27 countries experience severe declines in their per capita CO2 emissions, which are quantified around 6.2% and 16.6%, respectively.
Turkey’s CO2 emissions per US$ GDP realizes as 0.32 for the year 2009, which is slightly below the OECD average of 0.38, however, higher than the EU-27 ratio of 0.30. This seems to be the constant trend since 2005. Just like the trends seen in per capita CO2 emissions, between 1990 and 2009, CO2 emissions per US$ GDP also shows an increase around 5.2% in Turkey, and a decrease in both OECD and the EU 27 countries, around 28.2% and 37%, respectively.
The differences in the above findings are mainly due to the differences in energy policies that regions pursue. It is clear that while Turkey is
32%
19% 8%
30%
4% 2% 5% 0%
Estimated TPES Balance for 2010
(Mtoe)
Coal & Peat Crude Oil Oil Products Natural Gas Hydro
Geothermal & Solar Biofuels & Waste Electricity
19
experiencing emission intensive growth, due to its energy policies, OECD and the EU-27 countries, on average, pursue energy policies that are more reliant on less emission intensive inputs. This fact is also clearly reflected in the CO2/TPES ratios, in which the change between 1990 and 2009 is quantified as 9.1% for Turkey, -6.8% for OECD countries and -12.8% for the EU-27 countries.
IMF (2012) projects the annual growth rate of Turkish economy for the period between 2012 and 2017 as 3.7% on average, while IEA (2011b) projects it as 4.0% on average. Taking into account Turkey’s energy supply policies, in the long run, it is inevitable that Turkey will face rapid increase in its CO2 emissions in a way closing the gap in terms of CO2 emissions per capita and per US$ GDP with both OECD and the EU-27 countries.
2.4.2. Post-Kyoto world
As an EU candidate country and an OECD member country, Turkey has been under pressure to formalize its national action plan against curbing its CO2 emissions in the post-Kyoto period. In the latest progress report of European Commission, the need for a well defined emission reduction target and also the need for cooperation with the EU in emission trading is emphasized (European Commission 2011). In line with the European Commission’s report, the OECD Environmental Performance Review for Turkey, reports that Turkey should take an action against its increasing CO2 emissions and that Turkey should consider the use of market-based instruments like pollution charges and emission trading systems to meet its objectives of efficiency and financing (OECD 2008).
The ministry of environment and urbanization (MEU) delivered Turkey’s national vision within the scope of climate change in the National Climate
20
Change Action Plan: 2011 – 2023 (Ministry of Environment and Urbanization 2011). Within this document, Turkey’s objectives are stated as becoming a country fully integrating climate change related objectives into its development policies, improving energy efficiency, increasing the use of renewable energy sources and decreasing its emissions. In managing CO2 emissions, the Action Plan strongly emphasizes the establishment of national emission trading system in Turkey by 2015 and further integration with the existing and new global and regional carbon markets. In that regard, State Planning Organization (SPO) delivered Istanbul Finance Strategy and Action Plan, which defines the prospective national carbon market to be established in Turkey (DPT 2009). To make more emphasis on the dedication of Turkey, it is also crucial to note the initial grant of $350,000 to Turkey by World Bank’s Partnership for Market Readiness for developing and piloting of market-based instruments for greenhouse gas reduction (World Bank 2011).
Meanwhile, the environment chapter in the EU enlargement process has also opened. This chapter necessitates that the EU Emission Trading Directive (European Commission 2003) is to be transposed into Turkish Environmental Law as part of the legislation. Therefore, Turkey is eventually expected to integrate with the EU ETS market along its accession process to join the EU. As being world’s largest international carbon market, the EU ETS stands as a very good example for Turkey in establishing its national permit market and a potential partner for international carbon trading.
In case of Turkey, while the lack of clear-cut emission targets results in a scarcity of quantitative studies, the lack of adequate economic analysis makes it even harder to formalize well defined emission targets and a probable design of such a cap-and-trade system. (Sahin 2004) is the first quantitative modeling paradigm to quantify the economic impacts of a regional cap-and-trade system and to compare and contrast the findings
21
with the applications of energy taxes. The model is set up as a static, single country general equilibrium model. The tradable emission permits, which are grandfathered, are added to the model following the primal approach defined in (McKibbin & Wilcoxen 1999). The model takes 1990 as the benchmark year. As a result of the policy simulations, it is seen that imposition of environmental measure in Turkey does not lead to a drastic deterioration of the economic performance and tradable permit system gives similar results with energy taxes in terms of economic efficiency. Sahin and Pratlong (2003) evaluate the proper regulation in a possible cap-and-trade system within the same general equilibrium set up in (Sahin 2004). In that regard, upstream, downstream and hybrid approaches, which are used in determining the liable entities under a tradable permit system, are tested. Main finding is that upstream approach is more efficient both economically and environmentally; while downstream approach offers greater flexibility. In a more recent study by Aydin and Acar (2010), the economic effects of the EU’s post-Kyoto mitigation policies under the case of Turkey’s accession to the EU are explored in a general equilibrium framework. In this study, the EU applies 20% emission cutback with regard to 1990 levels and Turkey is assumed to increase its CO2 emissions by 10% compared to 2010 levels. While the scenarios are run under the assumptions of capital and labor mobility, there exist two separate cap-and-trade systems in the model, i.e. one in Turkey and one in the EU. In that regard, the segmented cap-and-trade system6 that the EU is planning to run in the post-Kyoto period is not fit accurately into the model formulation. Additionally, the integration between Turkey’s national permit markets with the EU ETS market, which
22
will take place in case of the EU enlargement, is also not covered accurately in the scenarios.
2.5. Longer Term Perspective on Market-based Regulations
2.5.1. Linking regional cap-and-trade systems
The literature on cap-and-trade systems has developed extensively since trading systems started to be used as one of the flexibility mechanisms with the Kyoto Protocol (Tietenberg et al. 1999). As the need for collective action against rising CO2 emissions grows, the part of this literature assessing the economic and environmental effects of linking different cap-and-trade systems also develops.
Linking of emission trading schemes, in order to approach to a global carbon market, can be achieved via different ways. The first best policy is defined to be the top-down approach, i.e. imposing emission targets for all regions by an international agreement and allowing these regions to trade in a global carbon market. The second best policy is defined as establishing two way direct links between regional cap-and-trade systems (Browne 2004; Aldy & Stavins 2007a). The Kyoto Protocol and the conference of parties succeeding that have repeatedly failed to apply the top-down approach. Hence, bottom-up approaches started to be discussed extensively.
Efficiency gains out of linking different emission trading schemes can be classified as static and dynamic efficiency gains. Flachsland et al. (2009) defines dynamic efficiency as increased international cooperation in the long run stimulated by increased bilateral cooperation. In addition to that, direct linking of cap-and-trade schemes results in price equalization across the linked schemes resulting in reduced aggregate abatement costs compared to ex ante abatement costs (Haites 2001; Blyth & Bosi 2003). The proper
23
functioning of the carbon market due to increased liquidity and decreased price volatility should also be counted as part of the static efficiency gains out of direct linking (Baron & Bygrave 2002).
In opposed to its gains, linking may also lead to some efficiency losses due to strategic behaviors. Helm (2003) argues that allowance trading can give incentives for permit exporters in order to gain more from permit sales by simply decreasing their caps. On the other hand, Carbone et al. (2009) points out that, in case of an expectation for increase in allowance prices, there can also be an incentive for permit exporters to increase their caps to raise revenues from allowance sales.
Besides its direct effects on the permit markets, linking provisions can also have some indirect effects on the overall performance of the economies, i.e. aggregate economic activity level, sectors, employment, factor prices and technologies. As a response to the changes in the volume of the permit market and also in the permit price level, the distribution among permit sellers and buyers arranges accordingly. The degree of ability to substitute between dirty inputs, i.e. fossil fuel inputs and also the energy intensity of production technologies determines the shifts in the regional abatement activities. Thus, the profiles of buyers and sellers in the market may change. Following that, the production levels and input compositions of sectors are also affected. Hence, as a result of linking provisions, the total economic activity also changes. In addition, shifts in abatement activities may induce other benefits in the form of reduced fossil fuel dependence and incentives for transforming economies into low-carbon economies (Westskog 2002).
24
2.5.2. Linking options for the EU ETS
The European Union strongly encourages to establish direct links between the EU ETS and the other cap-and-trade systems for the post-Kyoto period (European Commission 2009). Articles 40 and 41 approve the cooperation with the third countries neighboring the EU, together with candidate and potential candidate countries. In essence, the EU considers the EU ETS to become the nucleus of an international carbon market (European Commission 2006; Aldy & Stavins 2007b). Two important features are noted by Ellerman and Joskow (2008), which make the EU ETS eligible for a global prototype: the weak federal structure with member states having certain degree of autonomy and the differences in economic and institutional development among the EU member states.
Despite the overall cost effectiveness of bottom up linking between cap-and-trade systems, it is not straightforward to conclude that linking is always economically and environmentally efficient for both parties. In their theoretical study, Eyckmans and Hagem (2011) show that the EU countries can benefit from the bottom up linking of regional cap-and-trade systems in case of certain trade agreements. They test their hypothesis in the numerical simulation between the EU and China for the year 2015. They find that under trade agreements involving permit sales requirements and certain levels of financial transfers, linking cuts the EU’s total compliance cost considerably. In another study, Anger (2008) states that there are strong signs to link the EU ETS with the newly emerging permit markets in non-EU countries by 2020. Thus, he studies bottom up linking of the EU-ETS with these newly emerging market schemes beyond Europe, i.e. Japan, Canada, the US and the OECD Pacific countries. Based on the numerical multi-country, multi-sector partial equilibrium model of the world carbon market,
25
he finds that linking the EU-ETS with the emerging permit markets induces minor economic benefits for the EU. However, the economic impacts for non-EU countries can be various depending on the domestic inefficiencies. Thus, it is seen that the costs and benefits from linking highly depend on the characteristics of the linking regions. In order to accurately assess the economic impacts of linking, it is indispensible to conduct region specific theoretical and numerical analysis.
2.6. Concluding Comments
Cap-and-trade systems have been widely used since the Kyoto Protocol. The need for an international cooperation in worldwide mitigation efforts sped up the use of permit trading schemes. Though, a global carbon market seems still not applicable. Instead, as a second best policy, the linking between different cap-and-trade systems has started to be seen as an alternative to a global carbon market. As a result, the regional abatement strategies are not limited to regional permit trading anymore. Countries have also been following the policies for integrating into existing or newly formed permit markets worldwide.
From that point of view, the EU ETS market, which is the largest permit trading market operating in the world, is defined to be the nucleus of a potential international carbon market. The European Union has already declared its commitment by integrating with national permit systems of Norway, Iceland and Liechtenstein in 2008. In that regard, the EU enlargement process is also seen as an opportunity for increasing international cooperation in permit trading. Taking into account these, Turkey seems to be one of the most likely candidate countries to integrate with the EU ETS market as part of its EU accession process. However, Turkey is at the onset of establishing its national permit market and linking
26
with the EU ETS should follow as the next step. Hence, the essentials of both Turkish national permit systems and also of its integration with the EU ETS have to be analyzed and set carefully.
27
CHAPTER 3
Analysis of Market-based Environmental Regulation in General
Equilibrium Framework
3.1. Introduction
This chapter introduces the MR-ETPA (multi-region environmental and trade policy analysis) model, which is a multi-region, multi-sector computable general equilibrium (CGE) model. I develop the MR-ETPA model mainly for simulating market-based environmental policies, the so-called permit trading together with various trade policy interventions.
Regarding the design of permit trading schemes, I give the main focus on the market segmentation and alternative ways of burden sharing worldwide via permit trading. Hence, the MR-ETPA model is capable of having permit trading markets both at national and international levels. National permit markets are able to integrate with the international permit markets. With respect to the market segmentation, the MR-ETPA model allows the sector coverage of CO2 abatement policies to differ across regions.
Within the current set up of the MR-ETPA model, I also model other commonly used economic incentives for CO2 abatement, namely CO2 taxes.
28
The explicit treatment of trade linkages between regions further allows for modeling additional measures used in climate mitigation actions, such as CO2 border tariffs.
The detailed elaboration of the underlying economic dynamics of the MR-ETPA model is given in Section 3.2. The methodology that I use in the characterization of the economic equilibrium and in the characterization of consumption and production behaviors are explained in Section 3.3. In Section 3.4, I further provide the details regarding the numeric implementation of the MR-ETPA model. Sections 3.5 and 3.6 have the set definitions, parameters, endogenous, exogenous and ancillary variables that I use in the algebraic and numerical formulation of the MR-ETPA model. I elaborate on the linkages between the theoretical underpinnings of the model structure and its characterization in Sections 3.7 and 3.8.
3.2. Model Description
The MR-ETPA model is a static CGE model of commodity and permit trading in multi-country and multi-sector setting. Market-based abatement policies incur additional costs to certain sectors in the economies, which often differ across regions. Hence, due to the changes in relative prices, both abating and also non-abating regions are subject to certain economic costs in terms of output and deterioration of international competitiveness. Hence, analyzing the economic impacts of market-based abatement policies in a partial equilibrium setting and neglecting the likely general equilibrium effects is definitely misleading in terms of quantifying the associated costs and specifying the underlying dynamics. In order to grasp the potential general equilibrium effects, I formulate the MR-ETPA model based on the Arrow-Debreu general equilibrium framework. The assumption of underlying optimizing behavior of all agents further enhances the relevance
29
of the MR-ETPA model for policy analysis, as the outcome of any policy intervention can be traced back to rational behavior. For the sake of the current policy agenda, I prefer to use general equilibrium framework in multi-country and multi-sector setting. This kind of treatment gives the MR-ETPA model the ability to analyze the abatement policy options that the real world economies currently face in a more realistic way. Due to the increase in size and complexity of the MR-ETPA model, in terms of the number of production sectors, pre-existing taxes and externalities, I use computable general equilibrium format. The CGE formulation is useful in quantifying the magnitude, and thus not only the sign, of the impact of changes in exogenous conditions on key economic variables. Therefore, it becomes tractable with the MR-ETPA model to identify and quantify the general equilibrium effects of changes in exogenous conditions that initially are not obvious.
In the algebraic formulation of the MR-ETPA model, all markets are perfectly competitive, that is to say, all agents are price takers. There is one representative agent in each economy who owns the primary factors of production, i.e. capital, labor and resources. Labor and capital are assumed to be mobile across sectors within regions but internationally immobile. Resource inputs are sector-specific inputs. All production factors are supplied inelastically in the factor markets. Each production sector takes primary inputs and produces only one commodity output according to certain production technologies. Products are either consumed in the domestic market or exported. The model also has separate government and investment accounts. Though, in the algebraic exposition of the model, these accounts do not have separate economic agents. Instead, representative agent in each economy is taken as the respective agent who is also responsible for government consumption and investment activities.
30
Demands for investment and public provision are exogenously fixed at benchmark levels. Tax revenues add up to the income of the representative agent. Each regional economy is open to trade with the other regions and trade balances are fixed exogenously.
The underlying reason for using the macro closures combining fixed foreign savings, fixed real investment and fixed real public consumption is mainly to be able to explore the pure welfare effects in equilibrium of alternative policies in a static framework (Johansen 1960). Such a closure rule minimizes the biased welfare effects that would otherwise occur with endogenous foreign savings and real investment in the later periods, which is not possible to account for in a static model. In addition to that, since the model does not capture the direct effects of public provision on household’s welfare, it is also preferred to use government consumption as fixed exogenously.
In order to include permit trading market, the static trade model is further expanded with integrating emission creation mechanism and giving incentives to trade permits. In the MR-ETPA model, permit trading is only allowed for CO2 permits; other greenhouse gases are not included in the permit trading. To establish CO2 permit trading market, permit demand side is specified as production and consumption units which are potential users of energy goods that cause CO2 emissions. The permit supply side is defined as governmental unit which is obliged to supply allowances to the CO2 emitters.
In each economy, CO2 emissions are created by use of fossil fuels, i.e. coal, oil and natural gas. The CO2 emitters which are required to hold allowances in equal amounts to their total emissions, can be either “upstream”, i.e. suppliers of dirty inputs, or “downstream”, i.e. users of dirty inputs. In