COMPARISON OF THE THEORY OF CONSTRAINTS WITH
THE TRADITIONAL COST ACCOUNTING METHODS IN
RESPECT TO PRODUCT MIX DECISIONS
ÜRÜN KARMASI KARARLARI AÇISINDAN GELENEKSEL MALİYET MUHASEBESİ YÖNTEMLERİ İLE KISITLAR TEORİSİNİN
KARŞILAŞTIRILMASI
Burcu Demirel UTKU
(1), Emre CENGİZ
(2), Ayten ERSOY
(3) (1, 3)Akdeniz Üniversitesi, İktisadi ve İdari Bilimler Fakültesi, İşletme Bölümü(2)Akdeniz Üniversitesi, Alanya Meslek Yüksekokulu
(1)[email protected], (2)[email protected], (3)[email protected]
ABSTRACT: This study examines the importance of the theory of constraints
compared to the conventional cost accounting in making adequate product mix decisions. To this end, an application in a chemistry enterprise was executed to determine product mix decisions and their effect on profitability by comparing the theory of constraints variable costing method with the full costing method in respect to the throughput approach, the contribution margin approach and the unit profit approach respectively.
Keywords: Theory of Constraints; Throughput Accounting; Traditional Cost
Accounting; Product Mix Decisions.
JEL Classifications: D24; L65; M41
ÖZET: Bu çalışma, en uygun ürün karması kararlarının alımında geleneksel
muhasebe sistemine kıyasla kısıtlar teorisinin önemini sergilemektedir. Bu amaçla, ürün karması kararlarının belirlenmesinde bir kimya işletmesinde uygulama yapılmış ve bu ürün karması kararlarının karlılığı nasıl etkilediği; kısıtlar teorisinin süreç katkı muhasebesi yaklaşımının, değişken maliyet yönteminin katkı payı ile tam maliyet yönteminin birim kar yaklaşımlarıyla karşılaştırılması yöntemi ile detaylı bir şekilde incelenmiştir.
Anahtar Kelimeler: Kısıtlar Teorisi; Süreç Katkı Muhasebesi; Geleneksel Maliyet
Muhasebesi; Ürün Karması Kararları.
1. Introduction
The theory of constraints – (TOC from now on) was developed by Dr. Eliyahu Goldratt in the light of the “Optimized Production Timetables” in the mid-1980s (Rahman, 2002 : 810). The theory argues that firms have constraints and these constraints determine their performance (Ruhl, 1997 : 60). If firms have no constraints, then they would have unlimited profits (Rahman, 1998 : 337; Blackstone, 2001 : 1053).
The TOC that regards the enterprise as a whole system instead of group of independent processes assists management in reducing activity cost and production time. Novels such as The Goal (Goldratt and Cox, 1992), It’s not Luck (Goldratt, 1997) and Necessary But Not Sufficient (Goldratt et al., 2000) have mainly popularized this theory (Mabin and Balderstone, 2003 : 569).
In the TOC that principally aims to maximize the efficiency of the system as a whole (Polito et al., 2006 : 44), the constraint is defined as any element that can slow down the total duration of production (Blocher et al., 2002 : 162), and thus, decrease profits (Umble and Srikant, 1995 : 81).
1.1. Research Objectives
Product mix is a rather significant decision that firms have to make. These decisions are executed following three main approaches. First, the full costing method, which is based on the conventional cost accounting approach, determines unit profit by prioritizing the unit that generates the highest profit. Second, the variable costing method determines unit profit by prioritizing the unit that generates the highest contribution. Third, the throughput accounting method, which is based on TOC, prioritizes the unit that generates the highest throughput under limited resources. Thus, product mix based on the throughput accounting method provides more profitable product mix when compared to the conventional methods.
This study examines the importance of the TOC compared with the conventional cost accounting methods in making decisions for adequate product mix decisions. To this end, an application in a chemistry enterprise was executed to determine product mix decisions and their effect on profitability by comparing the TOC with the variable and the full costing methods in respect to the throughput approach, the contribution margin approach and the unit profit approach respectively. This study considers the following questions:
Is there a bottleneck (constraint) in the production process of the firm? Does the firm determine a product mix to increase the profitability of
managerial decisions?
Does the product mix determined with the TOC throughput provide more profitable results than the product mix determined with the variable costing and full costing methods?
2. Throughput accounting and traditional cost accounting
It is undeniable that the traditional cost accounting system assisted managerial decisions by providing operational measures of cost and efficiency. However, technological developments decreased the validity of these measures as they focused on unit costs and thus failed to consider important aspects of the operating environment, committed costs and related capacity limitations that lead to bottlenecks (Sheu et al., 2003 : 433; Draman et al., 2002 : 190; Albright, 2006 : 157; Lockamy III, 2003 : 593; Corbett, 1998). Many companies in today’s business world are facing outmoded solutions because of the application of traditional cost accounting methods (Goldratt, 1983 : 90; Sheu et al, 2003 : 433).
According to the theory, throughput is the revenue generated by the system through the production of sold product. While the traditional definition of productivity focuses on “output per unit of time”, throughput emphasizes “sold product”, rather than simply “output”, because unsold product does not generate revenues (Sheu et al, 2003 : 434). Inventory is as all the financial resources invested in purchasing things the system intends to sell (Lockamy III, 2003 : 593). Operating expenses is all the non-variable costs associated with turning the inventory into throughput (Mabin and Balderstone, 2003 : 571). Unlike traditional cost accounting approaches, the
measure of the operating expenses, includes direct labor and manufacturing overheads as well as selling and administrative costs (Sheu et al, 2003 : 434). TOC focuses on maximizing throughput, as it has a revenue characteristic, and on decreasing inventory and operating expenses. As TOC focuses primarily on throughput, the accounting system proposed by TOC is usually referred to as throughput accounting (Sheu et al, 2003 : 434).
Labor as a variable cost is an established practice in the value-added concept and the traditional view. However, throughput accounting constitutes a major departure from these views, which requires significant changes in the policies and procedures and consequently, in the measurement systems that proceed with these traditional views (Lockamy III, 2003 : 593).
The pioneers of the TOC state that this theory can be used in management and is not essentially a method of product cost calculation. However, scholars on accounting state that the TOC was certainly not a method that could be used for product cost calculation, except for the purpose of accounting practice.
In this reasoning, direct material cost is taken as it is by treating it as an external component that participates in the production. While direct labor, overhead manufacturing cost and other costs (sales personnel, managers, secretaries, supervisors etc.) are evaluated together. This results from the way that the theory of constraints approach treats direct labor. In contrast to the traditional accounting approach the TOC approach does not consider direct labor as variable. The tendency of traditional cost-based measures to consider direct labor as a variable cost stems from its extensive application. These measures were practiced and developed many decades ago when direct labor costs constituted a substantial part of production cost (Sheu et al., 2003 : 433). According to these measures, qualified labor cannot be dismissed and hired whenever it is necessary. Consequently, this approach considers direct labor as a fixed cost (Tanis, 1998 : 7). In throughput accounting, direct labor and manufacturing overhead costs are evaluated in the scope of activity costs (Smith, 2000 : 52). Studies demonstrate that firms in different industries that have applied throughput accounting with the TOC observed profitable outcomes (Baxendale and Roju, 2004; Grave and Gurd, 1998; Dugdale and Jones, 1997; Dugdale and Jones, 1996; Macarthur, 1996).
2.1. Throughput and product mix decisions
The main objectives of an enterprise are the maximization of profits and product mix decisions. With the actual capacity of the enterprise, it is possible to determine the product mix to increase profits. One of the methods that can be used is TOC. In contrast to the traditional methods, TOC provides superiority by determining the product mix (Mabin and Davies, 2003 : 661).
TOC provides a general framework for making decisions to increase throughput. Under the “five steps for improvement” immediate attention is concentrated on
“ Five steps to improvement: Step 1; Identify the system’s bottlenecks, Step 2; Decide how to exploit the bottlenecks, Step 3; Subordinate everything else to the above decision, Step 4; Alleviate the system’s bottlenecks, Step 5; If, in a previous step, a bottleneck has been broken go back to step 1” (Goldratt and Cox,1993)
decisions about how to exploit constraints (step 2), on other decisions that must be subordinated to this (step 3), followed by decisions about alleviating the constraints (step 4). TOC evaluates on how accounting data supports these decisions (Dugdale and Jones, 1997 : 53).
The process of TOC focuses on “throughput” that is “sales – material cost”. The concept of throughput has similarities with the contribution margin approach but at the same time has one distinctive characteristic. Despite the fact that contribution margin is calculated by subtracting all variable costs (direct material, direct labor and variable overhead manufacturing costs) from the sales price, throughput is calculated by subtracting only material cost from the sales price. The reason for such a distinction is that TOC considers all costs as fixed, except the material cost, which is considered as a variable cost. According to the throughput approach, the most optimal product mix is determined by prioritizing the production of products that provide the most throughput per unit capacity with limited resources. In variable and full costing methods, where the capacity constraint is in question, the most optimal product mix is determined by prioritizing the products that give the highest contribution margin (V.C.) and unit profit (F.C.) with limited resources (Louderback and Patterson, 1996 : 189; Baxendale and Raju, 2004 : 31; Dugdale and Jones, 1997 : 53; Tanis, 1998 : 12; Küçüksavaş et al, 2006 : 17).
Product mix profits determined by throughput accounting could be more profitable than the product mix determined by contribution margin and unit profit methods (Atwater and Gagne, 1997 : 6).
A serious criticism of the TOC and throughput accounting is that they have a short term view (Corbett, 2003 : 39), focus on fixed costs and consider variables like price, customer orders, technology and design as fixed (Ruhl, 1997 : 20). Consequently, firms plan short-term product mix decisions and bottleneck resources (Corbett, 2003 : 39).
3. Case study: research methodology
An exploratory and descriptive research in a chemistry enterprise operating in Antalya Organized Industry Zone in Turkey was performed. Data were collected through observations of the production process in the related enterprise and interviews with authorized employees.
The stages followed in order to investigate the enterprise X are as followed: 1. Stage: Develop the research questions
- Is there a bottleneck (constraint) in the production process of the firm? - Does the firm determine product mix in order to increase the
profitability in the management’s decisions?
- Does the product mix determined by the TOC throughput provide more profitable results than the one determined by the variable costing and the full costing methods?
2. Stage: Determine the sub-problems
- Which resource(s) cause bottlenecks in the production process of the firm and how can these be eliminated?
- Why does the firm do/do not determine the product mix? If determined, which method is used? Why?
3. Stage: Determine the unit of analysis
4. Stage: Determine the sample. In the initial phases of the research, face to face interviews were performed with some managers of the enterprise X. Because of the research objectives, we conducted interviews with the vice general manager (responsible for accounting), the production manager and the marketing sales manager.
5. Stage: Data collection process
6. Stage: Analysis of data and interpretation. The data were evaluated on by comparing the effects product mix decisions on profitability based on the throughput accounting, the full and the variable costing methods.
7. Stage: Report the findings of the case study: The findings are reported in the “Results” section of the paper.
3.1. Research context: background and current situation of the firm
The firm, which was established in 1979 in Antalya, operates primarily in Germany, Cyprus and Turkish Republics. The firm is a pioneer in the region and holds 75% of the domestic market in the lime remover chemicals sector.
The firm has a total capacity of 70.000 tons of chemicals with approximately 50.000 tons of liquid and 20.000 tons of powdered cleaning material. The firm uses internal resources for its marketing activities from packaging to label design and outsources only the raw material. The firm has four main product lines: home-users, industrial users, cosmetics and napkins.
In this study, we considered only 17 products that are included in the whole home-users product line. This line is the primary production area of the firm. To avoid confusion, these products are coded from A1 to H2.
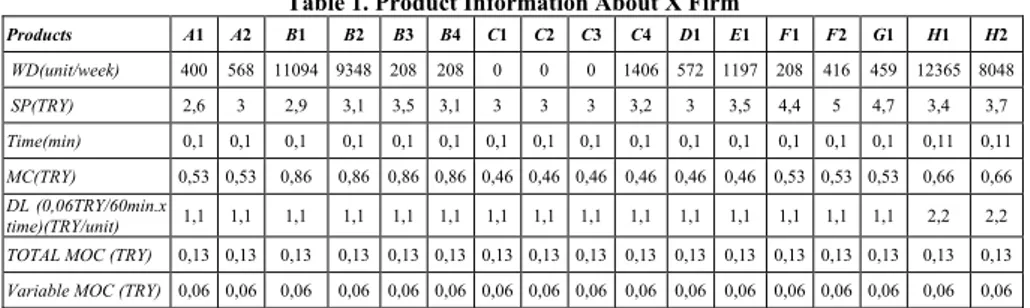
There are two shifts in the firm (7,5 hours+7,5 hours=15 hours). The production time is determined as followed: All the considered products are processed in a single machine. The machine is a 16 valve filling machine. This machine has a capacity of 600 bottles / hour. Only the products coded as H1 and H2 have a capacity of 540 bottles / hour due to some specific characteristics. For example, when calculating the production time, for the A1 product, if 600 bottles are produced (filled) in one hour and if the question is to formulate the production time of one bottle, it will be 0,1 minute for all the products, except the products coded as H1 and H2. For H1 and H2, as the machine has a capacity of 540 bottles / hour, it will be 0,11 minutes. Table 1 provides additional information that was collected from the managers of the firm. These are sales price, raw material cost, direct labor and total overhead manufacturing costs. The firm produces based on market demand determined by the sales and marketing department. Consequently, it is assumed that the firm does not have a beginning and ending inventory and sells all its products according to the demand.
In the scope of this study, only the manufacturing costs of the firm understudy were considered. In order to determine variable manufacturing overhead costs (MOC), we interviewed the managers, divided the total manufacturing overhead costs ratio into two parts and determined an estimated number similar to Atwater and Gagne’s (1997 : 14) and Küçüksavaş and his co-authors’ (2006 : 22) studies.
Table 1 provides information about the X firm’s products. The case study initiated with the previously formulated research questions. In order to find answers to the research questions, we used the first two steps of the TOC. These steps are as followed:
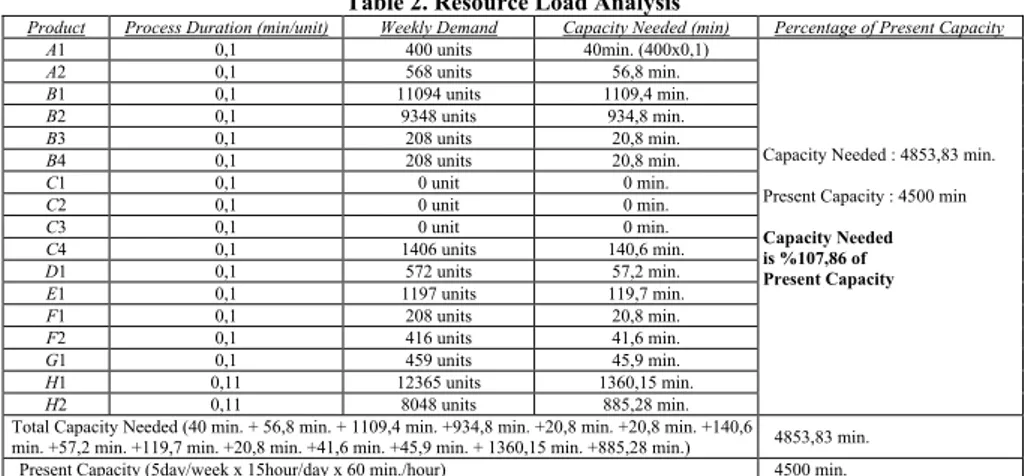
1.Step: Determination of the system’s constraints; For this step, after giving general information about the products of the firm, a resource load analysis was carried out in order to answer to first research question which is “Is there a bottleneck (constraint) in the production process of the firm?”. By using this technique, we determined whether the 16 valves filling machine constitutes a constraint in the production process. In order to determine the resource load of the machine, calculations were made in Table 2. In these calculations, an attempt was made to determine whether the enterprise has a constraint or not. By setting a capacity usage ratio, we compared the capacity needed for meeting the demand with the existing capacity of the resource.
The second research question of our study is “Does the firm determine a product mix to increase the profitability in the managerial decisions?”. According to data collected from the in-depth interviews, the managers did not have any information about the product mix and the firm had not determined a product mix in any way. The amount of production was determined entirely with the annual sales forecast of the marketing department and sometimes with the campaign organized by the senior management.
As seen in the above calculations, the capacity of the 16 valves filling machine is limited. The ratio of the usage of the filling machine is 107,86%. The capacity needed from the machine exceeded the present capacity thus, constituting or creating a constraint [while calculating the present capacity of the firm, the number of working days (5 days), the number of working hours (total of 2 shifts; 15 hours) and the number of minutes in one hour were multiplied]. Besides, when the number of days needed in a week to meet the demand is examined, this ratio is 5,393 days “(4853,83 ÷ 4500) x 5days”. This means that the machine should operate 5,393 days in a week to meet the demand. This condition also constitutes a constraint because the number of working days in a week is five.
Overall, the constraint was determined using the first step of the TOC. Following this, the second step involves making a decision on how to improve this constraint. 2. Step: Deciding on how to improve the constraints; The limited resource should be improved by producing the product mix that gives the greatest amount of return in the presence of the limited resource. For this reason, the product that has the priority in the production process should be determined by calculating throughput per limited resource. In order to determine this, the filling machine with 16 valves was determined as a limited resource. In order to benefit from this limited resource in the most profitable way, the product that should have the priority in production was determined by calculating throughput per limited resource according to the theory of constraints-throughput approach as exhibited in Table 3.
To calculate the throughput of each product, first of all, the direct material cost was subtracted from the sales price of the product as seen in Table 3. Then, the throughput for each product per limited resource was calculated by dividing the throughput of each product to the process duration necessary for that product in the
limited resource. The product that has the most throughput per limited resource will have the priority in production. As can be seen, the F2 product has a production priority as it has the greatest value. The F2 product is coded as number 1. Table 4, shows the amount of production for each product and the firm’s possible total throughput based on the product mix.
3.2. Calculation of the product mix and profitability according to the theory of constraints-throughput
Table 3 shows the production priority based on the throughput per limited resource used. Thus, the privileged product that should be produced in the first place is the F2 product as it has the greatest throughput per limited resource used (44,7).
In determining the optimal product mix, it is proper for the process to identify the amount to be produced (Atwater and Gagne, 1997 : 9). The product that has the first priority should be produced with the present capacity of the limited resource and if there is a residual capacity, the product that has the second priority should be produced until the capacity of the limited resource expires. In the presence of more than two products, the literature suggests the following calculation (Luebbe and Finch, 1992 : 1474; Ünal, 2006 : 81):
F2 product = 416 units (weekly demand) x 0,1 min. (process duration, time) = 41,6
min.
G1=459 units x 0,1 min. = 45,9 min.; F1=208 units x 0,1 min.=20,8 min.; E1=1197 units x 0,1 min. = 119,7 min; H2=8048 units x 0,11 min.=885,28 min.; C4=1406 units x 0,1 min.=140,6 min; B3=208 units x 0,1 min.=20,8 min; C1=0 unit x 0,1 min.=0 min.; C2=0 unit x 0,1 min.=0 min; C3=0 unit x 0,1 min.=0 min.; D1=572 units x 0,1 min.=57,2 min.; H1=12365 units x 0,11min.=1360 min.; A2=568 units x 0,1 min.=56,8 min.; B2=9348 units x 0,1 min.=934,8min.; B4=208 units x 0,1 min.=20,8 min.; A1= 400 units x 0,1 min.=40 min.= 3744,28 min.
Therefore;
B1 = 4500 min.(present capacity) – 3744,28 min.(capacity needed) =755,72
min.(residual capacity) 755,72min. ÷ 0,1min. (unit process duration for B1 product) =7557 units.
Then the product mix will consist of:
F2=416 units, G1=459 units, F1=208 units, E1=1197 units, H2=8048 units, C4=1406 units, B3=208 units, C1=0 units, C2=0 units, C3=0 units, D1=572 units, H1=12365 units, A2=568 units, B2=9348 units, B4=208 units, A1=400 units, B1= 7557 units.
Table 4 presents the results of the product mix determined with the throughput approach. The products’ order in the table was formed according to their priorities (F2………B1). According to the results, B1 product which has the lowest production priority will be produced in 7557 units instead of 11094 units using the theory of constraints-throughput approach.
After the determination of the product mix with the throughput approach, the total throughput, which the determined product mix would provide to the firm, was calculated by multiplying the products’ amounts with the determined unit throughput (see Table 4).
Total Throughput; (416 units(F2) x 4,47 TRY+ 459 units(G1) x 4,17 TRY + 208 units(F1) x 3,87 TRY + 1197 units(E1) x 3,04 TRY + 8048 units(H2) x 3,04 TRY + 1406 units(C4) x 2,74 TRY + 208 units(B3) x 2,64 + 0 units(C1) x 2,54 + 0 units(C2) x 2,54 + 0 units(C3) x 2,54 TRY + 572 units(D1) x 2,54 TRY + 12365 units(H1) x 2,74 TRY + 568 units(A2) x 2,47 TRY + 9348 units(B2) x 2,24 TRY + 208 units(B4) x 2,24 TRY + 400 units(A1) x 2,07 TRY + 7557 units(B1)x 2,04 TRY) = 111.470,53 TRY
According to the theory of constraints-throughput approach, the firm will provide 111.470,53 TRY throughput weekly.
3.3. Determination of the product mix and calculation of profitability according to the variable costing method-contribution margin
After determining the product mix according to the theory of constraints-throughput approach and the total throughput provided in the firm, the product mix and the production priority was determined according to the variable costing method-contribution margin in Tables 5 and 6. According to the results, the first priority for production will be given to the F2 product and the last priority will be given to the
H1 product. The priorities determined according to contribution margin approach,
except for the first four products, were different than the priorities determined according the TOC. The production priorities calculated by the variable costing method-contribution margin and the determined product mix are calculated below:
F2 prod.= 416 units (weekly demand) x 0,1 min.(process duration, time) = 41,6 min.
G1 = 459 units x 0,1 min. =45,9 min.; F1=208 units x 0,1 min.=20,8 min; E1=1197 units x 0,1 min.=119,7 min; C4 =1406 units x 0,1 min.=140,6 min.; B3=208 units x 0,1 min.=20,8 min.; C1=0 units x 0,1 min.=0 min.; C2=0 units x 0,1 min.=0 min.; C3=0 units x 0,1 min.=0 min.; D1=572 units x 0,1 min.=57,2 min.; A2=568 units x 0,1 min.=56,8 min.; B2=9348 units x 0,1 min.= 934,8 min.; B4=208 units x 0,1 min.=20,8 min.; A1=400 units x 0,1 min.=40 min.; B1=11094 units x 0,1 min. =1109,4 min.; H2=8048 units x 0,11 min=885,28 min.= 3493,68 min.
Therefore;
H1 = 4500 min.(present capacity) – 3493,68 min.(capacity needed) =1006,32
min.(residual capacity) 1006,32 min. ÷ 0,11 min.(unit processing time for H1 product)=9148,36 units
Then the product mix will consist of;
F2=416 units, G1=459 units, F1=208 units, E1=1197 units, C4=1406 units, B3= 208
units, C1=0 units, C2=0 units, C3=0 units, D1=572 units, A2=568 units, B2=9348 units, B4=208 units, A1=400 units, B1=11094 units, H2=8048 units, H1=9148,36
units.
Table 6 presents the results of the product mix determined with the contribution margin. The products’ order was organized according to their production priorities (F2…..H1). According to the results, the H1 product, which has the lowest production priority according to the variable costing method-contribution margin method, will be produced 12365 units instead of 9148,6 units.
After the determining the product mix with the contribution margin approach, the total contribution margin that will be provided to the firm was calculated by multiplying the unit contribution margin exhibited in Table 5 with the amounts of these products.
Total Contribution Margin (416 units(F2) x 3,31TRY + 459 units(G1) x 3,01TRY + 208 units(F1) x 2,71TRY + 1197 units(E1) x 1,88TRY + 1406 units(C4) x 1,58TRY + 208 units(B3) x 1,48TRY + 0 units(C1) x 1,38 TRY+ 0 units(C2) x 1,38TRY + 0 units(C3) x 1,38TRY + 572 units(D1) x 1,38TRY + 568 units(A2) x 1,31TRY + 9348 units(B2) x 1,08TRY + 208 units(B4) x 1,08TRY + 400 units(A1) x 0,91TRY + 11094 units(B1) x 0,88TRY + 8048 units(H2) x 0,78TRY + 9148,36 units(H1) x 0,48TRY) = 40.751,208 TRY
The firm will earn a total contribution margin of 40.751,208 TRY weekly as a result of the product mix determined with the contribution margin method.
3.4. Determination of the product mix and calculation of profits according to the full costing method-unit profit
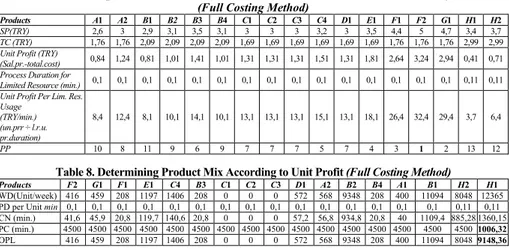
After determining the total contribution margin that the firm will provide and the product mix according to the variable costing method-contribution margin method, the production priority and the product mix were determined with the full costing-unit profit approach (see Tables 7 and 8). The production priorities, which were determined with the full costing method-unit profit approach, were realized in the same order as the one determined with the variable costing method-contribution margin approach. Thus, the first priority for production was given to the F2 product and the last priority was given to the H1 product. The production priorities determined according to the full costing method-unit profit approach and the respective product mix was calculated as shown below:
F2 product= 416 units (weekly demand) x 0,1 min. (process duration, time) = 41,6
min.
G1=459 units x 0,1 min.=45,9 min.; F1 =208 units x 0,1 min.=20,8 min.; E1=1197 units x 0,1 min.=119,7 min.; C4=1406 units x 0,1 min.=140,6 min.; B3=208 units x 0,1 min.=20,8 min.; C1=0 units x 0,1 min.=0 min.; C2=0 units x 0,1 min.=0 min.; C3=0 units x 0,1 min.=0 min.; D1 =572 units x 0,1 min.=57,2 min.; A2=568 units x 0,1 min. =56,8 min.; B2=9348 units x 0,1 min.=934,8 min.; B4=208 units x 0,1 min.=20,8 min.; A1=400 units x 0,1 min.=40 min.; B1=11094 units x 0,1 min.=1109,4 min.; H2=8048 units x 0,11 min.=885,28 min.=3493,68 min.
Therefore;
H1 = 4500 min.(present capacity) – 3493,68 min.(capacity needed) =1006,32
min.(residual capacity) 1006,32 min. ÷ 0,11 min.(unit processing time for H1 product)=9148,36 units
Then the product mix will consist of:
F2=416 units, G1=459 units, F1=208 units, E1=1197 units, C4=1406 units, B3=208
units, C1=0 units, C2=0 units, C3=0 units, D1=572 units, A2=568 units, B2=9348 units, B4=208 units, A1=400 units, B1=11094 units, H2=8048 units, H1=9148,36
Table 8 presents the results of the product mix determined with the unit profit approach. The products’ order was organized according to their production priorities (F2………H1). According to the results, the H1 product, which has the lowest production priority according to the full costing method-unit profit approach, will be produced 12365 units instead of 9148, 36 units.
After determining the product mix with the unit profit approach, the total unit profit that will be provided to the firm was calculated by multiplying the unit profit exhibited in Table 7 with the amounts of these products.
Total Unit Profit (416 units (F2)x 3,24 TRY + 459 units(G1) x 2,94 TRY + 208 units(F1) x 2,64 TRY + 1197 units(E1) x 1,81 TRY + 1406 units(C4) x 1,51 TRY + 208 units(B3) x 1,41 TRY + 0 unit(C1) x 1,31 TRY + 0 unit(C2) x 1,31 TRY + 0 unit(C3) x 1,31 TRY + 572 units(D1) x 1,31 TRY + 568 units(A2) x 1,24 TRY + 9348 units(B2) x 1,01 TRY + 208 units(B4) x 1,01 TRY + 400 units(A1) x 0,84 TRY + 11094 units(B1) x 0,81 TRY + 8048 units(H2) x 0,71 TRY + 9148,36 units(H1) x 0,41 TRY) = 37.721,5776 TRY
The firm will earn a total unit profit of 37.721,5776 TRY weekly as a result of the product mix determined by the unit profit approach.
3.5. Comparison of methods
The product mix determined with the TOC, the variable full costing and the full costing methods and their effects on profitability are compared in the summary table (Table 9) presented below:
Profit Margins for the three methods:
Net profit / Sales = 58.629,73 TRY/142.386,7 TRY =41% (Throughput App.) Net profit / Sales =38.099,4908 TRY / 141.707,424 TRY= 27%(Cont.Marg.App.)
Net profit / Sales =37.721,5776 TRY /141.707,424 TRY = 26% (Unit Profit App.) Table 9 exhibits the net profits the firm will earn as a result of the product mix determined by the three approaches in order to find the most profitable product mix. First, as Table 9 shows, the firm’s total throughput that will be earned by the product mix determined by the throughput accounting (111.470,53TRY) is greater than the contributions provided by the other methods (contribution margin: 40.751,2028 TRY and unit profit: 37.721,5776 TRY).
Second, when the net profit is measured with each of the three methods, the net profit earned by the product mix determined by the theory of constraints-throughput accounting is greater than the product mix determined by the variable costing-contribution margin approach and the full costing method-unit profit approach (58.629,73TRY > 38.099,4908TRY and 58.629,73TRY TRY. > 37.721,5776 TRY). Third, when the contribution margin and the unit profit methods are compared, the profits earned by the product mix determined by the contribution margin are greater than the product mix determined by the unit profit approach (38.099,4908 TRY > 37.721,5776 TRY).
Results
Continuous changes in customer demand and the intense competition generally necessitate low prices (costs), high quality and greater product diversification. The factors that emerge (such as differentiating customer demand) turn accounting, from a recording system to a sensitive tool that guides and lightens the managements’ future plans and strategies. As a result, new approaches in the area of accounting were suggested. One of the approaches is the TOC and “Throughput Accounting” as identified in the literature, which refers to the accounting practice of the theory. Several studies were conducted in this field. There is a general agreement that firms gain several advantages with the practice of this theory. Many pioneering firms have succeeded in reducing cycle times, inventories, and cycle times depending on direct labor, order processing periods and ratios for residual materials. At the same time, they have increased cash flows, corporate revenues, and activities depending on capacity, market shares, net sales and customer satisfaction. In this study, product mix decisions and their effects on the profitability of a chemistry enterprise operating in Antalya Organized Industry Zone were compared with the constraints-throughput approach, the variable costing method-contribution margin approach and the full costing method-unit profit approach.
The three methods differ on the conceptualization of costs. The TOC assumes that except direct raw materials and supply expenses all other expenditures are invalid costs in decision making. For example, while giving a product mix decision, the TOC makes a decision only by taking into account the raw materials and supplies. The reason why the TOC only considers direct material as a cost element is that the theory does not accept overhead costs as a cost element and advocates that there is not any method that can attribute overhead costs truly to the products. For this reason, the TOC calculates the product costs by considering the total variable costs in production. This variable cost is the direct raw material and supply expenses. All other costs are processed as activity costs as long as they belong to the period in which they have occurred and they are considered as fixed. In this way, the TOC and throughput accounting, which have a short term standpoint, bring greater efficiency to the management’s decisions such as short term product mix and pricing.
In the variable costing method, the contribution margin is defined as the margin that remains after the variable cost is covered (Büyükmirza, 2000 : 381). The contribution margin analysis in the variable costing method is an alternative method to the full costing method (revenues-total expenditures) (Atwater and Gagne, 1997 : 6). As formulated above, within the scope of the TOC; if throughput, which is defined as “sales – raw material costs (in the theory the only variable cost is the raw material)”, is formulated as “revenues – variable costs (direct material, direct labor and variable manufacturing overhead costs), conceptually, it will have no difference from the contribution margin. Under these circumstances, there will be no conceptual difference between variable costing and throughput accounting. However, direct labor and variable manufacturing overhead costs will differ according to the way that they are evaluated. Although the TOC considers direct labor as fixed cost, the contribution margin approach generally qualifies direct labor costs as variable (Swain and Bell, 1999; Tanış, 1998 : 12). On the other hand, in the full costing method, the total unit profit constitutes weekly profit, which is
determined by subtracting all total costs such as direct labor, material and total manufacturing overhead costs without making a categorization like variable and fixed costs. The full costing method is a method that does not offer rich information for internal management decisions such as product mix, pricing, and outsourcing, but the method is necessary for the external financial reports (Ruhl, 1997 : 60). In the variable costing method, the capacity constraint is considered and the product mix is determined by prioritizing the product that provides the highest contribution margin per capacity unit in the presence of the limited resource. However, in the full costing method, the product mix is determined by prioritizing the product that provides the most unit profit per capacity unit at the limited resource (Küçüksavaş, 1992 : 10). According to the TOC, the product mix is determined by prioritizing the product that provides the highest throughput per capacity unit with the limited resource. However, the product mix determined by the theory of constraints-throughput approach may be more profitable than the product mix determined by the contribution margin and the unit profit respectively (Atwater and Gagne, 1997 : 6). The results of our study support the statement that the profits earned by the product mix determined with the throughput approach is more profitable than the profits earned by the traditional methods (full and variable costing methods). This finding supports the previous literature (Lee and Plenert, 1996 : 550-553; Atwater and Gagne, 1997 : 6-15; Scheinkopf, 1995 : 2-7). Previous literature argues that the traditional cost accounting methods generate superficial final product costs and attribute excessive costs to the production processes since the TOC considers only the variable cost as direct material. There is a consensus that the theory of constraints-throughput approach generates a more factual product cost as it reflects only direct costs to the product cost. The more factual product cost information that the throughput approach generates will provide more accurate short term performance measures and will assist in decisions like pricing and investment.
References
ALBRIGHT, T., LAM, M. (2006). Managerial accounting and continuous improvement initiatives: a retrospective and framework. Journal of Managerial Issues, 18 (2), pp.157-174.
ATWATER, J.B., GAGNE, M.L. (1997). The theory of constraints versus contribution analysis for product mix decisions. Journal of Cost Management, 11 (1), pp.6-15.
BAXENDALE, S.J., RAJU, P.S. (2004). Using ABC to enhance throughput accounting: a strategic perspective. Cost Management, 18, pp.31-38.
BLACKSTONE, J. H. (2001). Theory of constraints – a status report. International Journal of
Production Research, 39 (6), pp.1053-1080.
BLOUCHER, E.J., CHEN, K.H., LIN, T.W.K. (2002). Cost management a strategic
emphasis. McGraw-Hill Irwin.
BÜYÜKMİRZA, K. (2000). Maliyet ve yönetim muhasebesi, Ankara: Barış Kitap.
CORBETT, T. (2003). Throughput accounting and ABC: the driving factors behind each methodology, Journal of Cost Management, (January/February), pp.37-45.
DRAMAN, R.H., LOCKAMY, A.L., COX, J.F. (2002). Constraint-based accounting and its impact on organizational performance: a simulation of four common business strategies.
Integrated Manufacturing Systems, 13 (4), pp.190-200.
DUGDALE, D., JONES, C. (1997). Accounting for throughput: techniques for performance measurement decisions. Management Accounting, December, pp.52-56.
GRAVES, C., GURD, B. (1998). Throughput accounting: a revolution in the making.
Australian CPA, 68 (7), pp.36-38.
KÜÇÜKSAVAŞ, N., TANIŞ, V.N., ÜNAL, E. (2006). Kısıtlar teorisi ve değişken maliyet sistemi. Analiz, 6 (15), pp.17-58.
LEE, T., PLENERT, G. (1996). Maximizing product mix profitability – what’s the best analysis Tool. Production Planning & Control, 7 (6), pp.547-553.
LOCKAMY, A. (2003). A constraint-based framework for strategic cost management.
Industrial Management & Data Systems, 103 (8), pp.591-599.
LOUDERBACK, J.G., PATTERSON, J.W. (1996). Theory of constraints versus traditional management accounting. Accounting Education, 1 (2), pp.189-196.
LUEBBE, R., FINCH, B. (2001). Theory of constraints and linear programming: a comparison. International Journal of Production Research, 30 (6), pp.1471-1478.
MABIN, V.J., BALDERSTONE, S.J. (2003). The performance of the theory of constraints methodology: analysis and discussion of successful TOC applications. International
Journal of Operations& Production Management, 23 (6), pp.568-595.
MABIN, V.J., DAVIES J. (2003). Framework for understanding complementary nature of TOC frames: insights from the product dilemma. International Journal of Production
Research, 41 (4), pp.661-680.
MACARTHUR, J.B. (1996). From activity-based costing to throughput accounting.
Management Accounting, 77 (4), pp.30-38.
POLITO, T., WATSON K., VAKURKA R.J. (2006). Using the theory of constraints to improve competitiveness: an airline case study, Competitiveness Review, 16 (1), pp.44-50. RAHMAN, S. (1998). Theory of constraints a review of the philosophy and its applications,
International Journal of Operations & Production Management, 18 (4), pp.336-355.
RUHL, J.M. (1997). The theory of constraints within a cost accounting framework, Journal of
Cost Management, 11 (6), (November/December), pp.16-24.
SCAPENS, R.W. (1990). Researching management accounting practice: the role of case study methods, British Accounting Review, 22, pp.259-281.
SHEU, C., CHEN, M.H., KOVAR, S. (2003). Integrating ABC and TOC for better manufacturing decision making, Integrated Manufacturing Systems, 14 (5), pp.433-441.
SMITH, D. (2000). The measurement nightmare: how the theory of constraints can
resolve conflicting strategies, policies and measures. Florida: CRC Press.
SWAIN, M., BELL, J. (1999). The theory of constraints and throughput accounting. New York: McGraw-Hill.
TANIŞ, V.N. (1998). Yönetim muhasebesi açısından kısıtlar teorisi ve süreç muhasebesi,
Çukurova Üniversitesi İktisadi ve İdari Bilimler Dergisi, 8 (1), pp.185-198.
UMBLE, M., SRIKANTH, M.L. (1995). Synchronous manufacturing: principles for
world-class excellence. 1st ed., Wallingford: The Spectrum Publishing Company.
ÜNAL, E.N. (2006). Optimal ürün karması belirlemede faaliyete dayalı maliyet sistemi ve
kısıtlar teorisi uygulaması. Yayınlanmamış doktora tezi. Çukurova Üniversitesi Sosyal
Bilimler Enstitüsü İşletme Anabilim Dalı.
Table 1. Product Information About X Firm
Products A1 A2 B1 B2 B3 B4 C1 C2 C3 C4 D1 E1 F1 F2 G1 H1 H2 WD(unit/week) 400 568 11094 9348 208 208 0 0 0 1406 572 1197 208 416 459 12365 8048 SP(TRY) 2,6 3 2,9 3,1 3,5 3,1 3 3 3 3,2 3 3,5 4,4 5 4,7 3,4 3,7 Time(min) 0,1 0,1 0,1 0,1 0,1 0,1 0,1 0,1 0,1 0,1 0,1 0,1 0,1 0,1 0,1 0,11 0,11 MC(TRY) 0,53 0,53 0,86 0,86 0,86 0,86 0,46 0,46 0,46 0,46 0,46 0,46 0,53 0,53 0,53 0,66 0,66 DL (0,06TRY/60min.x time)(TRY/unit) 1,1 1,1 1,1 1,1 1,1 1,1 1,1 1,1 1,1 1,1 1,1 1,1 1,1 1,1 1,1 2,2 2,2
TOTAL MOC (TRY) 0,13 0,13 0,13 0,13 0,13 0,13 0,13 0,13 0,13 0,13 0,13 0,13 0,13 0,13 0,13 0,13 0,13
Variable MOC (TRY) 0,06 0,06 0,06 0,06 0,06 0,06 0,06 0,06 0,06 0,06 0,06 0,06 0,06 0,06 0,06 0,06 0,06 WD:Weekly Demand;SP: Sales Price; MC:Material Cost; DL:Direct Labor; DMC:Direct Material Cost; VPC:Variable Production Cost; CM: Contribution Margin; PP: Production Priority; TC:Total Cost
Table 2. Resource Load Analysis
Product Process Duration (min/unit) Weekly Demand Capacity Needed (min) Percentage of Present Capacity
A1 0,1 400 units 40min. (400x0,1)
Capacity Needed : 4853,83 min. Present Capacity : 4500 min
Capacity Needed is %107,86 of Present Capacity A2 0,1 568 units 56,8 min. B1 0,1 11094 units 1109,4 min. B2 0,1 9348 units 934,8 min. B3 0,1 208 units 20,8 min. B4 0,1 208 units 20,8 min. C1 0,1 0 unit 0 min. C2 0,1 0 unit 0 min. C3 0,1 0 unit 0 min. C4 0,1 1406 units 140,6 min. D1 0,1 572 units 57,2 min. E1 0,1 1197 units 119,7 min. F1 0,1 208 units 20,8 min. F2 0,1 416 units 41,6 min. G1 0,1 459 units 45,9 min. H1 0,11 12365 units 1360,15 min. H2 0,11 8048 units 885,28 min.
Total Capacity Needed (40 min. + 56,8 min. + 1109,4 min. +934,8 min. +20,8 min. +20,8 min. +140,6
min. +57,2 min. +119,7 min. +20,8 min. +41,6 min. +45,9 min. + 1360,15 min. +885,28 min.) 4853,83 min. Present Capacity (5day/week x 15hour/day x 60 min./hour) 4500 min.
Table 3. Calculation of Throughput per Limited Resource Minute in the X Firm (Theory of Constraints)
Products A1 A2 B1 B2 B3 B4 C1 C2 C3 C4 D1 E1 F1 F2 G1 H1 H2
SP(TRY) 2,6 3 2,9 3,1 3,5 3,1 3 3 3 3,2 3 3,5 4,4 5 4,7 3,4 3,7
DMC (TRY) 0,53 0,53 0,86 0,86 0,86 0,86 0,46 0,46 0,46 0,46 0,46 0,46 0,53 0,53 0,53 0,66 0,66
Throughput (TRY)
(sales price – d.mat.cst) 2,07 2,47 2,04 2,24 2,64 2,24 2,54 2,54 2,54 2,74 2,54 3,04 3,87 4,47 4,17 2,74 3,04
Limited Resource
Process Duration (min.) 0,1 0,1 0,1 0,1 0,1 0,1 0,1 0,1 0,1 0,1 0,1 0,1 0,1 0,1 0,1 0,11 0,11
Throughput Per Limited Resource (TRY/min.) Throughput.÷ L.R.P.D.)
20,7 24,7 20,4 22,4 26,4 22,4 25,4 25,4 25,4 27,4 25,4 30,4 38,7 44,7 41,7 24,9 27,63
PP 12 10 13 11 7 11 8 8 8 6 8 4 3 1 2 9 5
Table 4. Determining Product Mix According to Throughput (Theory of Constraints)
Products F2 G1 F1 E1 H2 C4 B3 C1 C2 C3 D1 H1 A2 B2 B4 A1 B1
WD (unit/week) 416 459 208 1197 8048 1406 208 0 0 0 572 12365 568 9348 208 400 11094 PD per Unit (min. 0,1 0,1 0,1 0,1 0,11 0,1 0,1 0,1 0,1 0,1 0,1 0,11 0,1 0,1 0,1 0,1 0,1 CN (min.) 41,6 45,9 20,8 119,7 885,28 14,06 20,8 0 0 0 57,2 1360,15 56,8 93,48 20,8 40 110,94 PC (min.) 4500 4500 4500 4500 4500 4500 4500 4500 4500 4500 4500 4500 4500 4500 4500 4500 755,72 OPL (unit/week) 416 459 208 1197 8048 1406 208 0 0 0 572 12365 568 9348 208 400 7557
WD: Weekly Demand; OPL: Optimal Production Level; CN: Capacity Needed; PD: Process Duration; PC: Present Capacity
Table 5. Determining Contribution Margin Per Limited Resource Minute and Production Priority in X Firm (Variable Costing method)
Products A1 A2 B1 B2 B3 B4 C1 C2 C3 C4 D1 E1 F1 F2 G1 H1 H2 SP(TRY) 2,6 3 2,9 3,1 3,5 3,1 3 3 3 3,2 3 3,5 4,4 5 4,7 3,4 3,7 VPC(D.Mat.+D.L ab+D.MOC)(TRY 1,69 1,69 2,02 2,02 2,02 2,02 1,62 1,62 1,62 1,62 1,62 1,62 1,69 1,69 1,69 2,92 2,92 CM (TRY)(sales pr.– var.pr.cost) 0,91 1,31 0,88 1,08 1,48 1,08 1,38 1,38 1,38 1,58 1,38 1,88 2,71 3,31 3,01 0,48 0,78 Limited Reources Process Duration (min.) 0,1 0,1 0,1 0,1 0,1 0,1 0,1 0,1 0,1 0,1 0,1 0,1 0,1 0,1 0,1 0,11 0,11 Contribution Margin per Lim.Res.Usage (TRY/min.) (cont.mar.÷ lim.res.prs duration) 9,1 13,1 8,8 10,8 14,8 10,8 13,8 13,8 13,8 15,8 13,8 18,8 27,1 33,1 30,1 4,36 7,09 PP 10 8 11 9 6 9 7 7 7 5 7 4 3 1 2 13 12
Table 6. Product Mix Determination According to Contribution Margin (Variable Costing Method)
Products F2 G1 F1 E1 C4 B3 C1 C2 C3 D1 A2 B2 B4 A1 B1 H2 H1 WD(unit/week) 416 459 208 1197 1406 208 0 0 0 572 568 9348 208 400 11094 8048 12365 PD for Unit (min) 0,1 0,1 0,1 0,1 0,1 0,1 0,1 0,1 0,1 0,1 0,1 0,1 0,1 0,1 0,1 0,11 0,11 CN (min.) 41,6 45,9 20,8 119,7 140,6 20,8 0 0 0 57,2 56,8 934,8 20,8 40 1109,4 885,28 1360,15 PC (min.) 4500 4500 4500 4500 4500 4500 4500 4500 4500 4500 4500 4500 4500 4500 4500 4500 1006,32 OPL 416 459 208 1197 1406 208 0 0 0 572 568 9348 208 400 11094 8048 9148,36
Table 7. Determining Unit Profit Per Limited Resource Minute and Production Priority in X Firm
(Full Costing Method)
Products A1 A2 B1 B2 B3 B4 C1 C2 C3 C4 D1 E1 F1 F2 G1 H1 H2
SP(TRY) 2,6 3 2,9 3,1 3,5 3,1 3 3 3 3,2 3 3,5 4,4 5 4,7 3,4 3,7
TC (TRY) 1,76 1,76 2,09 2,09 2,09 2,09 1,69 1,69 1,69 1,69 1,69 1,69 1,76 1,76 1,76 2,99 2,99
Unit Profit (TRY)
(Sal.pr.-total.cost) 0,84 1,24 0,81 1,01 1,41 1,01 1,31 1,31 1,31 1,51 1,31 1,81 2,64 3,24 2,94 0,41 0,71
Process Duration for
Limited Resource (min.) 0,1 0,1 0,1 0,1 0,1 0,1 0,1 0,1 0,1 0,1 0,1 0,1 0,1 0,1 0,1 0,11 0,11
Unit Profit Per Lim. Res. Usage (TRY/min.) (un.prr ÷ l.r.u. pr.duration) 8,4 12,4 8,1 10,1 14,1 10,1 13,1 13,1 13,1 15,1 13,1 18,1 26,4 32,4 29,4 3,7 6,4 PP 10 8 11 9 6 9 7 7 7 5 7 4 3 1 2 13 12
Table 8. Determining Product Mix According to Unit Profit (Full Costing Method)
Products F2 G1 F1 E1 C4 B3 C1 C2 C3 D1 A2 B2 B4 A1 B1 H2 H1
WD(Unit/week) 416 459 208 1197 1406 208 0 0 0 572 568 9348 208 400 11094 8048 12365 PD per Unit min 0,1 0,1 0,1 0,1 0,1 0,1 0,1 0,1 0,1 0,1 0,1 0,1 0,1 0,1 0,1 0,11 0,11 CN (min.) 41,6 45,9 20,8 119,7 140,6 20,8 0 0 0 57,2 56,8 934,8 20,8 40 1109,4 885,28 1360,15 PC (min.) 4500 4500 4500 4500 4500 4500 4500 4500 4500 4500 4500 4500 4500 4500 4500 4500 1006,32 OPL 416 459 208 1197 1406 208 0 0 0 572 568 9348 208 400 11094 8048 9148,36
Table 9. Net Profit in Terms of the Theory of Constraints, Variable Costing and Full Costing
(Comparison of the Methods)
Theory of Constraints-Throughput Approach Sales Revenue (416units(F2)x5TRY+459units(G1)x4,7TRY+208units(F1)x4,4TRY+1197units(E1)x3,5TRY+8048units(H2)x3,7TR Y+1406units(C4)x3,2TRY+208 units(B3)x3,5TRY+0units(C1)x3TRY+0units(C2)x3TRY+0units(C3)x3TRY+572units(D1)x3TRY+12365units(H1)x 3,4TRY+568units(A2)x3TRY+9348units(B2)x3,1TRY+208units(B4)x3,1TRY+400units(A1)x2,6TRY+7557units(B1) x2,9TRY) 142.386,7TRY (-) D. Material Cot (416unitsx0,53TRY+459unitsx0,53TRY+208unitsx0,53TRY+1197unitsx 0,46TRY+8048unitsx0,66TRY+1406unitsx0,46TRY+208unitsx0,86TRY+0unitsx0,46TRY+0unitsx0,46TRY+0unitsx 0,46TRY+572unitsx0,46TRY+12365unitsx0,66TRY+568unitsx0,53TRY+9348unitsx0,86TRY+208unitsx0,86TRY+4 00unitsx0,53TRY+7557unitsx0,86TRY) (30.916,17TRY)
Total Throughput 111.470,53TRY
(-) D.Lab+ Total MOC
(416unitsx1,23TRY+459unitsx1,23TRY+208unitsx1,23TRY+1197unitsx
1,23TRY+8048unitsx1,23TRY+1406unitsx1,23TRY+208unitsx1,23TRY+0unitsx1,23TRY+0unitsx1,23TRY+0unitsx 1,23TRY+572unitsx1,23TRY+12365unitsx1,23TRY+568unitsx1,23TRY+9348unitsx1,23TRY+208unitsx1,23TRY+4 00unitsx1,23TRY+7557unitsx1,23TRY)
(52.840,8TRY)
Net Profit 58.629,73TRY
Varible Costing Method- Contribution Margin Approach Sales Revenue (416units(F2)x5TRY+459units(G1)x4,7TRY+208units(F1)x4,4TRY+1197units(E1)x3,5TRY+1406units(C4)x3,2TR Y+208units(B3)x3,5TRY+0units(C1)x3TRY+0units(C2)x3TRY+0units(C3)x3TRY+572units(D1)x3TRY+568units(A 2)x3TRY+9348units(B2)x3,1TRY+208units(B4)x3,1TRY+400units(A1)x2,6TRY+11094units(B1)x2,9TRY+8048unit s(H2)x3,7TRY+9148,36units(H1)x3,4TRY) 141.707,424TRY (-) Variable Costs (D. Lab. + D. Mat.+ Var.MOC)
(416unitsx1,69TRY+459unitsx1,69TRY+208unitsx1,69TRY+1197unitsx1,62TRY+1406unitsx1,62TRY+208unitsx2, 02TRY+0unitsx1,62TRY+0unitx1,62TRY+0unitx1,62TRY+572unitsx1,62TRY+568unitsx1,69TRY+9348unitsx2,02 TRY+208unitsx2,02TRY+400unitsx1,69TRY+11094unitsx2,02TRY+8048unitsx2,92TRY+9148,36units x2,92TRY)
(100.956,2212TRY)
Total Contribution Margin 40.751,2028TRY
(-) Fixed MOC
(416unitsx0,06TRY+459unitsx0,06TRY+208unitsx0,06TRY+1197unitsx0,06TRY+1406unitsx0,06TRY+208unitsx0, 06TRY+0unitsx0,06TRY+0unitsx0,06TRY+0unitsx0,06TRY+572unitsx0,06TRY+568unitsx0,06TRY+9348unitsx0,0 6TRY+208unitsx0,06TRY+400unitsx0,06TRY+11094unitsx0,06TRY+8048unitsx0,06TRY+10063,2units x0,06TRY)
(2651,712TRY)
Net Profit 38.099,4908TRY
Full Costing Method Unit Profit Approach Sales Revenue (416units(F2)x5TRY+459units(G1)x4,7TRY+208units(F1)x4,4TRY+1197units(E1)x3,5TRY+1406units(C4)x3,2TR Y+208units(B3)x3,5TRY+0units(C1)x3TRY+0units(C2)x3TRY+0units(C3)x3TRY+572units(D1)x3TRY+568units(A 2)x3TRY+9348units(B2)x3,1TRY+208units(B4)x3,1TRY+400units(A1)x2,6TRY+11094units(B1)x2,9TRY+8048unit s(H2)x3,7TRY+9148,36units(H1) x3,4TRY) 141.707,424TRY
(-) Total Costs (D. Lab. + D. Mat.+ Total )
(416unitsx1,76TRY+459unitsx1,76TRY+208unitsx1,76TRY+1197unitsx1,69TRY+1406unitsx1,69TRY+208unitsx2, 09TRY+0unitsx1,69+0unitsx1,69TRY+0unitsx1,69TRY+572unitsx1,69TRY+568unitsx1,76TRY+9348unitsx2,09TR Y+208unitsx2,09TRY+400unitsx1,76TRY+11094unitsx2,09TRY+8048unitsx2,99TRY+9148,36x2,99 TRY)
(103.985,8464TRY)
Total Unit Profit 37.721,5776 TRY