Investigation of Genetic Structures of Coloured Horses by mtDNA
D-loop Sequence Analysis in Turkey
[1][2]Abdurrahman KOSEMAN
1,aYusuf OZSENSOY
2,bMetin ERDOGAN
3,cCevdet YARALI
4,dBurhan TOPRAK
4,eKemal ZENGIN
4,fİbrahim SEKER
5,g
[1] This study was presented as entitled “Investigation of genetic variation using mtDNA D-loop sequence analysis in Coloured horses in Turkey” in ICAGAS-International Congress on Agriculture and Animal Science, 7-9 november 2018, Alanya-Turkey [2] This study was supported by the Inonu University Scientific Research Projects Unit (TCD-2017-622) in Turkey
1 Department of Crop and Animal Production, Akcadag Vocational School, Malatya Turgut Özal University, TR-44210 Malatya
- TURKEY
2 Department of Veterinary Biometrics and Genetics, Faculty of Veterinary Medicine, Sivas Cumhuriyet University, TR-58140
Sivas - TURKEY
3 Department of Medical Biology and Genetics, Faculty of Veterinary Medicine, Afyon Kocatepe University, TR-03200
Afyonkarahisar - TURKEY
4 Etlik Veterinary Control Central Research Institute, TR-06100 Ankara - TURKEY
5 Department of Veterinary Zootechny, Faculty of Veterinary Medicine, Firat University, TR-23119 Elazig - TURKEY
a ORCID: 0000-0001-6491-9962; b ORCID: 0000-0002-2605-2410; c ORCID: 0000-0003-0975-1989; d ORCID: 0000-0002-0391-9456 e ORCID: 0000-0003-1082-4559; f ORCID: 0000-0003-4832-6205; g ORCID: 000-0002-3114-6411
Article ID: KVFD-2019-21844 Received: 25.01.2019 Accepted: 26.05.2019 Published Online: 27.05.2019
How to Cite This Article
Koseman A, Ozsensoy Y, Erdogan M, Yarali C, Toprak B, Zengin K, Seker I: CInvestigation of genetic structures of coloured horses by mtDNA
D-loop sequence analysis in Turkey. Kafkas Univ Vet Fak Derg, 25 (6): 769-778, 2019. DOI: 10.9775/kvfd.2018.21844
Abstract
The aim of this study was to determine the genetic structure of Coloured horses in Turkey by analysis of the D-loop sequence of mitochondrial DNA (mtDNA). A total of 28 Coloured horses were examined. DNA was extracted from blood samples using DNA isolation kit; 519 bp long mtDNA D-loop region was amplified by PCR and sequenced by capillary electrophoresis system. Population parameters and phylogenetic trees were drawn by using MEGA4 software package. It was also compared with the DNA sequences of horse populations from different countries. In this study, 42 different polymorphism regions and 10 different haplogroups were detected. Additionaly, Tajima D value was found to be -0.31 and population expansion was determined. It was determined that the base differences among the horses ranged between 0.000 and 0.032. It was detected that the horses formed different clusters from each other and they were intertwined with the populations of different countries. Moreover, it was also observed that some horses formed their own populations at different points from the other countries’ horses. As a result, it was observed that the genetic structures of horses which used in population were different from each other and they originated from different mothers. According to the results obtained, it is considered that Coloured horses can be a native horse breed of Turkey.
Keywords: Coloured horse, D-loop region, Haplogroup, Mitochondrial DNA
Türkiye’deki Alaca Atların mtDNA D-Loop Dizi Analizi İle Genetik
Yapılarının Araştırılması
Öz
Bu çalışma, Türkiye’deki Alaca atların mtDNA D-Loop dizi analizi ile genetik yapılarının belirlenmesi amacıyla yapılmıştır. Araştırmada, toplam 28 Alaca at incelenmiştir. Alınan kan örneklerinden DNA izolasyon kiti kullanılarak DNA elde edilmiş ve 519 bp uzunluğundaki mtDNA D-loop bölgesi PZR ile çoğaltılmış ve kapiller elektroforez sisteminde dizileme işlemi yapılmıştır. MEGA4 paket programı kullanılarak populasyon parametreleri ve filogenetik ağaçları çizilmiştir. Ayrıca farklı ülke at populasyonlarına ait DNA dizileri ile de karşılaştırılması yapılmıştır. Araştırmada, 42 farklı polimorfizm bölgesi ve 10 farklı haplogrup elde edilmiştir. Ayrıca Tajima D değeri -0.31 elde edilmiş ve populasyon genişlemesi olduğu belirlenmiştir. Örnekler arasındaki baz faklılıklarının 0.000 ile 0.032 arasında değiştiği belirlenmiştir. Çizilen filogenetik ağaçlar sonucunda örneklerin birbirlerinden farklı kümeler oluşturduğu ve farklı ülke populasyonları ile de iç içe girdiği belirlenmiştir. Ayrıca, bazı örneklerin farklı ülke atlarından tamamen ayrı noktalarda kendi populasyonunu oluşturduğu da gözlenmiştir. Sonuç olarak çalışılan populasyondaki örneklerin genetik yapılarının birbirinden farklı olduğu ve farklı analardan köken aldıkları görülmüştür. Elde edilen sonuçlara göre; Alaca atların Türkiye’ye ait yerli bir ırk olabileceği düşünülmektedir.
Anahtar sözcükler: Alaca at, D-loop bölgesi, Haplogrup, Mitokondrial DNA
İletişim (Correspondence)
+90 424 2370000/3939-00 Mobile: +90 533 6556394INTRODUCTION
In the archaeological and genetic studies, the origins of many
species were clearly stated [1]. Although there is no clear
information about the time and place where the horses were domesticated, it is reported that they were domesticated
in diff erent places at diff erent times [2]. It was stated that
Eurasian steppes are belived to be an important domestication
center [3]. Diff erent horse populations were also compared
in other studies, and it was found that horses were
domesticated in diff erent regions since the Iron Age [4].
As a result of the phylogenetic analysis, no relationship could be found between domestication of horses and
geographical places where they were bred [5]. It was
reported that at least 17 haplotypes of the oldest ancient
horse breeds have become extinct in the last 5500 years [4].
In a study carried out in indigenous stallions, which were found in Europe for many years, it was reported that
genetic diversity has decreased [6].
Native horse breeds of Turkey are decreasing in terms of number and genetic resources and pure breeding is interrupted as a result of the cross-mating of breeds. For this reason, it is important to take measures for preserving these breeds and to conduct molecular genetic analyses to guide these preservation programs. Due to genetic bottleneck, the population faces the danger of extinction. It is also very important to be able to maintain purebred
breeding and to develop economically important traits [7].
It was reported that populations created by using haplo-types obtained from horse studies may be used to classify ancient remains, to assess haplogroup variation in modern breeds, and to evaluate possible roles of horses in race performance [8].
Recently, Y chromosome (for paternal history) and the mitochondrial DNA (mtDNA) (for maternal history) were used in the evolutionary, phylogeographic and genetic
diversity studies [9-13]. In a study conducted in the United
States, mtDNA sequence analyses were found to be useful in eliminating doubts about the origin of horses, other than biological characteristics, and they may also be used in solving problems based on traditional assumptions
about Arabian horses with a close common ancestry [14].
In a study conducted for genetic characterization of diff erent horse breeds in Turkey using D-loop region of mtDNA and establishing a preservation program, it was determined that haplotype diversity was high; however, there was low nuclotide diversity. In addition, no valid genetic separation was detected among the breeds. Moreover, a phylogenetic tree was created using 22 horses representing seven haplogroups previously published and indigenous horses. mtDNA analysis of Turkish horses confirmed that many ancestral mare breeds were involved
in the domestication of the horses [15].
In a study conducted using the mitochondrial control region to determine the genetic variation in Ayvacık Pony, Malakan, Hınıs and Canik horses; the haplogroups showed
high diversity [16]. As a result of mtDNA sequence analysis
of 5 horse breeds in Turkey, 68 polymorphic regions and 151 haplotypes (Haplotype diversity, Hd: 0.9866±0.0017, nucleotide diversity, Pi: 0.021±0.00036, and average
nucleotide diversity, k: 8,006) were found [17].
Coloured horses are bred in a limited region especially in Ardahan, Kars and Iğdır provinces and have a small number of population in Turkey. In the literature review, there is no study found to define genetic identification of Coloured horses in Turkey by using the mtDNA D-loop sequence analysis. The aim of this study was to reveal the genetic structure of Coloured horses by analysis of the mtDNA D-loop sequence.
MATERIAL and METHODS
Preliminary Study and Determination of Specimens
In the present study, a preliminary field works were conducted to determine the number and characteristics of the animals as research materials to be investigated. Below are some photographs of Coloured horses taken during preliminary work in the field (Fig. 1, 2, 3, 4).
In the field studies conducted, it was found that the total number of Coloured horses in Turkey is 250-300, that horse owners usually have one or two horses, and that horses frequently change hands among the breeders in the region. In the field works, it was determined that some of the Coloured horses sire or dam were not Coloured, and there could be some challenges in collecting samples and data due to the difficulties in reaching some plateaus where horses are found. In samples collected for the study, attention was paid to the fact that horses were not close relatives.
Collection of Blood Samples and Isolation of DNA
Blood was drawn from the V. jugularis of 28 Coloured horses (bred in Ardahan, Kars, Iğdır, Erzurum and Malatya
provinces) and added into the anticoagulant (K3EDTA)
tubes. Blood samples were kept in the cold chain and delivered to the laboratory. In samples collected for the study, we paid attention to the fact that horses were not
close relatives. DNA isolation was performed by using an automated Qiagen Biorobot M48 DNA isolation system and MagAttract DNA Mini M48 kit (Catalog No. 953336).
Amplification and Genotyping of Control Region (D-loop) in Mitochondrial DNA
The control region (D-loop) in mitochondrial DNA (mtDNA) was amplified using the forward primer F7 (5’-CCA TCA ACA CCC AAA GCT GAA-3’) and the reverse primer R525 (5’-GTG AGC ATG GGC TGA TTA GTC-3’). Primers were designed using reference sequence (GenBank accession number
AF064628.1) with FastPCR Professional 6.2.1 software [18].
A 25 µL PCR mixture consisted of 40 ng DNA, 6 μM of
each primer, 2.4 mM MgCl2, 1×PCR buff er, 0.2 mM dNTP
mix and 1 U Platinum Taq DNA Polymerase (Invitrogen, Carlsbad, CA, U.S.A.). Pre-denaturation phase of PCR was programmed to be at 94°C for 2 min, denaturation at 94°C for 30 sec, annealing at 58°C for 30 sec, and extension at 72°C for 1 min by 35 cycles and final extension at 72°C for 10 min.
For DNA sequencing analysis, a total of 20 μL reaction mixture was prepared containing 2 μL of Big Dye 3.1, 11 μL of 1X Sequencing Buff er, 5 μL of forward or reverse primer (1 pmol) and 2 μL of PCR product. The PCR was programmed for 30 sec at 96°C for pre-denaturation, 10 sec at 96°C for separation, 15 sec at 50°C for annealing and 4 min at 60°C for extention by 30 cycles. PCR products were cleaned with Bigdye XTherminator and sequencing was performed by Genetic Analyzer (ABI 3500).
Statistical Analysis
As a result of DNA sequencing analysis, D-loop region of mtDNA sequences were edited and assembled using Sequencher 5.4.6 (Gene Codes Corporation, Ann Arbor, MI, USA). Subsequently, all of sequences were aligned in
BioEdit 7.0.9 Sequence Alignment software [19].
The evolutionary relationship between the horses
studied was carried out using the UPGMA method [20]
with the 1000-iterations Bootstrap test [21]. In addition,
D-loop region of mtDNA reference sequences belonging to these populations were obtained from the National Center for Biotechnology Information (NCBI) databases and a phylogenetic tree was drawn in order to examine the relationship among horse populations in diff erent countries. To determine whether the population has under-gone mutation or natural selection, Tajima’s neutrality test [22] was conducted.
The positions of the polymorphic nucleotides of Coloured horses, the evolutionary relationship among the horses studied and the neutrality test results were analyzed
using the Maximum Composite Likelihood method [23] of
the MEGA4 software [24]. All positions, including missing
data and spaces, were removed from the data set and all sequences were brought to the same size. Analyses
Fig 2. Coloured horse in Kars-Turkey
Fig 3. Coloured horses in Malatya-Turkey
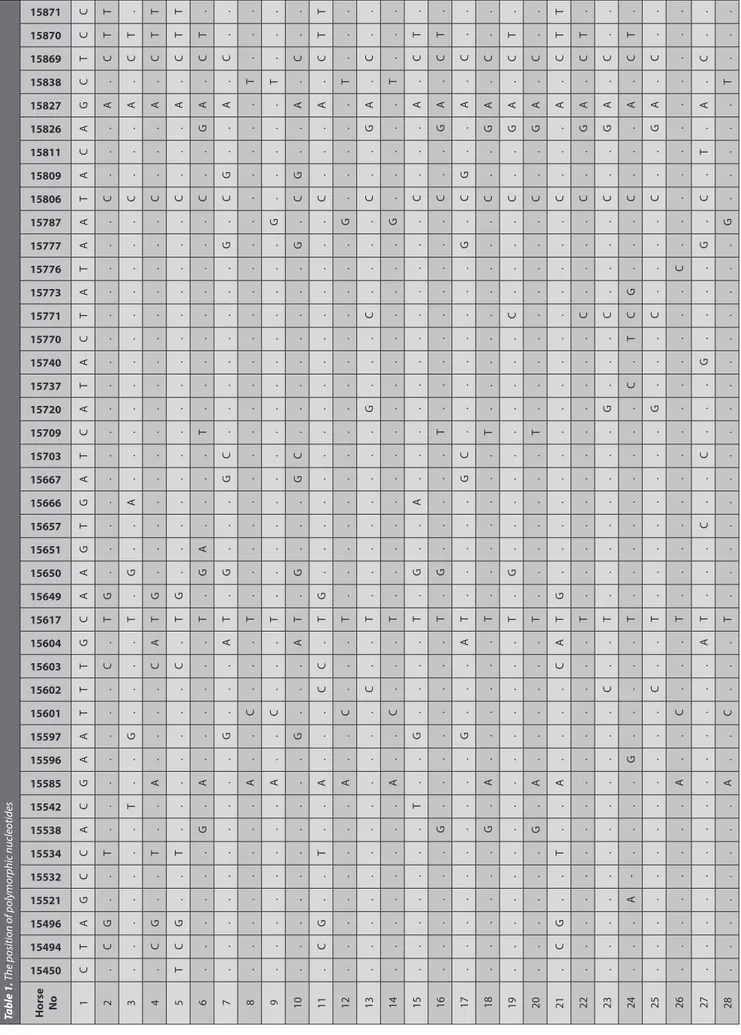
Table 1. T he p osition of p olymorphic n ucleotides Horse No 15450 15494 15496 15521 15532 15534 15538 15542 15585 15596 15597 15601 15602 15603 15604 15617 15649 15650 15651 15657 15666 15667 15703 15709 15720 15737 15740 15770 15771 15773 15776 15777 15787 15806 15809 15811 15826 15827 15838 15869 15870 15871 1 C T A G C C A C G A A T T T G C A A G T G A T C A T A C T A T A A T A C A G C T C C 2 . C G . . T . . . . . . . C . T G . . . . . . . . . . . . . . . . C . . . A . C T T 3 . . . . . . . T . . G . . . . T . G . . A . . . . . . . . . . . . C . . . A . C T . 4 . C G . . T . . A . . . . C A T G . . . . . . . . . . . . . . . . C . . . A . C T T 5 T C G . . T . . . . . . . C . T G . . . . . . . . . . . . . . . . C . . . A . C T T 6 . . . . . . G . A . . . . . . T . G A . . . . T . . . . . . . . . C . . G A . C T . 7 . . . . . . . . . . G . . . A T . G . . . G C . . . . . . . . G . C G . . A . C . . 8 . . . . . . . . A . . C . . . T . . . . . . . . . . . . . . . . . . . . . . T . . . 9 . . . . . . . . A . . C . . . T . . . . . . . . . . . . . . . . G . . . . . T . . . 10 . . . . . . . . . . G . . . A T . G . . . G C . . . . . . . . G . C G . . A . C . . 11 . C G . . T . . A . . . C C . T G . . . . . . . . . . . . . . . . C . . . A . C T T 12 . . . . . . . . A . . C . . . T . . . . . . . . . . . . . . . . G . . . . . T . . . 13 . . . . . . . . . . . . C . . T . . . . . . . . G . . . C . . . . C . . G A . C . . 14 . . . . . . . . A . . C . . . T . . . . . . . . . . . . . . . . G . . . . . T . . . 15 . . . . . . . T . . G . . . . T . G . . A . . . . . . . . . . . . C . . . A . C T . 16 . . . . . . G . . . . . . . . T . G . . . . . T . . . . . . . . . C . . G A . C T . 17 . . . . . . . . . . G . . . A T . . . . . G C . . . . . . . . G . C G . . A . C . . 18 . . . . . . G . A . . . . . . T . . . . . . . T . . . . . . . . . C . . G A . C . . 19 . . . . . . . . . . . . . . . T . G . . . . . . . . . . C . . . . C . . G A . C T . 20 . . . . . . G . A . . . . . . T . . . . . . . T . . . . . . . . . C . . G A . C . . 21 . C G . . T . . A . . . . C A T G . . . . . . . . . . . . . . . . C . . . A . C T T 22 . . . . . . . . . . . . . . . T . . . . . . . . . . . . C . . . . C . . G A . C T . 23 . . . . . . . . . . . . C . . T . . . . . . . . G . . . C . . . . C . . G A . C . . 24 . . . A -. . . . G . . . . . T . . . . . . . . . C . T C G . . . C . . . A . C T . 25 . . . . . . . . . . . . C . . T . . . . . . . . G . . . C . . . . C . . G A . C . . 26 . . . . . . . . A . . C . . . T . . . . . . . . . . . . . . C . . . . . . . . . . . 27 . . . . . . . . . . . . . . A T . . . C . . C . . . G . . . . G . C . T . A . C . . 28 . . . . . . . . A . . C . . . T . . . . . . . . . . . . . . . . G . . . . . T . . .
were performed over a total of 519 bases. Haplogroups were determined according to the mtDNA terminology reported by Achilli et al.[8].
The Ethics Committee Approval for the study was obtained from Inönü University Experimental Animals Local Ethics Committee (2017/A-30).
RESULTS
In the study, 519 bp of the mtDNA D-loop region for 28 Coloured horses from Turkey were analysed and 42 polymorphic sites were determined (Table 1).
The haplogroups determined according to the polymorphism regions obtained in individuals are shown in Table 2. Ten diff erent haplogroups were identified and the frequency of haplogroup N was observed a high (21.43%) in this study.
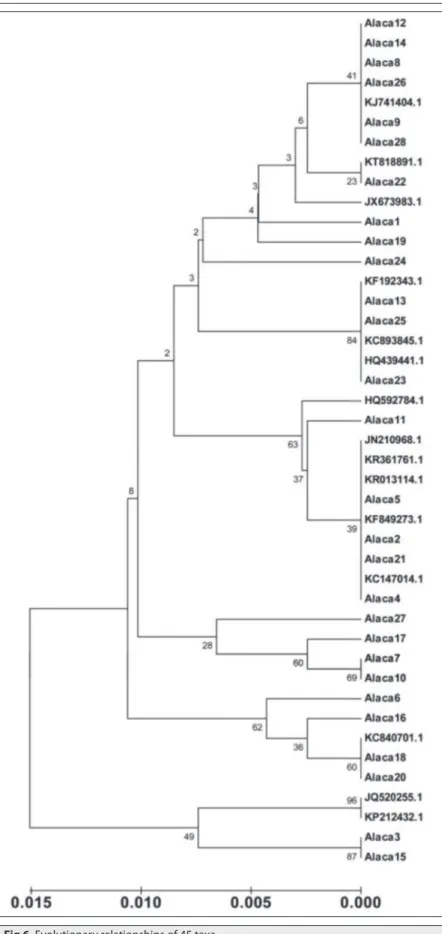
The evolutionary history was inferred using the UPGMA method (Fig. 5). The total branch length in the evolutionary relationship was measured as 0.1026. It was observed that the horses were genetically separated from each other, but they were clustered in 4 groups, and 1 horse (sample no. 24) was placed alone in a separate place from the other horses. The relationship between horses used in the study and the horse populations of diff erent countries was also examined (Fig.
6). It was observed that the horses in the
population studied were intertwined with very different horse populations, but a certain number of Coloured horse samples were not mixed with other populations and remained in their own populations.
Estimates of evolutionary differentiation and standard errors between the calculated DNA sequences according to the paired comparison of the base differences in the DNA sequences of Coloured horses studied are shown in Table 3. It was determined that the base diff erences between horses ranged from 0.000 to 0.032. The highest base diff erence was observed between horses 7, 9, 10, 14 and 28 with 5, and between horses 7 and 10 with 11. It was observed that there was no base diff erence among horses 9, 14 and 28, horses 13, 23 and 25, and between horses 20 and 18, horse 15 and 3, and horse 21 and 4.
Table 2. Haplogroups identified
Haplogroups N Frequences (%) A 3 10.71 C 2 7.14 D 1 3.57 E 2 7.14 I 4 14.29 L 5 17.86 M 1 3.57 N 6 21.43 P 3 10.71 Q 1 3.57
Tajima neutrality D test results are shown in Table 4. It was determined that the nucleotide diversity was 1.89% and the Tajima D value was -0.31.
DISCUSSION
It is reported that mtDNA represents ancestral
genetic diversity in horse populations [4,5].
Studies conducted on native horse breeds reported 23 to 43 diff erent polymorphic regions, 2 to 164 haplotypes and 6 to 14
haplo-groups in D-loop region of mtDNA [25-32].
In the studies where samples from many diff erent regions were evaluated together, between 31 to 39 different polymorphic regions and haplogroups ranging from 17 to 68, and 19 to 33 haplotypes were
identified [33-35]. In addition, a total of 99
polymorphic regions and 97 haplotypes were found as a result of the entire D-loop of mtDNA sequence analysis of the Arabian
horse breed in Middle Eastern countries [36].
Although the number of horses in this study is low unlike other studies, the number of regions showing polymorphism (42) and the number of haplogroups (10) are high and this suggests that these horses may have many ancestral origins.
As a result of mtDNA sequence analysis conducted in 5 native horse breeds of Turkey, 68 polymorphic regions were identified; 54 haplogroups and 151 haplotypes were
detected [17]. In this study, although a small
number of horses were studied from a single population, similar results were obtained. In the study where many horse breeds of diff erent countries were compared, distance of base diff erences of Anatolia and Çukurova horse breeds of Turkey was found to be
0.005 [33]. In this study, it was determined
that the base diff erences in the population ranged between 0.000 and 0.032. According to the results obtained, it was observed that the base diff erences within the same population are larger than the base diff erences among the diff erent populations. As a result of these findings, it was considered that the Coloured horse population has more diff erent genotypes and may have diff erent ancestral origins.
In a study where 18 diff erent haplogroups were obtained in horses from different continents, haplogroups outside of D and E were reported to be located in the Middle
Fig 6. Evolutionary relationships of 45 taxa
Alaca: Coloured Horse; JX673983.1: Ethiopian horse; HQ439441.1: Akal Teke; HQ592784.1: Native Canadian Horse; JN210968.1: Iranian native horse; JQ520255.1: Noriker Horse; KC147014.1: Franches-Montagnes; KF192343.1: Italian Ventasso horse; KC840701.1: Arabian horse; KF849273.1: Vladimir heavy draught; KJ741404.1: Icelandic horse; KC893845.1: Celtic horse; KP212432.1: Draft horse; KR013114.1: Italian Salernitano horse; KR361761.1: Welsh Pony, section A; KT818891.1: Hungarian Gidran horse
Table 3. Estimat es of ev olutionar y differ entiation b et w
een DNA sequenc
es (v
er
tic
al triangles) and standar
d err
ors (in
verse right triangle)
Horse No 1 2 3 4 5 6 7 8 9 10 11 12 13 14 15 16 17 18 19 20 21 22 23 24 25 26 27 28 1 0.007 0.006 0.007 0.007 0.006 0.006 0.004 0.004 0.006 0.007 0.005 0.006 0.004 0.006 0.006 0.006 0.005 0.005 0.005 0.007 0.005 0.006 0.007 0.006 0.004 0.006 0.004 2 0.022 0.006 0.002 0.003 0.007 0.008 0.007 0.007 0.008 0.003 0.008 0.007 0.007 0.006 0.006 0.007 0.006 0.006 0.006 0.002 0.005 0.007 0.007 0.007 0.007 0.007 0.007 3 0.018 0.020 0.007 0.007 0.005 0.006 0.006 0.007 0.006 0.007 0.007 0.006 0.007 0.000 0.004 0.006 0.006 0.004 0.006 0.007 0.004 0.006 0.006 0.006 0.006 0.006 0.007 4 0.026 0.004 0.024 0.004 0.006 0.008 0.007 0.007 0.008 0.003 0.008 0.007 0.007 0.007 0.006 0.007 0.006 0.006 0.006 0.000 0.006 0.007 0.007 0.007 0.007 0.007 0.007 5 0.026 0.004 0.024 0.008 0.007 0.008 0.008 0.008 0.008 0.004 0.008 0.007 0.008 0.007 0.007 0.008 0.007 0.007 0.007 0.004 0.006 0.007 0.007 0.007 0.008 0.008 0.008 6 0.022 0.024 0.016 0.024 0.028 0.007 0.006 0.007 0.007 0.007 0.007 0.006 0.007 0.005 0.003 0.007 0.003 0.004 0.003 0.006 0.005 0.006 0.007 0.006 0.006 0.007 0.007 7 0.022 0.028 0.016 0.028 0.032 0.023 0.007 0.007 0.000 0.008 0.008 0.006 0.007 0.006 0.006 0.002 0.006 0.006 0.006 0.008 0.006 0.006 0.007 0.006 0.007 0.005 0.007 8 0.008 0.026 0.022 0.026 0.030 0.022 0.026 0.002 0.007 0.007 0.003 0.006 0.002 0.006 0.006 0.007 0.005 0.006 0.005 0.007 0.006 0.006 0.007 0.006 0.003 0.006 0.002 9 0.010 0.028 0.024 0.028 0.032 0.024 0.028 0.002 0.007 0.007 0.002 0.006 0.000 0.007 0.007 0.007 0.006 0.006 0.006 0.007 0.006 0.006 0.007 0.006 0.003 0.007 0.000 10 0.022 0.028 0.016 0.028 0.032 0.023 0.000 0.026 0.028 0.008 0.008 0.006 0.007 0.006 0.006 0.002 0.006 0.006 0.006 0.008 0.006 0.006 0.007 0.006 0.007 0.005 0.007 11 0.026 0.004 0.024 0.004 0.008 0.024 0.032 0.026 0.028 0.032 0.008 0.007 0.007 0.007 0.007 0.008 0.006 0.006 0.006 0.003 0.006 0.007 0.007 0.007 0.007 0.007 0.007 12 0.012 0.030 0.026 0.030 0.030 0.026 0.030 0.004 0.002 0.030 0.030 0.007 0.002 0.007 0.007 0.007 0.006 0.007 0.006 0.008 0.006 0.007 0.008 0.007 0.004 0.007 0.002 13 0.016 0.022 0.018 0.026 0.026 0.018 0.021 0.020 0.022 0.021 0.022 0.024 0.006 0.006 0.005 0.006 0.005 0.004 0.005 0.007 0.003 0.000 0.006 0.000 0.006 0.006 0.006 14 0.010 0.028 0.024 0.028 0.032 0.024 0.028 0.002 0.000 0.028 0.028 0.002 0.022 0.007 0.007 0.007 0.006 0.006 0.006 0.007 0.006 0.006 0.007 0.006 0.003 0.007 0.000 15 0.018 0.020 0.000 0.024 0.024 0.016 0.016 0.022 0.024 0.016 0.024 0.026 0.018 0.024 0.004 0.006 0.006 0.004 0.006 0.007 0.004 0.006 0.006 0.006 0.006 0.006 0.007 16 0.018 0.020 0.012 0.024 0.024 0.004 0.020 0.022 0.024 0.020 0.024 0.026 0.014 0.024 0.012 0.006 0.003 0.003 0.003 0.006 0.004 0.005 0.006 0.005 0.006 0.006 0.007 17 0.020 0.026 0.018 0.026 0.030 0.025 0.002 0.024 0.026 0.002 0.030 0.028 0.020 0.026 0.018 0.021 0.006 0.006 0.006 0.007 0.006 0.006 0.007 0.006 0.007 0.005 0.007 18 0.016 0.022 0.018 0.022 0.026 0.006 0.021 0.016 0.018 0.021 0.022 0.020 0.012 0.018 0.018 0.006 0.019 0.005 0.000 0.006 0.004 0.005 0.006 0.005 0.005 0.006 0.006 19 0.016 0.018 0.010 0.022 0.022 0.010 0.018 0.020 0.022 0.018 0.022 0.024 0.008 0.022 0.010 0.006 0.020 0.012 0.005 0.006 0.002 0.004 0.005 0.004 0.006 0.006 0.006 20 0.016 0.022 0.018 0.022 0.026 0.006 0.021 0.016 0.018 0.021 0.022 0.020 0.012 0.018 0.018 0.006 0.019 0.000 0.012 0.006 0.004 0.005 0.006 0.005 0.005 0.006 0.006 21 0.026 0.004 0.024 0.000 0.008 0.024 0.028 0.026 0.028 0.028 0.004 0.030 0.026 0.028 0.024 0.024 0.026 0.022 0.022 0.022 0.006 0.007 0.007 0.007 0.007 0.007 0.007 22 0.014 0.016 0.012 0.020 0.020 0.012 0.020 0.018 0.020 0.020 0.020 0.022 0.006 0.020 0.012 0.008 0.018 0.010 0.002 0.010 0.020 0.003 0.005 0.003 0.006 0.006 0.006 23 0.016 0.022 0.018 0.026 0.026 0.018 0.021 0.020 0.022 0.021 0.022 0.024 0.000 0.022 0.018 0.014 0.020 0.012 0.008 0.012 0.026 0.006 0.006 0.000 0.006 0.006 0.006 24 0.022 0.024 0.020 0.028 0.028 0.024 0.028 0.026 0.028 0.028 0.028 0.030 0.018 0.028 0.020 0.020 0.026 0.022 0.014 0.022 0.028 0.012 0.018 0.006 0.007 0.007 0.007 25 0.016 0.022 0.018 0.026 0.026 0.018 0.021 0.020 0.022 0.021 0.022 0.024 0.000 0.022 0.018 0.014 0.020 0.012 0.008 0.012 0.026 0.006 0.000 0.018 0.006 0.006 0.006 26 0.008 0.026 0.022 0.026 0.030 0.022 0.026 0.004 0.006 0.026 0.026 0.008 0.020 0.006 0.022 0.022 0.024 0.016 0.020 0.016 0.026 0.018 0.020 0.026 0.020 0.006 0.003 27 0.020 0.026 0.022 0.026 0.030 0.026 0.014 0.024 0.026 0.014 0.030 0.028 0.020 0.026 0.022 0.022 0.012 0.020 0.020 0.020 0.026 0.018 0.020 0.026 0.020 0.024 0.007 28 0.010 0.028 0.024 0.028 0.032 0.024 0.028 0.002 0.000 0.028 0.028 0.002 0.022 0.000 0.024 0.024 0.026 0.018 0.022 0.018 0.028 0.020 0.022 0.028 0.022 0.006 0.026
East [8]. In the study of mountain horse breeds of Bulgaria,
it was reported that mainly Eastern and Western Eurasia and
Middle East haplotypes were found [35]. In this study, it was
observed that three Coloured horses in D and E haplogroups were found in haplogroups of Northern Europe horses and the horses in other haplogroups were found in haplogroups of Central Asia and the Middle East horses. There are studies showing that F haplogroup is a
haplo-group specific to E. przewalskii wild horses [8]. Studies have
shown that Arabian horses in the Middle East (Khanshour
and Chothran, 2013), Bulgarian horse breeds [35] and native
horse breeds in Asia and Caucasia [32,37] do not have F
haplogroup. Similar to other studies, this study showed that F haplogroup was not present in Coloured horses in Turkey close to above mention regions. Since horses included in this study are in the haplogroup of horses of Central Asia and the Middle East, similar results were obtained with those horse breeds in these countries. It was reported that in Kabardey horse breed of North Caucasus, the highest haplogroup rate was observed to be 19% in G haplogroup, and this was followed by L, Q and B
haplogroups, approximately 12% [32]. In this study, 24 out
of 28 horse samples were collected from Erzurum, Kars and Ardahan provinces under the influence of Caucasus region and there was no G and B haplogroup detected; while L (5 horses, 17.86%) and Q (1 horse, 3.57%) haplogroups were detected. It was considered that because the Coloured horse population in Turkey has the haplogroups of horses of Central Asia and in the Middle East, Coloured horses population may be originated from the Eurasia region centre of domestication.
Phylogenetic trees indicate that populations with similar nucleotide sequences have more recent common ancestry than populations with different nucleotide sequences. As a result of the studies carried out on Asian, European, Middle East and American horse populations, it was detected that while all samples from these countries are divided into 2 groups in phylogenetic tree, they were in mixture with
each other [8]. In other studies, it was reported that except
one horse breed, the other horse breeds studied were in mixture with each other [25,28,36].
In a study conducted in 5 native horse breeds of Turkey, it was detected that there was no breed specific pylogenetic
group and they were in mixture with each other [17]. In
this study, although there is only one horse population, the samples were collected from different regions. It was determined that these horses were in mixture with
each other and did not show a similar clustering as a single population. It was considered that the native horse breeds in many countries do not form their own groups as in this study, since the domestication regions of horses are different, and that they may have different ancestral origins and uncontrolled mating programs.
When neutrality tests and phylogenetic trees are inter-preted, more detailed information can be obtained about the history of populations. In order to determine whether populations have undergone mutation and natural selection,
Tajima’s neutrality test was used [38,39]. When nucleotide
diversity (1.89%) was compared with the number of polymorphic regions (42) in the Coloured horse population used in this study, it was detected that Tajima D has a negative value (-0.31), and that there was a population expansion, albeit small, in the investigated population. In the studies in which D-loop region of mtDNA was investigated, the nucleotide diversity was found between
1.52 and 2.8% [26,28,31,35,36] and 2.1% in 5 native horse breeds
of Turkey [17]. In this study, nucleotide diversity was found
to be 1.89%, similar to those of these studies.
In the study, it was found that Korean horse breed was located in the same cluster as the Mongol horse breed,
which was reported to be its ancestor [40] and there has been
a close genetic relationship between Chinese Mongolian
horses and other Mongolian horses [37]. Likewise, it is
necessary to carry out additional studies that evaluate these horses and other horse breeds that are likely to be their ancestors and found in the same habitats with the Coloured horse breed.
As a result, according to the study findings, it was under-stood that the genetic structures of the horses examined are different from each other. Horses originate from different mothers, except a small number of horses. In addition, in this study where the horse population was compared with horse populations from different countries; it was detected that Coloured horses were located at different phylogenetic cluster compared with other horses breeds. This suggests that Coloured horses have had their own genotype characteristics over time. It is necessary to determine whether this horse population is separated from the other native horse breeds of Turkey and horse breeds of nearby countries, and to register them as a different breed.
C
ompetingi
nterestsThe authors declare that they have no conflict of interest.
Table 4. Results of Tajima’s Neutrality Test
N S Ps Θ π D
28 42 0.080153 0.020597 0.018882 -0.311316
n = Total number of samples; S = Total number of polymorphic regions; ps = Ratio of bases that show difference; Θ = Rate of mutation in population; π =
REFERENCES
1. Bruford MW, Bradley DG, Luikart G: DNA markers reveal the
complexity of livestock domestication. Nat Rev Genet, 4 (11): 900-910, 2003. DOI: 10.1038/nrg1203
2. Jansen T, Forster P, Levine MA, Oelke H, Hurles M, Renfrew C, Weber J, Olek K: Mitochondrial DNA and the origins of the domestic
horse. Proc Natl Acad Sci USA, 99 (16): 10905-10910, 2002. DOI: 10.1073/ pnas.152330099
3. McGahern A, Bower MAM, Edwards CJ, Brophy PO, Sulimova G, Zakharov I, Vizuete-Forster M, Levine M, Li S, MacHugh DE, Hill EW:
Evidence for biogeographic patterning of mitochondrial DNA sequences in Eastern horse populations. Anim Genet, 37, 494-497, 2006. DOI: 10.1111/ j.1365-2052.2006.01495.x
4. Cieslak M, Pruvost M, Benecke N, Hofreiter M, Morales A, Reissmann M, Ludwig A: Origin and history of mitochondrial DNA lineages in
domestic horses. PLoS One, 5 (12): e15311, 2010. DOI: 10.1371/journal. pone.0015311
5. Yoon SH, Kim J, Shin D, Cho S, Kwak W, Lee HK, Park KD, Kim H:
Complete mitochondrial genome sequences of Korean native horse from Jeju Island: Uncovering the spatio-temporal dynamics. Mol Biol Rep, 44, 233-242, 2017. DOI: 10.1007/s11033-017-4101-8
6. Wutke S, Sandoral CE, Benecke N, Döhle HJ, Friederich S, Gonzalez J, Hofreiter M, Lougas L, Magnell O, Malaspinas AS, Morales-Muniz A, Orlando L, Reissmann M, Trinks A, Ludwig A: Decline of genetic
diversity in ancient domestic stallions in Europe. Sci Adv, 4:eaap9691, 2018. DOI: 10.1126/sciadv.aap9691
7. Korkmaz Ağaoğlu Ö, Ertuğrul O: Mikrosatellitlerin önemi ve kullanım
alanları. Vet Hekim Der Derg, 81 (1): 39-43, 2010.
8. Achilli A, Olivieri A, Soares P, Lancioni H, Hooshiar Kashani B, Perego UA, Nergadze SG, Carossa V, Santagostino M, Capomaccio S, Felicetti M, AlAchkar W, Penedo MCT, Verini-Supplizi A, Houshmand M, Woodward SR, Semino O, Silvestrelli M, Giulotto E, Pereira L, Bandelt HJ, Torroni A: Mitochondrial genomes from modern horses
reveal the major haplogroups that underwent domestication. Proc Natl
Acad Sci USA, 109 (7): 2449-2454, 2012. DOI: 10.1073/pnas.1111637109
9. Seyedabadi HR, Sofla SS: Microsatellite analysis for parentage
verification and genetic characterization of the Turkmen Horse population. Kafkas Univ Vet Fak Derg, 23 (3): 467-471, 2017. DOI: 10.9775/ kvfd.2016.17096
10. Der Sarkissian C, Ermini L, Schubert M, Yang MA, Librado P, Fumagalli M, Jónsson H, Bar-Gal GK, Albrechtsen A, Vieira FG, Petersen B, Ginolhac A, Seguin-Orlando A, Magnussen K, Fages A, Gamba C, Lorente-Galdos B, Polani S, Steiner C, Neuditschko M, Jagannathan V, Feh C, Greenblatt CL, Ludwig A, Abramson NI, Zimmermann W, Schafberg R, Tikhonov A, Sicheritz-Ponten T, Willerslev E, Marques-Bonet T, Ryder OA, McCue M, Rieder S, Leeb T, Slatkin M, Orlando L:
Evolutionary genomics and conservation of the endangered Przewalski’s horse. Curr Biol, 25, 2577–2583, 2015. DOI: 10.1016/j.cub.2015.08.032
11. Cardinali I, Lancioni H, Giontella A, Capodiferro MR, Capomaccio S, Buttazzoni L, Biggio GP, Cherchi R, Albertini E, Olivieri A, Cappelli K, Achilli A, Silvestrelli M: An overview of ten italian horse breeds
through mitochondrial DNA. PLoS One, 11 (4): e0153004, 2016. DOI: 10.1371/journal.pone.0153004
12. Cinar Kul B, Bilgen N, Akyüz B, Ertuğrul O: Molecular phylogeny of
Anatolian and Cypriot donkey populations based on mitochondrial DNA and Y-chromosomal STRs. Ankara Üniv Vet Fak Derg, 63, 143-149, 2016
13. Sziszkosz N, Mihók S, Jávor A, Kusza SZ: Genetic diversity of the
Hungarian Gidran horse in two mitochondrial DNA markers. Peer J, 4:e1894, 2016. DOI: 10.7717/peerj.1894
14. Bowling AT, Del Valle A, Bowling M: A pedigree-based study of
mitochondrial D-loop DNA sequence variation among Arabian horses.
Anim Genet, 31 (1): 1-7, 2000.
15. Aslan Ö: The conservation of genetic diversity in Turkish native horse
breeds, MSc Thesis. Boğaziçi University, İstanbul, 2009.
16. Koban E, Denizci M, Aslan O, Aktopraklıgil D, Aksu S, Bower
M, Balcıoğlu BK, Özdemir Bahadır A, Bilgin R, Erdağ B, Bağış H, Arat S:
High microsatellite and mitochondrial diversity in Anatolian native horse breeds shows Anatolia as a genetic conduit between Europe and Asia.
Anim Genet, 43 (4): 401-409, 2012. DOI: 10.1111/j.1365-2052.2011.02285.x
17. Aksu S, Aktopraklıgil D, Koban E, Aslan Ö, Denizci M, Balcıoğlu K, Özdemir Bahadır A, Erdağ B, Bağış H, Arat S: Gen kaynaklarının
ve biyoçeşitliliğin korunması kapsamında yerli at ırklarının genetik karakterizasyonu. Biyol Bilim Araş Derg, 3 (1): 121-130, 2010.
18. Kalendar R, Lee D, Schulman AH: FastPCR Software for PCR primer
and probe design and repeat search. Genes Genomes Genomics, 3 (1): 1-14, 2009.
19. Hall TA: BioEdit: A user-friendly biological sequence alignment editor
and analysis program for Windows 95/98/NT. Nuclic Acids Symp Ser, 41, 95-98, 1999.
20. Sneath PHA, Sokal RR: Numerical Taxonomy. Freeman, San Francisco.
1973.
21. Felsenstein J: Confidence limits on phylogenies: An approach using the
bootstrap. Evolution, 39, 783-791, 1985. DOI: 10.1111/j.1558-5646.1985. tb00420.x
22. Tajima F: Statistical methods to test for nucleotide mutation
hypothesis by DNA polymorphism. Genet, 123, 585-595, 1989.
23. Tamura K, Nei M, Kumar S: Prospects for inferring very large
phylogenies by using the neighbor-joining method. Proc Natl Acad Sci
USA, 101, 11030-11035, 2004. DOI: 10.1073/pnas.0404206101
24. Tamura K, Dudley J, Nei M, Kumar S: MEGA4: Molecular Evolutionary
Genetics Analysis (MEGA) software version 4.0. Mol Biol Evol, 24 (8): 1596-1599, 2007. DOI: 10.1093/molbev/msm092
25. Cozzi MC, Strillacci MG, Valiati P, Bighignoli B, Cancedda M, Zanotti M: Mitochondrial D-loop sequence variation amnong Italian
horse breeds. Genet Sel Evol, 36, 663-672, 2004. DOI: 10.1051/gse:2004023
26. Lopes MS, Mendonça D, Cymbron T, Valera M, da Costa-Ferreira J, da Camara Machado A: The Lusitano horse maternal lineage based on
mitochondrial D-loop sequence variation. Anim Genet, 36, 196-202, 2005. DOI: 10.1111/j.1365-2052.2005.01279.x
27. Kusza S, Priskin K, Ivankovic A, Jedrzejewska B, Podgorski T, Jávor A, Mihók S: Genetic characterization and population bottleneck
in the Hucul horse based on microsatellite and mitochondrial data. Biol J
Linn Soc, 109, 54-65, 2013. DOI: 10.1111/bij.12023
28. Gemingguli M, Iskhan KR, Li Y, Qi A, Wunirifu W, Ding LY, Wumaierjiang A: Genetic diversity and population structure of Kazakh
horses (Equus caballus) inferred from mtDNA sequences. Genet Mol Res, 15 (4): gmr.15048618, 2016. DOI: 10.4238/gmr.15048618
29. Cieslak J, Wodas L, Borowska A, Cothran EG, Khanshour AM, Mackowski M: Characterization of the polish Primitive Horse (Konik)
maternal lines using mitochondrial D-loop sequence variation. Peer J, 5:e3714, 2017. DOI: 10.7717/peerj.3714
30. Senju N, Tozaki T, Kakoi H, Shinjo A, Matsuyama R, Almunia J, Takasu M: Genetic diversity of the yonaguni horse based on
polymorphisms in microsatellites and mitochondrial DNA. J Vet Med Sci, 79 (2): 425-431, 2017. DOI: 10.1292/jvms.16-0040
31. Csizmar N, Mihok S, Javor A, Kusza S: Genetic analysis of the
Hungarian draft horse population using partial mitochondrial DNA D-loop sequencing. Perr J, 6:e4198, 2018. DOI: 10.7717/peerj.4198
32. Khaudov AD, Duduev AS, Kokov ZA, Amshokov KK, Zhekamukhov MKH, Zaitsev AM, Reissmann M: Genetic analysis of maternal and
paternal lineages in Kabardian horses by uniparental molecular markers.
Open Vet J, 8 (1): 40-46, 2018. DOI: 10.4314/ovj.v8i1.7
33. Hill EW, Bradley DG, Al-Barody M, Ertugrul O, Splan RK, Zakharov I, Cunningham EP: History and integrity of thoroughbred dam lines
revealed in equine mtDNA variation. Anim Genet, 33, 287-294, 2002
34. Zuccaro A, Bordonaro S, Longeri M, Cozzi MC, Guastella AM, Criscione A, D’Urso G, Marletta D: Mitochondrial DNA control region
variation in Sanfratellano horse and two other Sicilian autochthonous breeds. Ital J Anim Sci, 8 (2): 180-182, 2009. DOI: 10.4081/ijas.2009.s2.180
I, Radoslavov G: Mitochondrial diversity in mountain horse population
from the South-Eastern Europe. Mitochondrial DNA, 28 (6): 787-792, 2017. DOI: 10.1080/24701394.2016.1186667
36. Khanshour AM, Cothran EG: Maternal phylogenetic relationships
and genetic variation among Arabian horse populations using whole mitochondrial DNA D-loop sequencing. BMC Genet, 14:83, 2013. DOI: 10.1186/1471-2156-14-83
37. Li J, Shi Y, Fan C, Manglai D: mtDNA diversity and origin of Chinese
Mongolian horses. Asian Aust J Anim Sci, 21 (12): 1696-1702, 2008.
38. Innan H, Stephan W: The coalescent in an exponentially growing
metapopulation and its application to Arabidopsis thaliana. Genetics, 155, 2015–2019, 2000.
39. McVean GA: A genealogical interpretation of linkage disequilibrium.
Genetics, 162 (2): 987-991, 2002.
40. Kim KI, Yang YH, Lee SS, Park C, Ma R, Bouzat JL, Lewin HA:
Phylogenetic relationships of Cheju horses to other horse breeds as determined bt mtDNA D-loop sequence polymorphism. Anim Genet, 30, 102-108, 1999.