BMI, Physical Activity, Sleep Quality, Eating Attitudes,
Emotions: Which One is Affected by Mindful Eating?
Gizem Köse
1, Muhittin Tayfur
21Department of Nutrition and Dietetics, Istanbul Kent University, Istanbul, Turkey - E-mail: [email protected] 2Department of Nutrition and Dietetics, Baskent University, Ankara, Turkey
Summary. Present study, it was aimed to examine the eating attitude and mindful eating status of students and to examine the change of mindful eating status’ besides informing with nutrition course. The study was executed by 318 healthy students aged 18-45 years, randomly selected among students studying at Uskudar University between September 2015 and May 2016. In addition to a survey form containing personal and health information of the students, the Eating Attitudes Test (EAT-40) was conducted by Savasir and Erol, and the Mindful Eating Questionnare-30 (MEQ-30) scale conducted by Turkish Kose et al. The mean age of the participants was 21.56 ± 3.82 year. The mean score of the participants’ EAT-40 score was found to be 24.22 ± 13.98 and the mean score of the MEQ was 98.11 ± 13.81. As the EAT-40 scores decreased, MEQ scores increased, but this relationship was not statistically significant (p> 0.05). It has been shown that 28.9% of students have an eating disorder risk. There was no statistically significant difference between men’s (23.33 ± 15.60) and women’s (24.48 ± 13.50) mean EAT-40 scores (p>0.05). Overweight-obese group was found to be having higher EAT-40 scores than the other BMI classes (p <0.05). While the students' body weight and BMI increased, the risk of eating disorder increased (r = 0.112, p <0.05 and r = 0.139, p <0.05), and mindful eating decreased (p> 0.05). A significant relationship was found between weight, BMI and MEQ subscales (r =-0.252, p <0.01 and r =-0.208, p<0.01). As food preferences evaluated, 33.3% of students that is vegan, 26.4% of the students that have no food preference and 24.1% of the students that don’t eat red meat were at risk of eating disorder (p <0.05). There was no statistically significant difference between the EAT-40 score groups according to walking status of the participants (p> 0.05). There was a statistically significant relation-ship between walking status and emotional eating that is one of MEQ subscales (r = -0.159, p <0.01). As having nutrition course, EAT-40 score decreased and the score of MEQ increased (p> 0.05). There was no statistically significant relationship between the level of taking the course and EAT-40, MEQ or the sub-scales of MEQ (p> 0.05). In sum, nutrition courses influence students' eating attitudes and mindful eating positively. In addition, gaining mindfulness of eating will be helping manage to weight status.
Key words: Mindful eating, emotional eating, binge eating, obesity, mindfulness Introduction
Eating attitudes have been changing by traditions rather than a necessity and becoming new habits such as unbalanced eating habits, dietings, unconsciously eating patterns, distracted during meals, skipping meals by excuses or eating fast food. There are strong evidences (1-3) that eating attitudes increase the risk
of depression (1, 2) and there is a positive relation-ship between obesity and anxiety disorders (3-5). It is known that emotions have a strong effect on food selection and formation of eating habits (6, 7). Emo-tional status affects eating attitudes not only obese individuals but also individuals who have normal and underweight body mass index (8, 9). It is known that food seeking behavior occurs especially in long-term
dietary users (10, 11), binge eating episodes (12) and when daily stress cannot be coped (13).
Until today, it has been thought that the way to alleviate negative emotions such as sadness and anger (13, 14) is through eating foods (15). The most im-portant question about emotional eating is that this relationship can be measured (15, 16) and emotions that affect eating behavior can be detected (11, 17, 18). In recent studies, the concept of emotional eating is a response to negative emotions (19-21). It has been observed that emotional eating due to psychological stress increases especially in binge eating disorder, and the trainings related to them were reported to be ben-eficial in body weight loss (22).
Eating attitudes can be altered by environmental factors as well as a family learning process and obesity and binge eating disorder are inevitable (23,24). Eat-ing Disorders and Obesity have been researched with eating attitudes and mindful eating for many years (16,20,21,23,2-27). Eating behavior in obese subjects is more emotionally based (17, 28, 29) and how to deal with these emotional states and how it can be affected by overeating has been reported in results (21, 24, 30). Emotional disorders and stress are among the most im-portant risk factors of obesity and they are main causes of emotional eating (31). In particular, the tendency towards food consumption to cope with stress can be explained by emotional hunger. When individuals eat mindfully and mindful eating scores are increased, their potential to cope with these moods increases too.
The concept of mindfulness was adapted to define and change eating behaviors permanently by mindful eating (32). In mindful eating studies, the main goal is ‘to recreate the first bite taste of the food consumed at each consumption time (at each bite)’. Thus, it is pos-sible to make healthier and satisfying choices by being mindful about the food that is consumed. At the same time, the individual should realize what kind of hunger happens and it is aimed to determine when to start and stop eating (27, 33).
With the understanding of the importance of mindful eating, Kose et al. (2016), due to the loss of some factors, they have adapted the existing questions to the Turkish language by changing in accordance with the culture and developed a new scale (34). Mantzios and Wilson (2015) correlated mindfulness, eating
be-haviors and obesity; emphasized that it would enable the development of more effective preventive and thera-peutic methods in obesity and binge eating disorders by increasing research on mindful eating (20). In a study conducted by Framson et al. (2009), a negative relation-ship was found between Mindful Eating Questionnare (MEQ) total score and disinhibition sub-factor (27). At cross-sectional studies, Anderson et al. (2016) found a relationship with the disinhibition sub-factor was insig-nificant (35). Moor et al. (2013) reported a siginsig-nificant relationship between MEQ and disinhibition, emotion-al eating and externemotion-al factors (p <0.05) (36). According to Mason et al. (2016) MEQ was developed to measure the quality of attention given to the eating experience instead of becoming specialized in the eating mindfully (37). Beshara, Hutchinson and Wilson (2013) named the participants who scored higher on the MEQ scale as ‘mindful eaters’. They emphasized the importance of emotional eating and disinhibition, scale’s two sub-factors (38).
When the research results are examined, it is emphasized that mindfully food consumption, being mindful about the changes in metabolism and choosing appropriate foods for this situation improve the quality of life. Increasing the quality of life of people will be make them more productive, in short, more beneficial individuals to society. Therefore, assessing eating atti-tude and mindful eating status, informing individuals, identifying problems and offering solutions will be in the interest of not only individuals but also society. The aim of this study was to determine and evaluate eating attitudes and mindful eating statuses of students who took and did not take nutrition lessons during their university education.
Materials and Methods
In this study, 318 volunteer students aged between 18-45 years who participated in education at Uskudar University between September 2015 and May 2016 were randomly selected. In the general planning of the research, at the beginning of the nutrition course in September 2015, it was aimed to ensure the tion of students to all classes by making the participa-tion of the students and to make a difference in the
scale application among the students taking and taking nutrition classes. The first survey continued through-out April and reached 249 students. However, 318 of the 360 students who participated in the study an-swered the questionnaire questions completely. All procedures followed by ethical standards of the re-sponsible committee on human experimentation and with the Helsinki Declaration of 1975, as revised in 2000. Informed consent was taken from all students for being included in the study. For this research, it was received Uskudar University Clinical Research Ethics Committee Approval on 30/03/2015, named as B.08. 6.YOK.2.US.0.05.0.06/2016/48.
Instruments
In the study, 1 question about whether or not tak-ing nutrition lessons, socio-demographic characteris-tics, health information questionnaires, Mindful Eat-ing Questionnare (MEQ) and EatEat-ing Attitude Test 40) were applied. Eating Attitude Test (EAT-40) and Mindful Eating Questionnare (MEQ) total scores, body weight (kg), BMI (kg / m2), food prefer-ence; walking (weekly), sleep and mindful eating status of students were evaluated.
MEQ
Mindful Eating Questionnare (MEQ) was de-veloped by Framson et al. (2009). Kose et al. (2016) adapted to Turkish as MEQ-30, when this validation has been given as 5 items were taken from the origi-nal and the remaining items were inspired by the same scale and a new scale was created as a total of 30 ques-tions. The sub-factors of the scale were divided into 7 sub-factors as disinhibition (mindless eating), emo-tional eating, eating control, mindfulness, eating dis-cipline, conscious nutrition and interference. The sub-factors of the scales provide more detailed information about the sample. Examples of items are “I enjoy the look and smell of food before eating,” “I eat healthy,” and “I eat without thinking when something is served”. The internal reliability of the MEQ was good (0.733) in this study. The reliability of the MEQ-28 original form’s Chronbach’s alpha value was 0.64. Pearson cor-relation of coefficients were used to find the cor-relation among the sub-factors. In factor analysis, it was exam-ined whether the sample size was sufficient by KMO
and Barlett test. The test factor, which should be 0.6 or higher for significance, was found to be 0.813 on the MEQ scale. The scoring (straight and reverse) of the scale is as follows: Items 1, 7, 9, 11, 13, 15, 18, 24, 25 and 27 are scored straight, and the remaining ques-tions are scored reverse (Reverse Scoring: 1 = 5, 2 = 4, 3 = 3, 4 = 2, 5 = 1). The higher the score of the scale, the higher the mindful eating status is found.
EAT-40
The Eating Attitude Test (EAT-40) measures eat-ing behavior and attitudes and symptoms of possible disorders in eating behavior in normal individuals. The EAT-40 has been developed by Garner and Garfin-kel (1979) features 40 items that measure disordered eating attitudes and behaviors (39). Savasır and Erol (1989) conducted a validity and reliability study and adapted it to Turkish. Since the scores of the eating at-titude test were over 30 and the risk of eating disorder was found to be high, evaluations were made according to this classification (40). In the scoring of the scale, straight and inverse scoring are as follows: Items 18, 19, 23, 27 and 39 are reversed. and the remaining ques-tions were scored straight (Straight Scoring: a = 3, b = 2, c = 1, d = 0, e = 0, f = 0).
Nutrition Course
During the 14-week course period, the partici-pants had 12-week nutrition course as; introduction to nutrition, nutritional problems and causes of food in society, nutrients, food groups, cooking and storage methods, energy requirements and energy balance, nu-trition in special cases, nunu-trition in diseases.
Statistical analysis
In the study, Student t-test, one-way ANOVA, chi-square analysis, Pearson and Spearman correla-tion analysis and Cronbach’s alpha value analysis were used to evaluate the data obtained. Pearson correlation analysis was used to evaluate the MEQ and EAT-40 scores and their correlations with the score groups. Since EAT-40 cut-off point was specified as 30, ad-ditional analyzes were performed by grouping EAT-40 scores as 0-30 points and ≥31 points. Body Mass Index
(BMI): body weight (kg) / height² (m) calculated with the formula. The World Health Organization (41) classification was used for BMI.
Data were analyzed by using the IBM SPSS Sta-tistics version 15 software for Windows. Significance level was taken as p <0.05.
Results
In the present study, 22.6% of the participants were male and 77.4% were female, 5.3% were married and 94.7% were single, the mean age was 21.56 ± 3.82 years, 71.1% of the group was 18-21 years old, 28.9% was 22 years old age and over.
When the educational status of the mothers of the participants was evaluated, 63.5% of them had pri-mary education (pripri-mary school - secondary school), 25.8% had secondary education (high school), 4.7% had bachelor degree and 6% were illiterate. The educa-tional status of their fathers; It was found that 50.3% had primary (secondary-secondary), 38.7% had sec-ondary (high school), 10.1% had associate / under-graduate under-graduates and 0.9% were illiterate.
The mean height of the participants was 166± 8.0 cm, body weight was 60.95 ± 12.70 kg, and the mean BMI (kg / m²) was 21.87± 3.57; 23.76 ± 3.32 in males and 21.32 ± 3.46 in females. When the distributions in the BMI classification were examined, in general 11.6% were underweight (UW), 72% were normal (NW) and 16.4% pre-obese and obese (POW), 1.4%
of the men in the group were UW, 68.1% were NW, 30.6% were POW; 14.6% of the women were found to be UW, 73.2% were NW and 12.2% were found in the POW group.
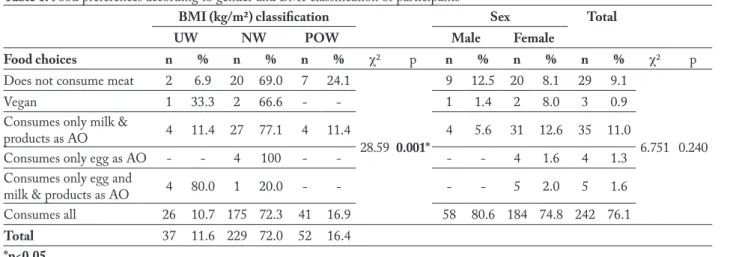
In the present study, 11% of the participants con-sume only milk and dairy products from animal sourced foods, 9.1% do not consume red meat, 1.6% consume only milk and eggs from animal sourced foods, 1.3% consume only eggs and 0.9% of animal sourced foods. was not consuming any animal nutrients. There was no statistically significant difference between the groups in terms of gender and food preferences (p> 0.05). There was a statistically significant difference between the food preferences and BMI classification of the partici-pants (p <0.05).
In the present study, the mean BMI of partici-pants who have obese person in the family was 22.79 ± 3.91 kg / m², while the mean of who have not obese person in the family was 21.36 ± 3.26 kg / m², and a statistically significant difference was found between the groups (p <0.05).
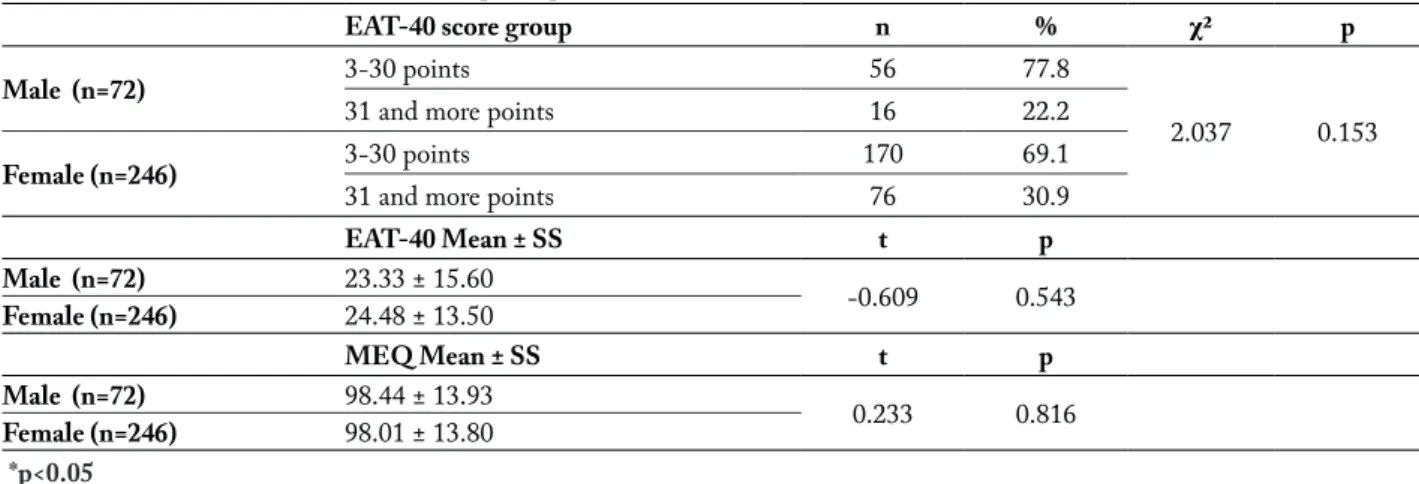
While 71.1% of the participants had an EAT-40 score between 3-30 and had no risk of eating disorder, 28.9% had an EAT-40 score higher than 30 and had an eating disorder risk. The mean score of the partici-pants was 98.11± 13.81, 98.44± 13.92 for males and 98.01± 13.80 for females, and there was no significant difference between the groups (p> 0.05).
When the mean scores of EAT-40 according to the BMI classification (kg/m2) of the participants were ex-amined; UW group was 19.24± 8.60, NW was 24.52±
Table 1. Food preferences according to gender and BMI classification of participants
BMI (kg/m²) classification Sex Total
UW NW POW Male Female
Food choices n % n % n % χ² p n % n % n % χ² p
Does not consume meat 2 6.9 20 69.0 7 24.1
28.59 0.001*
9 12.5 20 8.1 29 9.1
6.751 0.240
Vegan 1 33.3 2 66.6 - - 1 1.4 2 8.0 3 0.9
Consumes only milk &
products as AO 4 11.4 27 77.1 4 11.4 4 5.6 31 12.6 35 11.0
Consumes only egg as AO - - 4 100 - - - - 4 1.6 4 1.3
Consumes only egg and
milk & products as AO 4 80.0 1 20.0 - - - - 5 2.0 5 1.6
Consumes all 26 10.7 175 72.3 41 16.9 58 80.6 184 74.8 242 76.1
Total 37 11.6 229 72.0 52 16.4
14.82, POW was 26.44± 12.59 and there was a statis-tically significant difference between groups (p <0.05). There was no significant difference between MEQ scores (p> 0.05). The participants were found to be at risk of eating disorder in the POW group (p <0.05).
It was determined that all of the participants con-sumed only the eggs of animal origin (AO), 33.3% of the vegans, 26.4% of those who did not have food preference and 24.1% of those who did not consume
red meat were at risk of eating disorders (p <0.05). According to the sleep status of the participants, 55.7% were regular, 39.3% were irregular and 5% only sleep regularly during the week; 38.9% of the partici-pants were walking 1-90 minutes, 26.4% 91-200 min-utes, 34.7% more than 201 minute per week. There was no statistically significant difference between sleep or walking groups and EAT-40, MEQ scores (p>0.05).
In the present study, a statistically significant
re-Table 2.Relationship between participants’ mean BMI and presence of obese person in the participants’ family BMI (kg/m²)
S % x– ± SS t p
Obese in the family exist 114 35.8 22.79 ± 3.91 kg/m² -3.496 0,001*
Non exist 204 64.2 21.36 ± 3.26 kg/m²
*p<0.05
Table 3. Scale scores according to gender of participants
EAT-40 score group n % χ² p
Male (n=72) 3-30 points 56 77.8
2.037 0.153
31 and more points 16 22.2
Female (n=246) 3-30 points 170 69.1
31 and more points 76 30.9
EAT-40 Mean ± SS t p Male (n=72) 23.33 ± 15.60 -0.609 0.543 Female (n=246) 24.48 ± 13.50 MEQ Mean ± SS t p Male (n=72) 98.44 ± 13.93 0.233 0.816 Female (n=246) 98.01 ± 13.80 *p<0.05
Table 4. Scores of EAT-40 and MEQ scales according to BMI classification of participants
BMI (kg/m²) classification n Mean ± SS F p
YTT-40 score Underweight (UW) 37 19.24 ± 8.60
3.091 0.002*
Normal weight (NW) 229 24.52 ± 14.82
Pre-obese and obese (POW) 52 26.44 ± 12.59
UW 37 100.29 ± 14.07 1.046 0.071 MEQ score NW 229 98.22 ± 13.23 POW 52 96.06 ± 15.96 3-30 31 and more χ² p UW 33 4 7.533 0.023*
YTT-40 score group NW 160 69
POW 33 19
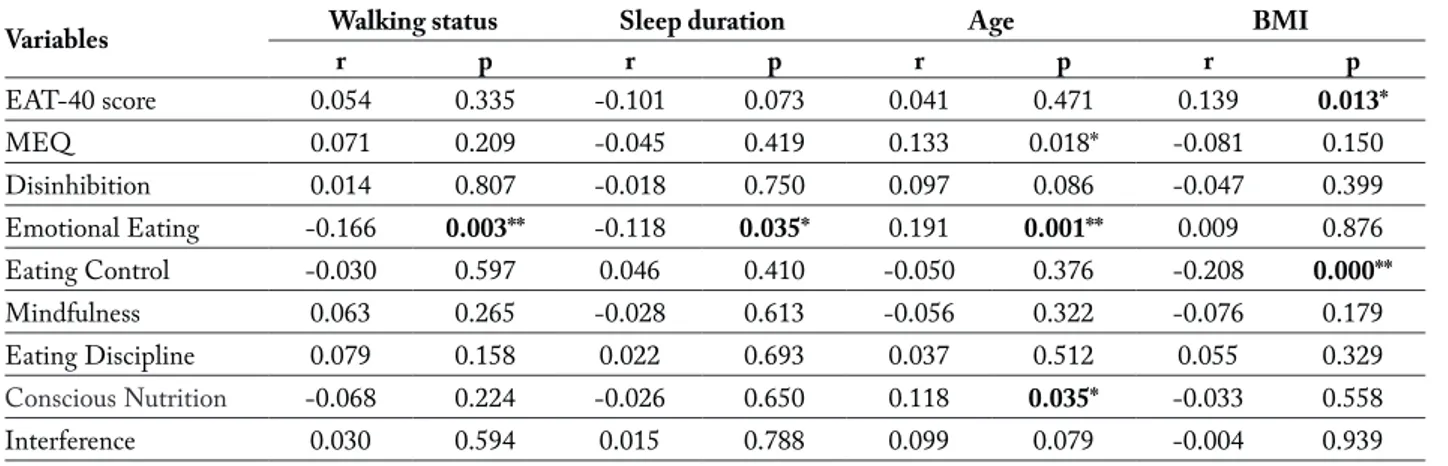
lationship was found between the emotional eating sub-factor and walking status (r = -0.166, p <0.01) and sleep duration of the participants (r = -0.118, p <0.035). As the age increased, MEQ scores (mind-ful eating) increased significantly (r = 0.133, p <0.05), however there was no significant relationship between EAT-40 scores (p> 0.05). When the relationship
be-tween MEQ sub-factor scores are examined, emotion-al eating (r = 0.191, p <0.001) and conscious nutri-tion (r = 0.118, p <0.05) sub-factors increase with age. While the BMI increased, the risk of eating disorder is increased (r = 0.139, p <0.05) and it was found that the eating control sub-factor decreased (r = -0.208, p <0.01).
Table 5. Comparison of EAT-40 scores according to food preference of the participants EAT-40 score group
0-30 points 31 and more points
Food choices n % n % χ² p
Does not consume meat 22 75.9 7 24.1
17.735 0.003*
Vegan 2 66.7 1 33.3
Consumes only milk & products as AO 19 54.3 16 45.7
Consumes only egg as AO - - 4 100
Consumes only egg and milk & products as AO 5 100 -
-Consumes all 178 73.6 64 26.4
Total 226 71.1 92 28.9
*p<0.05
Table 6. EAT-40 and MEQ scores according to participants’ sleep and walking status
EAT-40 MEQ EAT-40 Mean ± SS MEQ Mean ± SS
Regular sleep 177 177 25.15 ± 13.85 98.72 ± 14.18
Irregular sleep 125 125 23.01 ± 14.17 97.17 ± 13.67
Regular sleep only on weekdays 16 16 23.38 ± 13.99 98.75 ± 10.69
1-90 min walking / week 191 191 23.71 ± 12.65 96.99 ± 14.03
91-200 min walking / week 69 69 24.29 ± 17.72 100.8 ± 12.24
>201 min walking / week 58 58 25.79 ± 13.26 98.60 ± 14.58
*p<0.05
Table 7. Relationship between walking status, sleep duration, age and BMI and EAT-40, MEQ and MEQ sub-factor scores
Variables Walking status Sleep duration Age BMI
r p r p r p r p EAT-40 score 0.054 0.335 -0.101 0.073 0.041 0.471 0.139 0.013* MEQ 0.071 0.209 -0.045 0.419 0.133 0.018* -0.081 0.150 Disinhibition 0.014 0.807 -0.018 0.750 0.097 0.086 -0.047 0.399 Emotional Eating -0.166 0.003** -0.118 0.035* 0.191 0.001** 0.009 0.876 Eating Control -0.030 0.597 0.046 0.410 -0.050 0.376 -0.208 0.000** Mindfulness 0.063 0.265 -0.028 0.613 -0.056 0.322 -0.076 0.179 Eating Discipline 0.079 0.158 0.022 0.693 0.037 0.512 0.055 0.329 Conscious Nutrition -0.068 0.224 -0.026 0.650 0.118 0.035* -0.033 0.558 Interference 0.030 0.594 0.015 0.788 0.099 0.079 -0.004 0.939 *p<0.05
Discussion
In the present study, eating attitudes, status of mindful eating and its sub-factors of students who took and did not take nutrition lessons during univer-sity education were discussed below.
Framson et al. (2009) found BMI ranged from 17.7 to 62.0 (mean = 24.2±5.1) in their researches. They have studied each four group samples with good consistency. Chung et al. (2016) reported that BMI was 35.13± 3.97 kg / m² in a study conducted with women with cancer. In a study conducted by Ander-son et al. (2016), BMI mean was found 23.0± 4.0 kg/ m². Abbaspoor et al. (2018) found that 50.7% of the participants were working with women of normal weight, BMI range was 24.57±6.05 kg/m². Choi and Lee (2019), in their study with male and female sub-jects, found the mean BMI to be 20.77 ± 4.62 kg / m². Tutkun (2019), in his study found the mean BMI 22.00 ±3.18 kg /m² for females and 24.15 ±3.29 kg / m² for males. In the present study, the overall BMI average (kg/m²) was 21.87±3.57; 23.76 ±3.32 in males and 21.32±3.46 in females. In the present study, when the distribution of the participants in the BMI clas-sification was examined, 72% of the participants were normal, 68.1% of the men and 73.2% of the women were found in the normal group. It can be said that the participants in our study were in the normal BMI classification according to WHO and that the selected study group was in the healthy body weight range.
Greene-Finestone et al. (2008) reported that veg-etarian and vegan individuals with reduced protein consumption, more carbohydrate and fat consumption is inevitable that’s why it can be difficult to maintain body weight management and there can be reduction in mindful eating. In another study, Sofi et al. (2018) argued that both Mediterranean and vegetarian di-ets could be healthy. Bolori et al. (2019) conducted a cross-sectional study of pre-obese and obese individu-als with a healthy plant based healthy diet and found improvements in blood values by reducing saturated fat (p <0.0001). Adeva-Andany (2019), on the other hand, found a middle way and recommended a veg-etarian diet within the framework of healthy eating rules as well as high-quality vegetable protein con-sumption. In our study, it was found that BMI values
between vegetarian and vegan groups were high and eating attitudes were impaired (p <0.05). In general, vegetarians and vegans who consume high-quality car-bohydrates and fats in their food choices do not en-counter any health risky risks.
In their review, Cawley et al. (2019) presented data that clearly prove that an individual has a high BMI of genetic and environmental factors. Similarly, in the present study, it was found that students with a fat family in their family had higher BMI averages (p <0.05). In the present study, although normal BMI range was obtained, it is estimated that similar results may be obtained in studies with high BMI results.
Framson et al. (2009), couldn’t found any differ-ence between sex and MEQ scores (p>0.05). Ciceko-glu and Tuncay (2018) found more disordered eatings in men (p<0.05). In the present study, 71.1% of the participants had an EAT-40 score between 3-30 and no risk of eating disorder, while 28.9% had an EAT-40 score higher than 30 points and had an eating disor-der risk. When the mean scores of EAT-40 and MEQ were compared between male and female groups, no statistically significant difference was found (p> 0.05). It can be said that the characteristics of the groups studied were effective in the emergence of this cause.
Framson et al. (2009) stated that there is a strong association between BMI groups and MEQ scores (p<0.001). Sanlier et al. (2016) found no significant scores according to BMI classification and EAT-40. Moor et al. (2013) and Anderson et al. (2016) did not detect a relationship between BMI classification and MEQ. In their study, Fung et al. (2016) emphasized the importance of measuring mindful eating status and reported that eating attitude and body weight manage-ment could be achieved more effectively by an increase in mindful eating status.
In the present study, when the mean scores of EAT-40 according to the BMI classification of the participants were examined, it was found that UW group was 19.24 ± 8.60, NW group was 24.52 ± 14.82, POW group was 26.44 ± 12.59 and there was a sta-tistically significant difference between the groups (p <0.05); however, there was no significant difference between the mean scores of MEQ between the groups (p> 0.05). Participants that in POW group were found to be at a risk of eating disorder (p <0.05). The results
show that when BMI is not normal, eating attitudes are impaired and mindful eating status decreases.
Cicekoglu and Tuncay (2018) in their study, found significant differences about disordered eatings (EAT-40 score) between vegans, vegetarians and non-vegans or vegetarians (p <0.05). Medawar et al. (2019) stated in their systematic review of randomized clini-cal trials, they found that plant based diets may have a bad mental effect and it may cause mental problems. In the present study, it was found that all of the partici-pants consumed only eggs from animal-origin (AO) foods, 33.3% of vegans, 26.4% of those who did not have food preference and 24.1% of those who did not consume red meat were at risk of eating disorders (p <0.05). The easiest and most effective way of achiev-ing healthy eatachiev-ing attitude and mindful eatachiev-ing sta-tus among university students is to provide nutrition courses. In this study, although there is no statistically significant result in taking nutrition lessons and EAT-40 and MEQ scores, it is promising.
In their study, Framson et al. (2009) found a significant relationship between MEQ score in indi-viduals with walking status more than 200 minutes (p <0.05). In another study, Moor et al. (2013) found a negative correlation between the participants› weekly walking status and MEQ scores and emotional eating and awareness in sub-factors (p <0.05). In the present study, a statistically significant relationship was found between the emotional eating factor and walking sta-tus (r = -0.166, p <0.01) and sleep duration of the par-ticipants (r = -0.118, p <0.035). When the results are examined, individuals walking more than 201 minutes per week show that they can better cope with emo-tional eating. In addition to this sleep deprivation can leads to eat more by some key hormones are called leptin and ghrelin. Research suggest that sleep dep-rivation leads to more ghrelin, therefore you want to eat more, and less leptin which makes you less likely to stop eating (54). Also exercise can leads to reduce leptin levels (55). According to these results we can say walking and sleep duration can affect emotional eating.
Grosso et al. (2016) found strong correlation be-tween sleep duration and eating attitudes in cohort studies and emphasized the importance of sleep in im-proving quality of life. In the present study, a
statisti-cally significant relationship was found between emo-tional eating and sleep duration (r = -0.118, p <0.035) and sleep quality, which were the sub-factors of the participants (p <0.05). It supports the idea that emo-tional eating decreases with increasing duration and quality of sleep.
In their study, Framson et al. (2009) found that as the age of the participants increased, mindfulness, disinhibition, emotional eating and external cues fac-tors increased with the exception of total MEQ score and distraction factor. In another study, Choi and Lee (2019) found a relationship between age and emotion-al eating (t = 2.763, p = 0.006). In the present study, as the age of the participants increased, MEQ scores increased significantly (r = 0.133, p <0.05), but there was no significant relationship between EAT-40 scores (p> 0.05). When the relationship between the MEQ sub-actor scores is examined, emotional eating (r = 0.191, p <0.001) and conscious nutrition (r = 0.118, p <0.05) factors increase with age. In the sub-factors of MEQ, Framson et al. (2009), Grinnel et al. (2011), Moor et al (2013) and Choi and Lee (2019) found that emotional eating factor increased with age. Moor et al. (2013) and Choi and Lee (2019) showed similar results, whereas Framson et al. (2009) reported differ-ences. It is thought that this difference may be due to lower scale scores of participants over 30 years of age.
In the Framson et al. (2009) study, as the BMI value increased, MEQ score decreased and all sub-fac-tors were negatively correlated (p <0.001). In another study, Grinnell et al. Beshara, Hutchinson and Wilson (2013) found a negative correlation with MEQ scores and body weight, and a negative correlation with emotional eating and disinhibition factors (p <0.05). Mason et al. (2016) found that participants with high BMI values had lower MEQ scores and decreased emotional eating scores. In their study, Anderson et al. (2016) focused on eating awareness and cognitive restriction, but found no statistically significant rela-tionship. Chung et al. (2016) and Choi and Lee (2019) have found that mindful eating scores were significant-ly lower among obese participants (p <0.001). Moor et al. (2013) found a negative correlation between BMI and MEQ scores. On the other hand, both Taylor, Daiss and Krietsch (2015), Abbaspoor et al. (2018), and Webb et al. (2018) couldn’t find any significant
relationship between BMI and MEQ scores but Ab-baspoor et al. (2018) have found a correlation between BMI and awareness subfactor (p=0.01). In the present study, in parallel with other studies, the increase in BMI caused a decrease in mindful eating, but it was not associated with other factors other than eating control (r = -0.208, p <0.01) (p> 0.05). In addition, it was found that the risk of eating disorder increased while the BMI value increased (r = 0.139, p <0.05). This proves that as the body weight and BMI increases, the individual›s mindful eating status decreases, eating disorder may develop, individual cannot listen to body signals and it can be hard to focus on eating.
Conclusion
Dietary habits are changing with environmental factors and turning into new habits such as binge ing, unconscious eating, not being able to focus on eat-ing, and eating fast and eating fast. Training individu-als about healthy eating habits and eating behaviors within the framework of the attention given to eating behavior, decreasing sensitivity to thoughts and emo-tions during food consumption, providing body weight control, gaining mindful eating abilities and explain-ing information about physiological processes about food consumption will be helpful them for recognize hunger types (especially emotional) and eating mind-fully. It is concluded that there is a need for more sup-port to change nutritional habits especially through guidance to individuals.
References
1. Jun EM, Choi SB. Obesity, body image, depression, and weight-control behaviour among female university students in Korea. Journal of Cancer Prevention 2014;19(3): 240-6. 2. Morrison KM, Shin S, Tarnopolsky M, Taylor VH.
Asso-ciation of depression and health related quality of life with body composition in children and youth with obesity. Jour-nal of Affective Disorders 2014; 172:18-23.
3. Opel N, Redlich R, Grotegerd D, Dohm K, Heindel W, Kugel H. Obesity and major depression: Body-mass index (BMI) is associated with a severe course of disease and spe-cific neurostructural alterations. Psychoneuroendocrinology 2015; 51: 219-26.
4. Zedler B, Von Lengerke T, Emeny R, Heier M, Lacruz ME, Ladwig KH. Obesity and symptoms of depression and anxi-ety in pre- and postmenopausal women: a comparison of different obesity indicators. Psychotherapie, Psychosomatik, Medizinische Psychologie 2014; 64 (3): 128-35.
5. Luppino FS, de Wit LM, Bouvy PF, Stijnen T, Cuijpers P, Penninx BW. Overweight, obesity, and depression: a sys-tematic review and meta-analysis of longitudinal studies. Archives of General Psychiatry 2010; 67(3): 220-9. 6. Paz A, Berry EM. Effect of meal composition on alertness
and performance of hospital night-shift workers. Do mood and performance have different determinants? Annals of Nutrition & Metabolism 1997; 41(5): 291-8.
7. Wansink B, Cheney MM, Chan N. Exploring comfort food preferences across age and gender. Physiology and Behavior 2003, 79(4-5): 739-47.
8. Geliebter A, Aversa A. Emotional eating in overweight, normal weight, and underweight individuals. Eating Behav-iors 2003; 3(4): 341-7.
9. Albers S. Using mindful eating to treat food restriction: a case study. Eating Disorders 2011; 19(1): 97-107.
10. Mendez-Diaz M, Rueda-Orozco PE, Ruiz-Contreras AE, Prospero-Garcia O. The endocannabinoid system modu-lates the valence of the emotion associated to food ingestion. Addiction Biology 2012; 17(4): 725-35.
11. Canetti L, Bachar E, Berry EM. Food and Emotion. Behav Processes 2002; 60(2):157-64.
12. Morgan CM, Yanovski SZ, Nguyen TT, McDuffie J, Se-bring NG, Jorge MR. Loss of control over eating, adiposity, and psychopathology in overweight children. International Journal of Eating Disorders 2002; 31(4): 430-41.
13. Wardle J, Steptoe A, Oliver G, Lipsey Z. Stress, dietary re-straint and food intake. Journal of Psychosomatic Research 2000; 48(2): 195-202.
14. Desmet PM, Schifferstein HN. Sources of positive and negative emotions in food experience. Appetite 2008; 50(2): 290-301.
15. Mills P, Newman EF, Cossar J, Murray G. Emotional mal-treatment and disordered eating in adolescents: Testing the mediating role of emotion regulation. Child Abuse and Ne-glect 2014; 39:156-66.
16. Dalen J, Smith BW, Shelley BM, Sloan AL, Leahigh L, Begay D. Pilot study: Mindful Eating and Living (MEAL): weight, eating behavior, and psychological outcomes as-sociated with a mindfulness-based intervention for people with obesity. Complementary Therapies in Medicine 2010; 18(6): 260-4.
17. Gianini LM, White MA, Masheb RM. Eating pathol-ogy, emotion regulation, and emotional overeating in obese adults with binge eating disorder. Eating Behaviors 2013; 14(3): 309-13.
18. Allison DB, Heshka S. Emotion and eating in obesity? A critical analysis. International Journal of Eating Disorders 1993; 13(3): 289-95.
19. Bays JC. Mindful Eating: a guide to rediscovering a healthy and joyful relationship with food. First edition. Shambhala
Publications Vol.1. Boston, Massachusetts, 2009.
20. Mantzios M, Wilson JC. Mindfulness, eating behaviours, and obesity: a review and reflection on current findings. Current Obesity Reports 2015; 4(1): 141-6.
21. Van Strien T, Herman CP, Verheijden MW. Eating style, overeating, and overweight in a representative Dutch sam-ple. Does external eating play a role? Appetite 2009; 52(2): 380-7.
22. Kabat-Zinn J. Mindfulness-based interventions in context: past, present, and future. Clinical Psychology Science Prac-tice 2003; 10(2): 144-56.
23. Dalen J, Brody JL, Staples JK, Sedillo D. A conceptual framework for the expansion of behavioral interventions for youth obesity: a family-based mindful eating approach. Childhood Obesity 2015; 11(5): 577-84.
24. Van Strien T. On the relationship between dieting and „obese“ and bulimic eating patterns. International Journal of Eating Disorders 1996; 19(1): 83-92.
25. Wardle J, Steptoe A, Oliver G, Lipsey Z. Stress, dietary re-straint and food intake. Journal of Psychosomatic Research 2000; 48(2): 195-202.
26. Chung S, Zhu S, Friedmann E, Kelleher C, Kozlovsky A, Macfarlane KW, Tkaczuk KH, Ryan AS, Griffith KA. Weight loss with mindful eating in African American women following treatment for breast cancer: a longitudinal study. Supportive Care in Cancer 2016; 24(4): 1875-81. 27. Framson C, Kristal AR, Schenk JM, Littman AJ, Zeliadt
S, Benitez D. Development and validation of the mindful eating questionnaire. Journal of the American Dietetic As-sociation 2009; 109(8): 1439-44.
28. Vandewalle J, Moens E, Braet C. Comprehending emotion-al eating in obese youngsters: the role of parentemotion-al rejection and emotion regulation. International Journal of Obesity 2014; 38(4):525-30.
29. Schneider KL, Appelhans BM, Whited MC, Oleski J, Pagoto SL. Trait anxiety, but not trait anger, predisposes obese individuals to emotional eating. Appetite 2010; 55(3): 701-6.
30. Rommel D, Nandrino JL, Ducro C, Andrieux S, Delecourt F, Antoine P. Impact of emotional awareness and parental bonding on emotional eating in obese women. Appetite 2012; 59(1) :21-6.
31. Ganley RM. Emotion and eating in obestiy: a review of the literature. International Journal of Eating Disorders 1989; 8(3): 343–61.
32. Hammond M. Mindful eating, tuning in to your food. Dia-betes Self Management 2007; 24(2): 36-40.
33. Van Strien T, Engels RC, Van Leeuwe J, Snoek HM. The Stice model of overeating: tests in clinical and non-clinical samples. Appetite 2005; 45(3): 205-13.
34. Kose G, Tayfur M, Birincioğlu I, Donmez A. Adaptation Study of the Mindful Eating Questiıonnare (MEQ) into Turkish, Journal of Cognitive-Behavioral Psychotherapy and Research, 2016; 5(3): 125-34.
35. Anderson LM, Reilly EE, Schaumberg K, Dmochowski S, Anderson DA. Contributions of mindful eating, intuitive
eating, and restraint to BMI, disordered eating, and meal consumption in college students. Eating and Weight Disor-ders 2016; 21(1): 83-90.
36. Moor KR, Scott AJ, McIntosh WD. Mindful eating and its relationship to body mass index and physical activity among university students. Mindfulness 2013; 4: 264-74.
37. Mason AE, Epel ES, Kristeller J, Moran PJ, Dallman M, Lustig RH. Effects of a mindfulness-based intervention on mindful eating, sweets consumption, and fasting glucose levels in obese adults: data from the SHINE randomized controlled trial. Journal of Behavioral Medicine 2016; 39(2): 201-13.
38. Beshara M, Hutchinson AD, Wilson C. Does mindfulness matter? Everyday mindfulness, mindful eating and self-re-ported serving size of energy dense foods among a sample of South Australian adults. Appetite 2013; 67: 25-9.
39. Garner DM, Garfinkel PE. The eating attitudes test: an index of the symptoms of anorexia nervosa. Psychological Medicine 1979; 9(2):273-9.
40. Savağır I, Erol N. Yeme tutum testi: anoreksiya nervoza be-lirtileri indeksi. Psikoloji Dergisi 7:19-25, 1989. Savasir I, Erol N. Eating Attitudes Test: anorexia nervosa symptoms index. Journal of Psychology 1989; 7(23):19–25.
41. World Heath Organization (WHO). BMI classification. Access: (http://appswhoint/ bmi/ indexjsp?introPage=intro _3html). Access date: 15/03/2017.
42. Abbaspoor Z, Javadifar N, Miryan M, Abedi P. Psychomet-ric properties of the Iranian version of mindful eating ques-tionnaire in women who seeking weight reduction. Journal of Eating Disorders 2018; 6(1): 33.
43. Choi SH, Lee H. Associations of mindful eating with di-etary intake pattern, occupational stress, and mental well-being among clinical nurses. Perspectives in Psychiatric Care 2019; 1ğ8.https://doi.org/10.1111/ppc.12441.
44. Tutkun E. An Examination of Nutritional Approaches and Stress Levels in Athletes: Nutritional approach and stress. Progr Nutr [Internet]. 2019;22(3).
45. Greene-Finestone LS, Campbell MK, Evers SE, Gutmanis IA. Attitudes and health behaviours of young adolescent omnivores and vegetarians: a school-based study. Appetite 2008; 51(1): 104-10.
46. Sofi F, Dinu M, Pagliai G, Cesari F, Gori AM, Sereni A, Becatti M, Fiorillo C, Marcucci R, Casini A. Low-calorie vegetarian versus Mediterranean diets for reducing body weight and improving cardiovascular risk profile: CARDI-VEG Study (Cardiovascular Prevention With Vegetarian Diet). Circulation 2018; 137(11),1103-13.
47. Bolori P, Setaysh L, Rasaei N, Jarrahi F, Saeid Yekaninejad M. Adherence to a healthy plant diet may reduce inflam-matory factors in obese and overweight women-a cross-sectional study. Diabetes & Metabolic Syndrome: Clinical Research & Reviews, 2019; 13(4), 2795-802.
48. Adeva-Andany, MM, González-Lucán M, Fernández-Fernández C, Carneiro-Freire N, Seco-Filgueira M, Pedre-Piñeiro AM. Diet composition determines insulin sensitiv-ity and cardiovascular risk in humans. Clinical Nutrition
ESPEN, 2019
49. Cawley J, Han E, Kim J, Norton EC. Testing for family influences on obesity: The role of genetic nurture. Health Economics 2019; 28(7), 937-52.
50. Cicekoğlu P, Tuncay GY. A comparison of eating attitudes between vegans/vegetarians and nonvegans/nonvegetar-ians in terms of orthorexia nervosa. Archives of Psychiatric Nursing 2018; 32(2), 200-5.
51. Sanlier N, Pehlivan M, Sabuncular G, Bakan S, Isguzar Y. Determining the relationship between body mass in-dex, healthy lifestyle behaviors and social appearance anxi-ety. Ecology of food and nutrition 2018; 57(2), 124-39. 52. Fung TT, Long MW, Hung P, Cheung LW. An
expand-ed model for mindful eating for health promotion and sustainability: Issues and challenges for dietetics prac-tice. Journal of the Academy of Nutrition and Dietetics 2016; 116(7), 1081–6.
53. Medawar E, Huhn S, Villringer A, Witte AV. The effects of plant-based diets on the body and the brain: a systematic review. Translational Psychiatry 2019; 9(1), 1-17.
54. Graham L., and Shane P. (2017) Sleep better: the science and the myths. Sheldon Press. ISBN 9781847094575 55. Acar H, Tutkun E. The Effect of Different Term Swimming
Exercise in Rats on Serum Leptin Levels. Progr Nutr [In-ternet]. 2019;22(1).
56. Grosso G, Marventano S, D›Urso M, Mistretta A, Galvano
F. The Mediterranean healthy eating, ageing, and lifestyle (MEAL) study: rationale and study design. International Journal of Food Sciences and Nutrition 2016; 5:1-10. 57. Grinnell S, Greene G, Melanson K, Blissmer B, Lofgren IE.
Anthropometric and behavioral measures related to mind-fulness in college students. Journal of American College Health 2011; 59(6): 539-45.
58. Taylor MB, Daiss S, Krietsch K. Associations among self-compassion, mindful eating, eating disorder symptomatol-ogy, and body mass index in college students. Translational Issues in Psychological Science 2015; 1(3): 229.
59. Webb JB, Rogers CB, Etzel L, Padro MP. “Mom, quit fat talking—I›m trying to eat (mindfully) here!”: Evaluating a sociocultural model of family fat talk, positive body image, and mindful eating in college women. Appetite 2018; 126: 169-75.
Correspondence: Raci Karayigit Ankara University,
Faculty of Sport Sciences, Ankara, Turkey E-mail: [email protected]