An investigation of microRNAs mapping to breast cancer
related genomic gain and loss regions
S.D. Selcuklu
a,b, M.C. Yakicier
c, A.E. Erson
b,*
aGenetics and Biotechnology Lab, Room 1.30, BioSciences Institute, University College Cork, Western Road, Cork, Ireland bDepartment of Biological Sciences, Middle East Technical University, Inonu Bulvari, 06531 Ankara, Turkey
cDepartment of Molecular Biology and Genetics, Bilkent University, Bilkent 06800, Ankara, Turkey Received 3 June 2008; received in revised form 4 September 2008; accepted 12 September 2008
Abstract
Various regions of amplification or loss are observed in breast tumors as a manifestation of genomic
instability. To date, numerous oncogenes or tumor suppressors on some of these regions have been
characterized. An increasing body of evidence suggests that such regions also harbor microRNA
genes with crucial regulatory roles in cellular processes and disease mechanisms, including cancer.
Here, we investigated 35 microRNAs localized to common genomic gain and/or loss regions in
breast cancers. To examine amplification or loss of these microRNAs as a result of genomic
insta-bility, we performed semiquantitative duplex polymerase chain reaction in 20 breast cancer cell
lines, 2 immortalized mammary cell lines, and 2 normal DNA controls. A comprehensive DNA fold
number change data for 35 microRNA genes on chromosomal gain/loss regions are presented in
breast cancer cells. A 23% (8/35) of the investigated microRNAs showed significant fold number
increases (greater than fourfold) compared to
GAPDH in one or more of the breast cell lines.
Although no homozygous deletions were detected, fold number decreases indicating potential loss
regions were observed for 26% (9/35) of the investigated microRNAs. Such fold number changes
may point out some of these microRNAs as potential targets of the genomic instability regions as
oncogene and tumor suppressor candidates.
Ó 2009 Elsevier Inc. All rights reserved.
1. Introduction
Genomic instability is commonly seen in breast cancers.
So far, various potent oncogenes and tumor suppressors
located on some of these common instability regions have
been identified. In addition to the coding genes, microRNA
genes are also found to be located on genomic instability
regions and chromosomal fragile sites
[1,2]
. Moreover,
numerous murine microRNA loci have been indicated as
common retroviral integration sites
[3]
.
MicroRNAs are about 18e24 nucleotide transcripts that
can bind to the 3’ untranslated regions (UTR) of target
mRNAs and either prevent their translation or cause
degra-dation
[4e7]
. Recent research suggests important
regula-tory roles of such noncoding RNA in various processes,
such as those directing pluripotency, differentiation,
morphogenesis, cell cycle regulation, metabolism, and
immune system pathways
[8,9]
.
A growing body of evidence suggests deregulated
expression of microRNAs in various tumors. Abnormal
microRNA expression is, therefore, linked to altered levels
of proteins that may have significant roles during the
initia-tion or maintenance of the neoplastic phenotype in different
cancer types. In fact, deregulated microRNA expression
pro-files have been shown to effectively differentiate normal
breast tissue from breast tumors
[10]
. As evidence continues
to build up linking microRNAs to cancer, hsa-mir-21,
map-ped on an amplicon region (17q23), was found to be
overex-pressed in breast cancers, glioblastomas, pancreatic cancers,
hepatacellular cancers, cholangiocarcinomas, ovarian, and
colorectal cancers
[10e18]
. So far, identified targets of
hsa-mir-21,
PTEN, PDCD4, and TPM1 are known to be
involved in cell survival and transformation processes
[14,17,19]
. Therefore, identification of deregulated
micro-RNAs and their target mmicro-RNAs provides new avenues toward
understanding the tumorigenesis processes.
Based on the fact that breast cancers demonstrate high
genomic instability phenotypes, we investigated the status
of microRNA genes on such gain/loss regions in breast
can-cer cell lines to pioneer further expression and functional
analysis for microRNA genes that may be targets of
ampli-fication or regions of loss. While the majority of microRNA
genes had various degrees of fold number increases or
* Corresponding author. Tel.:þ90 (312) 210-5043; fax: þ 90 (312) 210-7976.
E-mail address:[email protected](A.E. Erson).
0165-4608/09/$ e see front matterÓ 2009 Elsevier Inc. All rights reserved. doi:10.1016/j.cancergencyto.2008.09.009
decreases, 23% (8/35) and of the investigated microRNA
genes showed significant fold number increases (more than
fourfold) compared to
GAPDH in one or more of the breast
cell lines. No homozygous deletions were detected, but fold
number decreases indicating potential loss regions were
observed for 26% (9/35) of the investigated microRNAs.
2. Materials and methods
2.1. Cancer cell line DNA
Twenty breast cancer cell lines [BT20, BT474, BT549,
CAL51, DU4475, Hs578T, MCF7, MB157,
MDA-MB231, MDA-MB361, MDA-MB435 (breast origin
ques-tioned
by
[20]
),
MDA-MB468,
SUM52,
SUM102,
SUM149, SUM159, SUM185, SUM229, SK-BR3, and
T47D] and 2 immortalized, nontumorigenic mammary cell
lines (HPV4-12 and MCF10) DNA samples were kindly
provided by E.M. Petty (University of Michigan, Ann
Arbor, MI).
2.2. Selection of common genomic gain/loss regions
Publications on homozygous deletion (HD), loss of
heterozygosity (LOH), and amplification regions in breast
cancer cells were screened to build a list of frequent and
com-mon genomic gain/loss regions in breast cancer. Two
approaches were used to find microRNAs mapping to these
regions. First, boundaries for these regions were extracted
from the UCSC Genome Browser (Genome Bioinformatics
Group of UC Santa Cruz, Human Genome assembly, May
2004) using single-nucleotide polymorphism (SNP) marker
information, when available. microRNA genes located
within these boundaries and/or chromosomal bands were
then identified from the miRBase database (version 7.1;
Wel-come Trust Sanger Institute). Second, all known microRNA
sequences were combined back to back in FASTA format and
were blasted against the selected genomic gain/loss regions
to localize any microRNA genes (
Tables 1 and 2
).
2.3. Semi-quantitative duplex PCR and densitometry
analysis
Primer sets for microRNA genes on selected
chromo-somal regions were designed by using the Primer3 program
(version 0.2; Whitehead Institute for Biomedical Research,
Cambridge, MA;
Table 3
). MicroRNA genes were
co-am-plified with an internal control gene,
GAPDH
(glyceralde-hyde-3-phosphate dehydrogenase), by semiquantitative
duplex PCR, which was optimized and performed as
de-scribed previously
[21]
. Optimization of PCR in control
DNA samples involved two major steps: (1)
coamplifica-tion of microRNA gene primers with alternating
GAPDH
primer concentrations to obtain similar-intensity bands
and (2) optimization of PCR cycle number for each reaction
so as not to observe saturated bands for densitometric
Table 1
List of microRNA genes on genomic instability regions
Loci Gain / loss Samples References microRNA genes
1 2q31~q32 Gain MDA-MB-231 [47] hsa-mir-10b
2q Loss BT [48]
2 3p21 Loss BCCL and BT [49e51] hsa-mir-135a-1, let7g,
hsa-mir-191, hsa-mir-138-1, hsa-mir-425
3p Loss BT [52]
3 3q Gain BT [53,54] hsa-mir-15b, hsa-mir-16-2
4 3q13.3 Loss MCF7 [23] hsa-mir-198
5 5q33 Loss BT [28,51,55] hsa-mir-143, hsa-mir-145
6 8p11~p12 Gain BCCL and BT [56] hsa-mir-486
8p11~p21 Loss BT [57]
7 8p21 Loss BT [52,57] hsa-mir-320a
8 8p21~p23 Loss BCCL and BT [51,52,58,59] hsa-mir-383
Gain BT [51]
9 11q23~q24 Gain BT [60] hsa-mir-34b, hsa-mir-34c,
mir-100, let7a-2, hsa-mir-125b-1
Loss BT [60e62]
10 13q14 Loss BCCL and BT [23,52,63,64] hsa-mir-15a, hsa-mir-16-1
11 13q31 Gain BCCL [23,65,66] mir-17, mir-18a,
mir-20a, mir-19a, hsa-mir-19b-1, hsa-mir-92a-1
12 17q22~q24 Gain BCCL and BT [67e69] hsa-mir-301a, hsa-mir-142
13 17q23 Gain BCCL and BT [38,70e72] hsa-mir-21, hsa-mir-633
14 20p Gain BCCL and BT [73] hsa-mir-103-2
15 21q21 Loss BT [39] hsa-mir-125b-2
16 Xq21 Loss BCCL [23] 384,
hsa-mir-325,hsa-mir-361 Abbreviations: BCCL, breast cancer cell lines; BT, breast tumors.
analysis. The optimized PCR products were run on
ethid-ium bromideestained 2% agarose gels, visualized, and
documented under ultraviolet light. Band intensities for
the microRNA and
GAPDH PCR products were quantified
by using the densitometric image processing and analysis
program Scion Image (version beta 3b; National Institutes
of Health, Bethesda, MD) and by visual inspection. Ratio
of band intensities for the microRNA and
GAPDH were
calculated. Cancer cell line ratios were normalized using
the mean of the signals from normal DNA samples (N1,
N2). Fold changes of 35 microRNA genes compared to
GAPDH in 20 breast cancer cell lines (BCCL) and two
im-mortalized cell lines were calculated as follows;
Fold change5
BCCLðmicroRNA=GAPDHÞ
AVGðN1; N2ÞðmicroRNA=GAPDHÞ
Fold changes for each microRNA in cancer cells versus
controls were then classified with the following cut-off
values; less than 0.3-fold (loss), 0.3e2.0-fold (no
signifi-cant change), 2.0e4.0-fold (gain), and > 4-folds (and/or
saturated bands due to significant amplification) (significant
gain). For reverse-transcription polymerase chain reaction
(RT-PCR), DNase-treated RNA (1 mg) was used to
synthe-size cDNA using both oligodT primers and random
hexamers.
3. Results and Discussion
Common breast cancererelated genomic gain/loss
regions were selected from the literature. Screening for
microRNA genes located within the boundaries of these
chromosomal regions resulted in the identification of more
than 30 known microRNA genes (
Table 1
).
Primers were designed to investigate genomic loss or
gain of microRNA genes located on breast cancererelated
genomic regions. Thirty-five microRNA genes were
successfully co-amplified with
GAPDH primers in 20
breast cancer cell lines, 2 immortalized mammary cell
lines, and 2 normal DNA controls. Ratios of the microRNA
and
GAPDH PCR product bands were then detected by
densitometry for cancer cell lines and compared to the
av-erage values of the two normal control DNA samples. To
minimize insensitivity of semi-quantitative PCR results
and to be stringent about calling a region lost, only
micro-RNA/GAPDH ratios less than 0.3-fold compared to normal
samples were considered as losses and increases of more
than 2-fold were indicated as gains (
Fig. 1
). No HD were
observed for any of the microRNA genes in the examined
cell lines. Taking limits of duplex PCR into account, we
focused on consistent patterns of amplification or loss of
microRNA genes across several cell lines, whereas no
significant fold number changes were detected for some
microRNAs, such as hsa-mir-486 and hsa-mir-10b.
Hsa-mir-10b, on 2q31.1, was recently reported to be highly
ex-pressed in metastatic breast cancer cells (e.g.,
MDA-MB-231) contributing to invasion and metastasis
[22]
. We did
not detect any significant amplification in any of the cell
lines for this microRNA gene, therefore DNA amplification
may not be a common reason of overexpression of this
microRNA in breast cancer cells.
Among the selected breast cancererelated genomic
regions, some were defined by broad chromosomal
bound-aries, so it was not unusual to find different studies
report-ing the same region to harbor either genomic loss or gain.
In breast cancer cells, we also observed that some
micro-RNA located on regions of loss showed fold number
increases, whereas some others located on gain regions
showed fold number decreases. For example, hsa-mir-384
resides on Xp21.2, which was indicated as a region of loss
[23]
. While we detected loss for Hs578T, MDA-MB-231
demonstrated a threefold increase in the microRNA PCR
product compared to
GAPDH and normal DNA samples
(
Fig. 2
A). While some of these similar results may be partly
explained by the insensitivity of semi-quantitative PCR, it
may also suggest how complicated genomic instability
may manifest in breast cancers.
Table 2
Chromosomal coordinates of microRNAs according to UCSC Genome Browser
microRNAs Chromosomal coordinates 1 hsa-mir-10b 2: 176,723,277-176,723,386 [þ] 2 hsa-mir-138-1 3: 44,130,708-44,130,806 [þ] 3 hsa-mir-425 3: 49,032,585-49,032,671 [e] 4 hsa-mir-191 3: 49,033,055-49,033,146 [e] 5 hsa-let-7g 3: 52,277,334-52,277,417 [e] 6 hsa-mir-135a-1 3: 52,303,275-52,303,364 [e] 7 hsa-mir-198 3: 121,597,205-121,597,266 [e] 8 hsa-mir-15b 3: 161,605,070-161,605,167 [þ] 9 hsa-mir-16-2 3: 161,605,227-161,605,307 [þ] 10 hsa-mir-145 5: 148,790,402-148,790,489 [þ] 11 hsa-mir-143 5: 148,788,674-148,788,779 [þ] 12 hsa-mir-383 8: 14,755,318-14,755,390 [e] 13 hsa-mir-486 8: 41,637,116-41,637,183 [e] 14 hsa-mir-320a 8: 22,158,420-22,158,501 [e] 15 hsa-mir-34c 11: 110,889,374-110,889,450 [þ] 16 hsa-mir-125b-1 11: 121,475,675-121,475,762 [e] 17 hsa-let-7a-2 11: 121,522,440-121,522,511 [e] 18 hsa-mir-100 11: 121,528,147-121,528,226 [e] 19 hsa-mir-16-1 13: 49,521,110-49,521,198 [e] 20 hsa-mir-15a 13: 49,521,256-49,521,338 [e] 21 hsa-mir-17 13: 90,800,860-90,800,943 [þ] 22 hsa-mir-18a 13: 90,801,006-90,801,076 [þ] 23 hsa-mir-19a 13: 90,801,146-90,801,227 [þ] 24 hsa-mir-20a 13: 90,801,320-90,801,390 [þ] 25 hsa-mir-19b-1 13: 90,801,447-90,801,533 [þ] 26 hsa-mir-92a-1 13: 90,801,569-90,801,646 [þ] 27 hsa-mir-142 17: 53,763,592-53,763,678 [e] 28 hsa-mir-301a 17: 54,583,279-54,583,364 [e] 29 hsa-mir-21 17: 55,273,409-55,273,480 [þ] 30 hsa-mir-633 17: 58,375,308-58,375,405 [þ] 31 hsa-mir-103-2 20: 3,846,141-3,846,218 [þ] 32 hsa-mir-125b-2 21: 16,884,428-16,884,516 [þ] 33 hsa-mir-384 X: 76,056,092-76,056,179 [e] 34 hsa-mir-325 X: 76,142,220-761,42,317 [e] 35 hsa-mir-361 X: 85,045,297-85,045,368 [e]
Similarly, hsa-mir-191 on chromosomal band 3p21
mostly showed fold number increases in SUM185, CAL51,
and DU4475 cells. Although 3p21 is usually indicated as
a loss region in breast and lung cancers
[1]
, amplification
of this microRNA gene was consistent with recent reports
suggesting hsa-mir-191 overexpression in breast cancer cell
lines
[24]
and colon cancers
[25]
. Moreover, according to
a recently generated comprehensive copy number variation
(CNV) map of the human genome
[26]
, chromosomal bands
3p21 and 8p21 were denoted as CNV loci. Chromosomal
bands 3p21 and 8p21 harbor hsa-mir-138-1 (
Fig. 2
B),
hsa-let-7g (overexpressed in colon cancers
[27]
), and
hsa-mir-320a, respectively. Therefore, for the microRNA on
these chromosomal bands, fold number increases and/or
de-creases in different cells may also be an indication of CNV.
Targets of these microRNA will be interesting to evaluate
the role of CNV that may be seen on these chromosomal
bands. Other chromosome 3q microRNAs [hsa-mir-198
and hsa-mir-15b, 40 megabases (Mb) apart from each other]
demonstrated low to significant fold number increases in
more than two cell lines. Hsa-mir-15b demonstrated the
following fold number increases: 2.6 for MCF7, 2.5 for
T47D, and 2 for both BT474 and MDA-MB-468. Therefore,
gains were indicated for these cell lines in
Fig. 1
because they
were above the threshold of twofold. Hsa-mir-16-2 [60 base
pairs (bp) away from hsa-mir-15b] also demonstrated a
simi-lar amplification pattern (1.2 for MCF7, 1.7 for T47D, 1.4 for
BT474, and 1.6 for MDA-MB-468), but since all were below
the threshold value of twofold, no gain was indicated for
these cell lines in
Fig. 1
.
Surprisingly, hsa-mir-145 on 5q, a region to harbor
mul-tiple loss of heterozygosity regions
[28]
, was amplified in
13 cell lines, including MCF10 and HPV4-12, whereas
no significant fold number decrease was observed.
Hsa-mir-145 is known to be down-regulated in different
tumors such as breast
[10,24]
and ovarian
[15]
. However,
when compared to the SNP arrayebased LOH and copy
number analysis data from Cancer Genome Project (CGP)
of the Wellcome Trust Sanger Institute (
http://www.sanger.
ac.uk/genetics/CGP
), some breast cancer cell lines (e.g.,
MCF7, MDA-MB-157, and BT549) were indeed reported
to harbor small regions of low amplifications around the
Table 3
Primer sequences for microRNA genes andGAPDH
microRNA Primer sequences (5’ / 3’)
hsa-mir-10b F: TAATAAAGCCGCCATCCTTG, R: CTGGCTATTCCGAAGAAACG
hsa-mir-let7g F: GGTTTCCCAGAGATGAGCAG, R: AGCCTCTGCTGTGAGGATGT
hsa-mir-135a-1 F: CTGTCCTGCCTCCTTTTGAG, R: GAAGAAGTGCCTGCAAGAGC
hsa-mir-138-1 F: AGCAGCACAAAGGCATCTCT, R: CTCTGTGACGGGTGTAGCTG
hsa-mir-425 F: CCACCCCCATTCCTTTTAAT, R: CAGGTCATGCACCTTCAGAAT
hsa-mir-191 F:AAGTATGTCTGGGGGTCAGG, R: ACAACCTACTCCCGGGTCTT
hsa-mir-198 F:GCCGGAGGTTAAACATGAAA, R: CCCAGCCTACCAATATGCTC
hsa-mir-15b F: AGAACGGCCTGCAGAGATAA, R: CGTGCTGCTAGAGTGGAACA
hsa-mir-16-2 F: TGTTCGTTTTATGTTTGGATGA, R: AGTGGTTCCACCAAGTAAGTCA
hsa-mir-145 F: GGCTGGATGCAGAAGAGAAC, R: CAGGGACAGCCTTCTTCTTG
hsa-mir-143 F: CCCTCTAACACCCCTTCTCC, R: AACTTCCCCAGCATCACAAG
hsa-mir-486 F: CCTGGGGTGTGAATGGTAAC, R: ATCTCCAGCAGGTGTGTGTG
hsa-mir-320 F: GAGGCGAATCCTCACATTG, R: GGGACTGGGCCACAGTATTT
hsa-mir-383 F: AGTCCACCAAATGCAGTTCC, R: ACTTCAGAATCTCCCCGTCA
hsa-mir-34c F: TTGAGCTCCAACTCAACCAA, R: GATGCACAGGCAGCTCATT
hsa-mir-125b-1 F: ACCAAATTTCCAGGATGCAA, R: CGAACAGAAATTGCCTGTCA
hsa-mir-let-7a-2 F: ATAGGGAGAAAAGGCCTGGA, R: ATGGCCCAAATAGGTGACAG
hsa-mir-100 F: AGGTCTCCTTCCTCCACCTC, R: GTCACAGCCCCAAAAGAGAG
hsa-mir-16-1 F: TGAAAAAGACTATCAATAAAACTGAAAA, R: CCATATTGTGCTGCCTCAAA
hsa-mir-15a F: TACGTGCTGCTAAGGCACTG, R: ATTCTTTAGGCGCGAATGTG
hsa-mir-19a F: TGCCCTAAGTGCTCCTTCTG, R: CCAGGCAGATTCTACATCGAC
hsa-mir-20a F: CGATGTAGAATCTGCCTGGTC, R: GGATGCAAACCTGCAAAACT
hsa-mir 19b-1 F: GCCCAATCAAACTGTCCTGT, R: ACCGATCCCAACCTGTGTAG
hsa-mir-17 F: CCCCATTAGGGATTATGCTG, R: CCTGCACTTTAAAGCCCAACT
hsa-mir 18a F: GGCACTTGTAGCATTATGGTGA, R TGCAAAACTAACAGAGGACTGC:
hsa-mir-92-1 F: CCATGCAAAACTGACTGTGG, R: CAGTGGAAGTCGAAATCTTCAG
hsa-mir-142 F: CAGGGTTCCACATGTCCAG, R: CTGAGTCACCGCCCACAAG
hsa-mir-301 F: CTCATTTAGACAAACCATAACAACTT, R: CATCAATAAGCAACATCACTTTGA
hsa-mir-21 F: CCATTGGGATGTTTTTGATTG, R: TCCATAAAATCCTCCCTCCA
hsa-mir-633 F: AGGACTGGGTTTGAGTCCTG, R: TTAGACATTCCTCCTGGTGAA
hsa-mir-103-2 F:CCCTAGGGAGGAATCCAGAG, R: AGCCATAAGCTGCACCAACT
hsa-mir-125b-2 F: TCGTCGTGATTACTCAGCTCAT, R: CAGGGATCAGCTGGAAGAAG
hsa-mir-384 F: TGGCCAGTTAGCATCTTGAA, R: TCAGGCCTGCAGAAATAGTG
hsa-mir-325 F: TCCTTTTCACCCCTCAACAC, R: GGATTCAAGTCCACAGAACCA
hsa-mir-361 F:GGAGCTCAACCATACCAGGA R: TTGGGCATATGTGACCATCA
140- to 50-Mb region of chromosome 5q32. Both data
suggest transcriptional regulation to be a more plausible
mechanism than genomic loss for the down-regulation of
hsa-mir-145 in breast cancer cells.
Hsa-mir-34b and hsa-mir-34c on 11q23 are recently
shown to be normally up-regulated in response to DNA
damage and oncogenic stress in a p53-dependent manner
and to decrease p53-mediated cell death when hsa-mir-34
function was reduced
[29]
. We detected low to moderate
fold number increase of hsa-mir-34c in two breast cell
lines, whereas we failed to generate a PCR product for
hsa-mir-34b. According to these results, transcriptional
reg-ulation seems to be a more plausible explanation than
geno-mic loss for these geno-microRNA. Expression status of these
microRNA genes will be crucial in revealing their roles
in breast tumorigenesis.
Consistent with the finding that hsa-mir-125b-1 on 11q24
is downregulated in ovarian cancers
[15]
, we observed a fold
number decrease in four cell lines. Surprisingly, two others,
especially T47D, showed a fold number increase compared
to controls. Hsa-let-7a-2 and hsa-mir-100, separated from
each other by 5 kilobases, also demonstrated a conserved
sig-nificant amplification pattern in MDA-MB-231 and T47D
cells. Interestingly, in
Drosophila, mir-100, mir-125, and
let-7 are all clustered within an 800-bp region on
chromo-some 2L and up-regulation of these miRNA and the
down-regulation of mir-34 requires the hormone ecdysone during
development
[30]
. Thus, expression and functional analysis
of 11q24 microRNA and possibly mir-34 family members
in breast cancers may potentially help to establish such a
co-operative role in mammalian cells.
Hsa-mir-16-1 and hsa-mir-15a have been indicated as
tu-mor suppressor genes in leukemia
[31]
. We did not observe
any fold number decreases, to indicate LOH or HD in any
of the breast cancer cell lines. The roles of these microRNAs
in breast tumorigenesis are yet to be established, but if their
deregulated expression contributes to breast tumorigenesis
as it does in leukemia, genomic loss does not seem to be
com-mon, at least among cell lines. Interestingly, low to moderate
fold number increases were observed for some cells (e.g.,
CAL51) for both hsa-mir-16-1 and hsa-mir-15a. While this
result may be due to the semi-quantitative nature of our
ap-proach, it is also possible that expression data may also not
correlate with genomic level gains or losses.
Chromosomal band 13q31.1, harboring the
microRNA-17-92 cluster, was also analyzed in breast cancer cell lines.
This cluster is known to be overexpressed in lung cancers
and lymphomas
[32e34]
. We did not detect a significant
genomic amplification pattern for the 17-92 cluster in
breast cancer cell lines. Especially for hsa-mir-19a and
hsa-mir-19b-1, the microRNA PCR product bands were
not even as significantly amplified as the
GAPDH bands
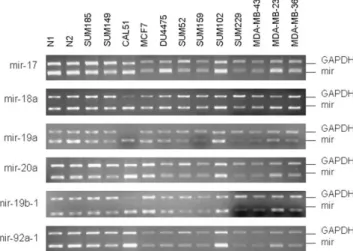
in SUM229 and MDA-MB-435 cell lines (
Fig. 3
),
suggest-ing that amplification of these microRNA genes may not be
a common event in breast cancer cell lines, if this cluster
also harbors potent oncogenes with roles during breast
tumorigenesis. Interestingly, when compared to the CGP
of the Wellcome Trust Sanger Institute, we noticed
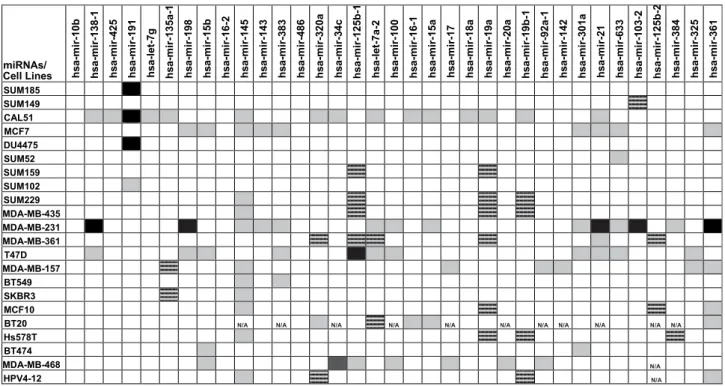
/ s A N R i m s e n i L ll e C hsa-mir-1 0b hs a- mir-138 -1 hs a-mir-4 25 hs a-mir-1 91 hs a-le t-7 g hs a- mir-135 a-1 hs a-mir-1 98 hs a-mir-1 5b hs a-mir-1 6-2 hs a-mir-1 45 hs a-mir-1 43 hs a-mir-3 83 hs a-mir-4 86 hs a-mir-3 20a hs a-mir-3 4c hs a-mir-1 25b-1 hs a-le t-7a-2 hs a-mir-1 00 hs a-mir-1 6-1 hs a-mir-1 5a hs a-mir-1 7 hs a-mir-1 8a hs a-mir-1 9a hs a-mir-2 0a hs a-mir-1 9b-1 hs a- mir-92a -1 hs a-mir-1 42 hs a-mir-3 01a hs a-mir-2 1 hs a-mir-6 33 hs a- mir-103 -2 hs a-mir-1 25b-2 hs a-mir-3 84 hs a-mir-3 25 hs a-mir-3 61 5 8 1 M U S 9 4 1 M U S 1 5 L A C 7 F C M 5 7 4 4 U D 2 5 M U S 9 5 1 M U S 2 0 1 M U S 9 2 2 M U S 5 3 4 -B M -A D M 1 3 2 -B M -A D M 1 6 3 -B M -A D M D 7 4 T 7 5 1 -B M -A D M 9 4 5 T B 3 R B K S 0 1 F C M 0 2 T B N/A N/A N/A N/A N/A N/A N/A N/A N/A N/A N/A T 8 7 5 s H 4 7 4 T B 8 6 4 -B M -A D M N/A 2 1 -4 V P H N/A
Fig. 1. Fold number changes for the 35 microRNA genes mapping to selected genomic gain/loss regions in breast cancers. Densitometric analysis results of microRNA andGAPDH PCR products of cancer cell lines were compared to that of normal DNA.Fold changes for each microRNA in cancer cells versus controls were classified with the following cut-off values; less than 0.3-fold (loss, ), 0.3- to 2.0-fold (no significant change, ), 2.0e4.0 fold (gain, ), and 4-fold or higher (and/or saturated bands due to significant amplification; significant gain, ).
potential LOH and HD of the 90-Mb region of chromosome
13 in some of the cell lines such as MB-231,
MDA-MB-157, and Hs578T. In agreement with this, Eiriksdottir
et al.
[35]
reported 13q31~qq34 as one of the three LOH
regions on 13q in breast cancer. Moreover, Hossain et al.
[36]
reported hsa-mir-17, a member of the 17-92 cluster,
as a tumor suppressor in breast cancer cells because
expres-sion of hsa-mir-17 was low in breast cancer cell lines and
down-regulation of
AIB1 (Amplified in Breast Cancer 1)
by hsa-mir-17 resulted in decreased proliferation of breast
cancer cells. In the same study, hsa-mir-17 was also shown
to abrogate the insulin-like growth factor 1emediated,
anchorage-independent growth of breast cancer cells.
Zhang et al.
[37]
further indicated that 13q31~q34
microRNAs were among the 24 that showed copy number
losses in ovarian, breast, and melanoma cells.
A significant amplification pattern was observed for
microRNA genes on the 17q22~q23 region. Hsa-mir-301a
on 17q22 showed amplification in 18% (4/22) of cell lines.
Hsa-mir-21 and hsa-mir-633, located on 17q23, showed
consistent and significant amplification in MCF7,
MDA-MB-231 (more than fourfold), and T47D. These findings
were in concordance with the previous data on 17q23, a
fre-quently amplified chromosomal area that harbors amplified
oncogene candidates in breast cancers
[21,38]
. In addition
to coding genes in this known amplicon, amplified
micro-RNA genes are also interesting oncogene candidates,
including hsa-mir-21.
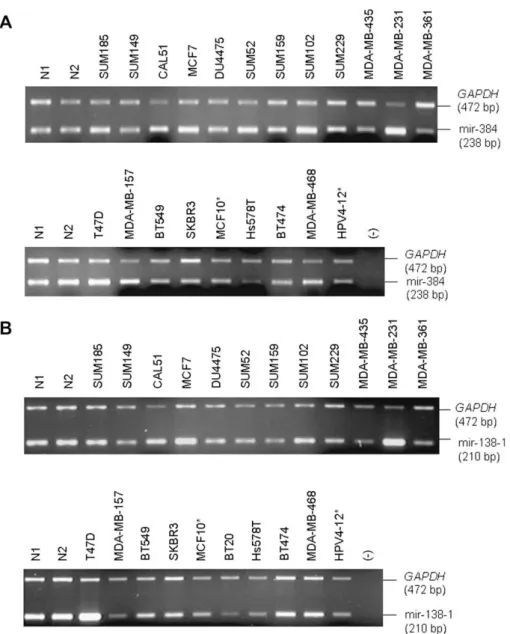
Fig. 2. Genomic gain or loss of microRNA genes detected by semi-quantitative duplex PCR. (A) Hsa-mir-384 (chromosome Xq21.2) andGAPDH primers were co-amplified in 20 breast cancer cell lines, 2 immortalized mammary cell lines (denoted by asterisk), and 2 normal DNA controls (N1 and N2). MDA-MB-231 showed more than 2-fold increase (Fig. 1, ), whereas Hs578T demonstrated a 0.3-fold decrease (Fig. 1, ) in comparison toGAPDH and normal control DNA samples. (B) Hsa-mir-138-1 (chromosome 3p21) andGAPDH primers were co-amplified in 20 breast cancer cell lines, 2 immortalized mam-mary cell lines (denoted by asterisk), and 2 normal DNA controls (N1 and N2). Hsa-mir-138-1 was found to be amplified more than twofold in CAL51 and T47D cells (Fig. 1, ) and more than fourfold (Fig. 1, ) in MDA-MB231 cells, compared toGAPDH and to normal control DNA samples.
Hsa-mir-125b-2 maps to the 16-Mb region of
chromo-some 21. A 6-centimorgan deletion interval of 21q21
between loci D21S1432 (16 Mb) and D21S1437 (20 Mb)
was reported previously
[39]
, with the possibility that one
or more tumor suppressor genes associated with breast
cancer may exist between these markers. Therefore,
consis-tently decreased fold numbers for this microRNA in two
cell lines could be significant and may point out this
micro-RNA gene as a potential tumor suppressor gene. Deletion
regions at chromosomal band 21q21 are also reported for
other malignancies, such as lung cancers
[40]
and
neuro-blastomas
[41]
. Consistent with our results, hsa-mir-125b-2
was specifically mapped to a HD region of chromosomal
band 21q11~q21 in lung cancers
[42]
.
On Xq21, we detected mostly low gain for hsa-mir-384,
hsa-mir-325, and hsa-mir-361. The CGP of the Wellcome
Trust Sanger Institute data suggest the presence of
heteroge-neous amplification and regions of loss on this chromosome
for the investigated cell lines. Roles and targets of these
microRNAs in neoplastic growth are yet to be investigated.
We also chose a representative microRNA (hsa-mir-383)
that resides on a chromosomal area (8p21~8p24), which
was reported to be mostly lost in tumors but also amplified
in some others (
Table 1
), and performed RT-PCR. As the
DNA fold number data did not suggest any loss for this
microRNA (suggested low gains), the RT-PCR results were
in agreement with the DNA data, showing similar levels of
the precursor structure compared to a normal breast cDNA
sample (RNA from Ambion, Austin, TX;
Fig. 4
).
Throughout the study, two immortalized mammary cell
lines (MCF10 and HPV4-12) also demonstrated fold
differ-ences compared to the control DNA samples for some
micro-RNA genes. For MCF10, we detected fold number increases
(2.3-fold for hsa-mir-145 and 2.7-fold for hsa-mir-361) and
fold number decreases (! 0.3-fold) of hsa-mir-19a and
hsa-mir-125b-2. For the other immortalized cell line,
HPV4-12, we detected fold number decreases for
hsa-mir-320a and hsa-mir-19b-1. Such genomic changes may
be expected to result from immortalization and continuous
passaging in the laboratories
[43]
.
The internal control of choice in this study,
GAPDH,
resides on the chromosome 12p13 band, which was
indi-cated as a rare amplicon region in breast cancer cells
[44]
.
GAPDH, however, resides 3 Mb away from the
ampli-con boundaries mentioned. Consistent with this, we did not
observe a continuous
GAPDH PCR product amplification
pattern in any specific cell line.
In summary, our results suggest that a significant
num-ber of microRNA genes on genomic gain/loss regions in
breast cancers indeed have DNA level amplification or
los-ses. It should be emphasized that the aneuploidy status of
these cell lines may affect the results, and that fold number
changes may not always reflect the copy number changes of
these microRNA genes. It should also be noted that DNA
level copy changes may or may not correlate with the
expression data. Another issue even becomes more
impor-tant for microRNA expression studies when the precursor
microRNA levels and mature microRNA levels may not
linearly correlate with each other as Lin 28, an
RNA-binding protein, acts as a negative regulator and blocks
let-7 microRNA processing into the mature form in
embry-onic cells
[45,46]
.
Such a DNA fold number profile of microRNAs on
genomic gain/loss regions may also be useful for
delineat-ing boundaries of certain instability regions, as well as for
identifying microRNA genes as potential oncogene and
tumor suppressor targets of the genomic instability regions,
along with protein coding genes. Given the number of
target mRNAs that a microRNA can bind, deregulated
expression of microRNAs can alter multiple pathways that
are important during the initiation or maintenance of the
neoplastic growth of cells.
Acknowledgments
We thank Dr. Elizabeth M. Petty from University of
Michigan for cell line DNAs, Serkan Tuna for his help in
densitometry, and Dr. Sreeparna Banerjee for helpful
com-ments on the manuscript. This work was supported by
Turkish Academy of Sciences, GEBIP 2006 and M.E.T.U.
internal funds.
Fig. 3. Semi-quantitative PCR for the microRNA-17-92 cluster. No sig-nificant amplification was detected for this microRNA cluster.
Fig. 4. Duplex RT-PCR for hsa-mir-383 andGAPDH. 1. MCF7, 2. MDA-MB-231, 3. HeLa, 4. Normal Breast cDNA, 5. No cDNA, 6. MCF7, 7. MDA-MB-231, 8. HeLa, 9. Normal Breast cDNA. cDNA samples in 1e4 were prepared using oligodT primers and those in samples 6e9 by random hexamers. No significant difference was detected among samples by densitometry.
References
[1] Calin G, Sevignani C, Dumitru C, Hyslop T, Noch E, Yendamuri S, Shimizu M, Rattan S, Bullrich F, Negrini M, Croce C. Human micro-RNA genes are frequently located at fragile sites and genomic regions involved in cancers. Proc Natl Acad Sci USA 2004;101:2999e3004. [2] Lamy P, Andersen C, Dyrskjøt L, Tørring N, Ørntoft T, Wiuf C. Are
microRNAs located in genomic regions associated with cancer? Br J Cancer 2006;95:1415e8.
[3] Makunin I, Pheasant M, Simons C, Mattick J. Orthologous micro-RNA genes are located in cancer-associated genomic regions in human and mouse. PLoS ONE 2007;2:e1133.
[4] Bartel D. MicroRNAs: genomics, biogenesis, mechanism, and func-tion. Cell 2004;116:281e97.
[5] Pillai R. MicroRNA function: multiple mechanisms for a tiny RNA? RNA 2005;11:1753e61.
[6] Zamore P, Haley B. Ribo-gnome: the big world of small RNAs. Science 2005;309:1519e24.
[7] Kim V. MicroRNA biogenesis: coordinated cropping and dicing. Nat Rev Mol Cell Biol 2005;6:376e85.
[8] Wiemer E. The role of microRNAs in cancer: no small matter. Eur J Cancer 2007;43:1529e44.
[9] Dinger M, Amaral P, Mercer T, Pang K, Bruce S, Gardiner B, Askar-ian-Amiri M, Ru K, Solda` G, Simons C, Sunkin S, Crowe M, Grimmond S, Perkins A, Mattick J. Long noncoding RNAs in mouse embryonic stem cell pluripotency and differentiation. Genome Res 2008;18:1433e45.
[10] Iorio M, Ferracin M, Liu C, Veronese A, Spizzo R, Sabbioni S, Magri E, Pedriali M, Fabbri M, Campiglio M, Me´nard S, Palazzo J, Rosenberg A, Musiani P, Volinia S, Nenci I, Calin G, Querzoli P, Negrini M, Croce C. MicroRNA gene expression dereg-ulation in human breast cancer. Cancer Res 2005;65:7065e70. [11] Chan J, Krichevsky A, Kosik K. MicroRNA-21 is an antiapoptotic
factor in human glioblastoma cells. Cancer Res 2005;65:6029e33. [12] Meng F, Henson R, Lang M, Wehbe H, Maheshwari S, Mendell J,
Jiang J, Schmittgen T, Patel T. Involvement of human micro-RNA in growth and response to chemotherapy in human cholangiocarcino-ma cell lines. Gastroenterology 2006;130:2113e29.
[13] Roldo C, Missiaglia E, Hagan J, Falconi M, Capelli P, Bersani S, Calin G, Volinia S, Liu C, Scarpa A, Croce C. MicroRNA expression abnormalities in pancreatic endocrine and acinar tumors are associ-ated with distinctive pathologic features and clinical behavior. J Clin Oncol 2006;24:4677e84.
[14] Asangani I, Rasheed S, Nikolova D, Leupold J, Colburn N, Post S, Allgayer H. MicroRNA-21 (miR-21) post-transcriptionally downre-gulates tumor suppressor Pdcd4 and stimulates invasion, intravasa-tion and metastasis in colorectal cancer. Oncogene 2008;27: 2128e36.
[15] Iorio M, Visone R, Di Leva G, Donati V, Petrocca F, Casalini P, Taccioli C, Volinia S, Liu C, Alder H, Calin G, Me´nard S, Croce C. MicroRNA signatures in human ovarian cancer. Cancer Res 2007;67:8699e707.
[16] Lee E, Baek M, Gusev Y, Brackett D, Nuovo G, Schmittgen T. Sys-tematic evaluation of microRNA processing patterns in tissues, cell lines, and tumors. RNA 2007;14:35e42.
[17] Meng F, Henson R, Wehbe-Janek H, Ghoshal K, Jacob S, Patel T. Mi-croRNA-21 regulates expression of the PTEN tumor suppressor gene in human hepatocellular cancer. Gastroenterology 2007;133:647e58. [18] Selcuklu SD, Yakicier MC, Erson AE. MIRN21 (microRNA 21). 2007. Available at: http://wwwatlasgeneticsoncology.org/Genes/-MIRN21ID44019ch17q23.html. Accessed May 2008.
[19] Zhu S, Si M, Wu H, Mo Y. MicroRNA-21 targets the tumor suppres-sor gene tropomyosin 1 (TPM1). J Biol Chem 2007;282:14328e36. [20] Rae J, Ramus S, Waltham M, Armes J, Campbell I, Clarke R, Barndt R, Johnson M, Thompson E. Common origins of MDA-MB-435 cells from various sources with those shown to have mela-noma properties. Clin Exp Metastasis 2004;21:543e52.
[21] Erson A, Niell B, DeMers S, Rouillard J, Hanash S, Petty E. Overex-pressed genes/ESTs and characterization of distinct amplicons on 17q23 in breast cancer cells. Neoplasia 2001;3:521e6.
[22] Ma L, Teruya-Feldstein J, Weinberg R. Tumour invasion and metastasis initiated by microRNA-10b in breast cancer. Nature 2007;449:682e8. [23] Zhao X, Li C, Paez J, Chin K, Ja¨nne P, Chen T, Girard L, Minna J, Christiani D, Leo C, Gray J, Sellers W, Meyerson M. An integrated view of copy number and allelic alterations in the cancer genome using single nucleotide polymorphism arrays. Cancer Res 2004;64:3060e71. [24] Sempere LF, Christensen M, Silahtaroglu A, Bak M, Heath CV,
Schwartz G, Wells W, Kauppinen S, Cole CN. Altered MicroRNA expression confined to specific epithelial cell subpopulations in breast cancer. Cancer Res 2007;67:11612e20.
[25] Xi Y, Formentini A, Chien M, Weir D, Russo J, Ju J, Kornmann M. Prognostic Values of microRNAs in colorectal cancer. Biomark In-sights 2006;2:113e21.
[26] Hsu S, Chu C, Tsou A, Chen S, Chen H, Hsu P, Wong Y, Chen Y, Chen G, Huang H. miRNAMap 2.0: genomic maps of microRNAs in metazoan genomes. Nucleic Acids Res 2008;36:D165e9. [27] Nakajima G, Hayashi K, Xi Y, Kudo K, Uchida K, Takasaki K,
Yamamoto M, Ju J. Non-coding MicroRNAs let-7g and hsa-miR-181b are associated with chemoresponse to S-1 in colon cancer. Cancer Genomics Proteomics 2006;3:317e24.
[28] Johannsdottir H, Jonsson G, Johannesdottir G, Agnarsson B, Eerola H, Arason A, Heikkila P, Egilsson V, Olsson H, Johannsson O, Nevanlinna H, Borg A, Barkardottir R. Chromosome 5 imbalance mapping in breast tumors from BRCA1 and BRCA2 mu-tation carriers and sporadic breast tumors. Int J Cancer 2006;119: 1052e60.
[29] He X, He L, Hannon G. The guardian’s little helper: microRNAs in the p53 tumor suppressor network. Cancer Res 2007;67:11099e101. [30] Sempere L, Sokol N, Dubrovsky E, Berger E, Ambros V. Temporal regulation of microRNA expression in Drosophila melanogaster me-diated by hormonal signals and broad-complex gene activity. Dev Bi-ol 2003;259:9e18.
[31] Lawrie C. MicroRNA expression in lymphoma. Expert Opin Biol Ther 2007;7:1363e74.
[32] Hayashita Y, Osada H, Tatematsu Y, Yamada H, Yanagisawa K, Tomida S, Yatabe Y, Kawahara K, Sekido Y, Takahashi T. A polycis-tronic microRNA cluster, miR-17-92, is overexpressed in human lung cancers and enhances cell proliferation. Cancer Res 2005;65: 9628e32.
[33] He L, Thomson J, Hemann M, Hernando-Monge E, Mu D, Goodson S, Powers S, Cordon-Cardo C, Lowe S, Hannon G, Hammond S. A micro-RNA polycistron as a potential human oncogene. Nature 2005;435: 828e33.
[34] Blenkiron C, Miska E. miRNAs in cancer: approaches, aetiology, di-agnostics and therapy. Hum Mol Genet 2007;16 Spec No 1: R106eR113.
[35] Eiriksdottir G, Johannesdottir G, Ingvarsson S, Bjo¨rnsdottir I, Jonasson J, Agnarsson B, Hallgrimsson J, Gudmundsson J, Egilsson V, Sigurdsson H, Barkardottir R. Mapping loss of heterozy-gosity at chromosome 13q: loss at 13q12~q13 is associated with breast tumour progression and poor prognosis. Eur J Cancer 1998;34: 2076e81.
[36] Hossain A, Kuo M, Saunders G. Mir-17-5p regulates breast cancer cell proliferation by inhibiting translation of AIB1 mRNA. Mol Cell Biol 2006;26:8191e201.
[37] Zhang L, Huang J, Yang N, Greshock J, Megraw M, Giannakakis A, Liang S, Naylor T, Barchetti A, Ward M, Yao G, Medina A, O’Brien-Jenkins A, Katsaros D, Hatzigeorgiou A, Gimotty P, Weber B, Coukos G. microRNAs exhibit high frequency genomic alterations in human cancer. Proc Natl Acad Sci USA 2006;103:9136e41. [38] Sinclair C, Rowley M, Naderi A, Couch F. The 17q23 amplicon and
breast cancer. Breast Cancer Res Treat 2003;78:313e22.
[39] Ohgaki K, Iida A, Kasumi F, Sakamoto G, Akimoto M, Nakamura Y, Emi M. Mapping of a new target region of allelic loss to a 6-cM
interval at 21q21 in primary breast cancers. Genes Chromosomes Cancer 1998;23:244e7.
[40] Sato M, Takahashi K, Nagayama K, Arai Y, Ito N, Okada M, Minna J, Yokota J, Kohno T. Identification of chromosome arm 9p as the most frequent target of homozygous deletions in lung cancer. Genes Chromosomes Cancer 2005;44:405e14.
[41] Spitz R, Oberthuer A, Zapatka M, Brors B, Hero B, Ernestus K, Oestreich J, Fischer M, Simon T, Berthold F. Oligonucleotide array-based comparative genomic hybridization (aCGH) of 90 neuroblasto-mas reveals aberration patterns closely associated with relapse pattern and outcome. Genes Chromosomes Cancer 2006;45:1130e42. [42] Nagayama K, Kohno T, Sato M, Arai Y, Minna J, Yokota J.
Homo-zygous deletion scanning of the lung cancer genome at a 100-kb res-olution. Genes Chromosomes Cancer 2007;46:1000e10.
[43] Ohnuki Y, Reddel R, Bates S, Lehman T, Lechner J, Harris C. Chro-mosomal changes and progressive tumorigenesis of human bronchial epithelial cell lines. Cancer Genet Cytogenet 1996;92:99e110. [44] Yao J, Weremowicz S, Feng B, Gentleman R, Marks J, Gelman R,
Brennan C, Polyak K. Combined cDNA array comparative genomic hybridization and serial analysis of gene expression analysis of breast tumor progression. Cancer Res 2006;66:4065e78.
[45] Viswanathan S, Daley G, Gregory R. Selective blockade of micro-RNA processing by Lin28. Science 2008;320:97e100.
[46] Piskounova E, Viswanathan S, Janas M, Lapierre R, Daley G, Sliz P, Gregory R. Determinants of microRNA processing inhibition by the developmentally regulated RNA-binding protein Lin28. J Biol Chem 2008;283:21310e4.
[47] Xie D, Jauch A, Miller C, Bartram C, Koeffler H. Discovery of over-ex-pressed genes and genetic alterations in breast cancer cells using a com-bination of suppression subtractive hybridization, multiplex FISH and comparative genomic hybridization. Int J Oncol 2002;21:499e507. [48] Aubele M, Auer G, Braselmann H, Na¨hrig J, Zitzelsberger H,
Quin-tanilla-Martinez L, Smida J, Walch A, Ho¨fler H, Werner M. Chromo-somal imbalances are associated with metastasis-free survival in breast cancer patients. Anal Cell Pathol 2002;24:77e87.
[49] Buchhagen D, Qiu L, Etkind P. Homozygous deletion, rearrangement and hypermethylation implicate chromosome region 3p14.3-3p21.3 in sporadic breast-cancer development. Int J Cancer 1994;57:473e9. [50] Lerebours F, Bertheau P, Bieche I, Driouch K, De The H, Hacene K, Espie M, Marty M, Lidereau R. Evidence of chromosome regions and gene involvement in inflammatory breast cancer. Int J Cancer 2002;102:618e22.
[51] Loo L, Grove D, Williams E, Neal C, Cousens L, Schubert E, Holcomb I, Massa H, Glogovac J, Li C, Malone K, Daling J, Delrow J, Trask B, Hsu L, Porter P. Array comparative genomic hybridization analysis of genomic alterations in breast cancer subtypes. Cancer Res 2004;64:8541e9. [52] Maitra A, Tavassoli F, Albores-Saavedra J, Behrens C, Wistuba I,
Bryant D, Weinberg A, Rogers B, Saboorian M, Gazdar A. Molecular abnormalities associated with secretory carcinomas of the breast. Hum Pathol 1999;30:1435e40.
[53] Blegen H, Will J, Ghadimi B, Nash H, Zetterberg A, Auer G, Ried T. DNA amplifications and aneuploidy, high proliferative activity and impaired cell cycle control characterize breast carcinomas with poor prognosis. Anal Cell Pathol 2003;25:103e14.
[54] Weber-Mangal S, Sinn H, Popp S, Klaes R, Emig R, Bentz M, Mansmann U, Bastert G, Bartram C, Jauch A. Breast cancer in young women (! or 5 35 years): Genomic aberrations detected by compar-ative genomic hybridization. Int J Cancer 2003;107:583e92. [55] Pierga J, Reis-Filho J, Cleator S, Dexter T, Mackay A, Simpson P,
Fenwick K, Iravani M, Salter J, Hills M, Jones C, Ashworth A, Smith I, Powles T, Dowsett M. Microarray-based comparative geno-mic hybridisation of breast cancer patients receiving neoadjuvant chemotherapy. Br J Cancer 2007;96:341e51.
[56] Cingoz S, Altungoz O, Canda T, Saydam S, Aksakoglu G, Sakizli M. DNA copy number changes detected by comparative genomic hybridization and their association with clinicopathologic parameters in breast tumors. Cancer Genet Cytogenet 2003;145:108e14.
[57] Charafe-Jauffret E, Moulin J, Ginestier C, Bechlian D, Conte N, Geneix J, Ade´laı¨de J, Noguchi T, Hassoun J, Jacquemier J, Birnbaum D. Loss of heterozygosity at microsatellite markers from region p11-21 of chromosome 8 in microdissected breast tumor but not in peritumoral cells. Int J Oncol 2002;21:989e96.
[58] Rummukainen J, Kyto¨la¨ S, Karhu R, Farnebo F, Larsson C, Isola J. Aberrations of chromosome 8 in 16 breast cancer cell lines by com-parative genomic hybridization, fluorescence in situ hybridization, and spectral karyotyping. Cancer Genet Cytogenet 2001;126:1e7. [59] Bhattacharya N, Chunder N, Basu D, Roy A, Mandal S, Majumder J,
Roychowdhury S, Panda C. Three discrete areas within the chromo-somal 8p21.3-23 region are associated with the development of breast carcinoma of Indian patients. Exp Mol Pathol 2004;76:264e71. [60] Ferti-Passantonopoulou A, Panani A, Raptis S. Preferential
involve-ment of 11q23~q24 and 11p15 in breast cancer. Cancer Genet Cyto-genet 1991;51:183e8.
[61] Shen K, Yang L, Hsieh H, Chen C, Yu J, Tsai N, Harn H. Microsa-tellite alterations on human chromosome 11 in in situ and invasive breast cancer: a microdissection microsatellite analysis and correla-tion with p53, ER (estrogen receptor), and PR (progesterone receptor) protein immunoreactivity. J Surg Oncol 2000;74:100e7.
[62] Nagahata T, Hirano A, Utada Y, Tsuchiya S, Takahashi K, Tada T, Makita M, Kasumi F, Akiyama F, Sakamoto G, Nakamura Y, Emi M. Correlation of allelic losses and clinicopathological factors in 504 primary breast cancers. Breast Cancer 2002;9:208e15. [63] Chen C, Frierson HJ, Haggerty P, Theodorescu D, Gregory C,
Dong J. An 800-kb region of deletion at 13q14 in human prostate and other carcinomas. Genomics 2001;77:135e44.
[64] Dahle´n A, Debiec-Rychter M, Pedeutour F, Domanski H, Ho¨glund M, Bauer H, Rydholm A, Sciot R, Mandahl N, Mertens F. Clustering of deletions on chromosome 13 in benign and low-malig-nant lipomatous tumors. Int J Cancer 2003;103:616e23.
[65] Guan X, Meltzer P, Dalton W, Trent J. Identification of cryptic sites of DNA sequence amplification in human breast cancer by chromo-some microdissection. Nat Genet 1994;8:155e61.
[66] Han W, Jung E, Cho J, Lee J, Hwang K, Yang S, Kang J, Bae J, Jeon Y, Park I, Nicolau M, Jeffrey S, Noh D. DNA copy number al-terations and expression of relevant genes in triple-negative breast cancer. Genes Chromosomes Cancer 2008;47:490e9.
[67] Ba¨rlund M, Tirkkonen M, Forozan F, Tanner M, Kallioniemi O, Kallioniemi A. Increased copy number at 17q22-q24 by CGH in breast cancer is due to high-level amplification of two separate regions. Genes Chromosomes Cancer 1997;20:372e6.
[68] Forozan F, Mahlama¨ki E, Monni O, Chen Y, Veldman R, Jiang Y, Gooden G, Ethier S, Kallioniemi A, Kallioniemi O. Comparative ge-nomic hybridization analysis of 38 breast cancer cell lines: a basis for interpreting complementary DNA microarray data. Cancer Res 2000;60:4519e25.
[69] Wu G, Sinclair C, Hinson S, Ingle J, Roche P, Couch F. Structural analysis of the 17q22-23 amplicon identifies several independent tar-gets of amplification in breast cancer cell lines and tumors. Cancer Res 2001;61:4951e5.
[70] Gunther K, Merkelbach-Bruse S, Amo-Takyi BK, Handt S, Schroder W, Tietze L. Differences in genetic alterations between pri-mary lobular and ductal breast cancers detected by comparative geno-mic hybridization. J Pathol 2001;193:40e7.
[71] Andersen C, Monni O, Wagner U, Kononen J, Ba¨rlund M, Bucher C, Haas P, Nocito A, Bissig H, Sauter G, Kallioniemi A. High-throughput copy number analysis of 17q23 in 3520 tissue specimens by fluorescence in situ hybridization to tissue microarrays. Am J Pathol 2002;161:73e9. [72] Pa¨rssinen J, Kuukasja¨rvi T, Karhu R, Kallioniemi A. High-level am-plification at 17q23 leads to coordinated overexpression of multiple adjacent genes in breast cancer. Br J Cancer 2007;96:1258e64. [73] James L, Mitchell E, Menasce L, Varley J. Comparative genomic
hybridisation of ductal carcinoma in situ of the breast: identification of regions of DNA amplification and deletion in common with inva-sive breast carcinoma. Oncogene 1997;14:1059e65.