ISTANBUL BILGI UNIVERSITY INSTITUTE OF SOCIAL SCIENCES ECONOMICS MASTER’S DEGREE PROGRAM
A VECM ANALYSIS FOR STOCK AND ESTATE MARKET INDEXES IN TURKEY: GLOBAL CRISIS CHANGED IT?
ÖYKÜ BAYRAKTAR 114622006
ASSOC. PROF. SERDA SELİN ÖZTÜRK
ISTANBUL 2019
i
ABSTRACT
A VECM ANALYSIS FOR STOCK AND ESTATE MARKET INDEXES IN TURKEY: GLOBAL CRISIS CHANGED IT?
Using the global financial crisis in 2007 as a natural experiment, the paper aims to examine the relationship between real estate prices and stock prices, by using data from the Turkish market covering years from 2002 to 2017. The impact of the crisis has been examined in 3 different time periods; pre-crisis, crisis and post-crisis. The study measures the dynamic adjustments between the first differences of the variables by using vector error correction model (VECM). The main findings of this paper are: (1) a long term relation among stock market index and REIT index. (2) In crisis period, the error correction coefficient is statistically insignificant, implying that the process is not converging in the long run, causing instabilities. (3) Speed of adjustment in the pre-crisis period, has the fastest short run dynamic in a long term equilibrium.
KEYWORDS: VECM, BIST 100, REIT, Global Financial Crisis, Exchange Rates, 1-Month Deposit Rate
ii ÖZET
TÜRKİYE'DE STOK VE GAYRİMENKUL PİYASASI ENDEKSLERİ İÇİN BİR VECM ANALİZİ: KÜRESEL KRİZ NASIL ETKİLEDİ?
Çalışma, 2007 yılı küresel finansal krizin doğal bir deney olarak kullanılmış olup, 2002 yılından 2017 yılına kadar Türkiye pazarından elde edilen veriler kullanılarak emlak fiyatları ile hisse senedi fiyatları arasındaki ilişkiyi incelemeyi amaçlamaktadır. Krizin etkisi 3 farklı zaman dilimi; kriz öncesi, kriz ve kriz sonrası ele alınarak incelenmiştir. Çalışma, vektör hata düzeltme modeli (VECM) kullanarak değişkenlerin ilk farklılıkları arasındaki dinamik ayarlamaları ölçmektedir. Bu yazının ana bulguları (1) borsa endeksi ile GYO endeksi arasındaki uzun vadeli dinamik bir ilişki mevcuttur. (2) Kriz döneminde, hata düzeltme katsayısı istatistiksel olarak anlamsızdır, bu da sürecin uzun vadede yakınsama olmadığını ve kararsızlığa neden olduğunu ima eder. (3) Kriz öncesi dönemde, uzun vadeye en kısa sürede yakınsandığı tespit edilmiştir.
ANAHTAR KELİMELER: VECM, BIST 100, GYO, Global Finansal Kriz, Döviz Kurları, Aylık Faiz Oranı.
iii
ACKNOWLEDGEMENTS
It would not be possible for me to complete this journey, and complete my thesis without the support and guidance of many people surrounding me.
I should initially express my thanks to Assoc. Prof. Serda Selin Öztürk, for her constant support, guidance and answering all of my questions patiently. Her encouragement and insight made the accomplishment of this thesis possible.
After all, I would like to express my deepest thanks to Cemil Can Sürücü; who has supported me all the way through this study, encouraged me from the beginning until the end.
Finally, I want to convey my utmost gratitude to my family. My parents, Hülya and Cemal Bayraktar who always heartened me and kept reminding me that every success is achievable as long as the desire and hard work remains.
iv
ABBREVIATIONS
ADF : Augmented Dickey Fuller
AIC : Akaike’s Information Criteria
CBRT : Central Bank of the Republic of Turkey CRSP : Center for Research on Security Prices
GDP : Gross Domestic Product
GYODER : Association of Real Estate and Real Estate Investment Co.
HQ : Hannan-Quinn Criterion
REIC : Real Estate Investment Company
REIDIN : Real Estate Information and Analytics REIT : Real Estate Investment Trust
NCREIF : National Council of Real Estate Investment Fiduciaries
VAR : Vector Autoregressive
VECM : Vector Error Correction Model
TurkStat : Turkish Statistical Institute
TOKI : Housing Authority
v TABLE OF CONTENTS ABSTRACT ... I ÖZET ... II ACKNOWLEDGEMENTS ... III ABBREVIATIONS ... IV LIST OF FIGURES ... VI LIST OF TABLES ... VII
INTRODUCTION ... 1
2. CONSTRUCTION INDUSTRY AND REAL ESTATE MARKET IN TURKEY ... 3
2.1. CONTRIBUTIONOFREALESTATEINTURKISHECONOMY ... 9
2.1.1. Building Permits Statistics and Percentage Changes ... 10
2.1.2. Turnover and Production ... 13
2.2. STRUCTUREOFREITSINTURKEY ... 14
3. LITERATURE REVIEW ... 21
4. DATA ... 26
4.1. CHOICEOFVARIABLES ... 26
4.2. DESCRIPTIVESTATISTICS ... 31
5. METHODOLOGY ... 34
5.1. THEVARMETHODOLOGY ... 35
5.2. TESTSOFNON-STATIONARITY ... 36
5.3. DETERMININGLAGLENGTH ... 39
5.4. TESTINGFORCO-INTEGRATION ... 40
5.5. THEVECTORERRORCORRECTIONMODEL(VECM) ... 42
6. EMPRICAL RESULTS ... 43
6.1. VECMRESULTS:PRE-CRISIS ... 44
6.2. VECMRESULTS:CRISIS ... 46
6.3. VECMRESULTS:POSTCRISIS ... 48
7. CONCLUSION ... 50
8. REFERENCES ... 52
9. APPENDIX ... 55
APPENDIX 1:AUGMENTED DICKEY-FULLER TESTS,E-VIEWS ... 55
APPENDIX 2:LAG LENGTH,AKAIKE INFORMATION CRITERION (AIC),E-VIEWS ... 59
APPENDIX 3:JOHANSEN COINTEGRATION TEST,E-VIEWS ... 60
vi
LIST OF FIGURES
Figure 1: GDP and Construction Sector Real Growth Rates (%) ... 3
Figure 2: House Price Index (yoy % change) ... 4
Figure 3: House Sales (thousands) ... 5
Figure 4: Price and Cost Developments in the Turkish Housing Market ... 6
Figure 5: Primary Rent in the Retail Property Market (EUR/m2) ... 7
Figure 6: Vacancy Rate in Class A Buildings in the Office Property Market (%) ... 7
Figure 7: Surface Area (million m2) ... 10
Figure 8: Number of flats (thousands) ... 11
Figure 9: Real Estate Confidence Index ... 11
Figure 10: Price Sentiment Index ... 12
Figure 11: Foreign Direct Investment (million USD) ... 12
Figure 12: BIST 100 index from 2002 to 2017 ... 27
Figure 13: BIST XGMYO index from 2002 to 2017 ... 28
Figure 14: BIST 100 & BIST XGMYO index from 2002 - 2017 ... 29
Figure 15: One-Month Deposit Rate from 2002-2017 ... 30
Figure 16: USD/TRY Exchange Rate from 2002-2017 ... 31
Figure 17: Econometric Methodology ... 34
Figure 18: All Variables in Log-Levels ... 38
vii
LIST OF TABLES
Table 1: Net Asset Value Of Real Estate Investment Trusts Net Asset Value Of
Real Estate Investment Trusts ... 15
Table 2: Two Types of REICs in Turkey ... 16
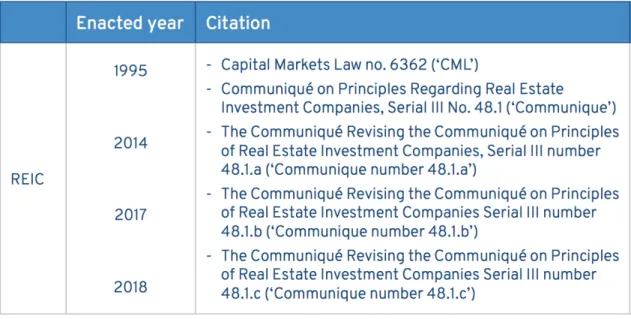
Table 3: Amendments through 1995 - 2018 ... 16
Table 4: General Information Of Real Estate Investment Trusts ... 18
Table 5: Requirements of Turkish REICs ... 19
Table 6: Crisis Periods ... 26
Table 7: Descriptive Statistics ... 32
Table 8: Unit Root Test, Augmented Dickey-Fuller Test ... 37
Table 9: Lag Length, Akaike Information Criterion (AIC) ... 39
Table 10: Johansen Cointegration Test ... 41
Table 11: Results of VECM for the pre-crisis, crisis, and post-crisis ... 43
Table 12: Results of VECM for the pre-crisis period ... 44
Table 13: Results of VECM for the crisis period ... 46
To my father Cemal, who resides at the depths of my heart…
1 INTRODUCTION
In every economy in the world, the stock market and housing market are two very different markets. The stock market is generally more liquid, more variable in price and can be described as similar. On the other hand, the housing market holds; different real estates such as residential, hotel and commercial buildings causing portfolio diversity. For this reason, it is difficult to find two identical objects in the market and it takes time to bring together buyers and sellers, and to ensure the continuity and growth of the market. Although there are differences in both markets, it attracts the attention of investors and affects the development and magnitude of the medium-long-term economy. However, one of the common points is that stock and housing markets are both affected by the changes in the economy, as many other macroeconomic variables.
The most supportive example is that the global crisis, which started in the United States and spread to all countries, had an adverse effects on both stock and property prices. There are many articles on the global crisis, and the first time that global crisis has spoken out is 9 August 2007, with BNP Paribas ending the cancellation of three hedge funds on the grounds of an complete destruction of the liquidity (Naifar, 2011). However, the start date of the crisis varies depending on the economic strength, stability and policies of the countries. One of the most devastating consequences of the crisis is that the housing market in most of the affected countries has been demolished in terms of price and supply. While the Global Crisis continued to affect all countries, the Case-Shiller Index lost value by 25% in the last two years from 2007 to 2008 (Barker, 2009). According to the International Building Association, the average housing price in the UK declined by 14.7% throughout 2008 and coincided with prices in the spring of 2005 (Adair et al., 2009). In Northern Ireland there was a higher decline and housing prices lost 28.2%. In the same study, Adair et al. (2009), it is argued that the debt of $ 7 trillion worldwide has been deleted from the stock exchange during 2008. The New York Stock Exchange S&P 500 has experienced a 38.5% drop in the 12-month period, while the Japan Stock Exchange Nikkei 225 has lost 42%.
The global crisis in the financial system gradually affected both the developed country economies and emerging market economies. Turkey is one of the emerging market economies, that has affected by the global crises drastically. Turkey is included in
2
the Standard and Poor’s and Citigroup BMI Global Index, in the first quarter of 2008, Turkish stock market performance had been showed the strongest reaction by dropping 36.62% (Standard and Poor's, 2008). Another factor affected by all these negativities was the real estate market and as a result of housing prices. REIDIN studies Turkish Residential Property Price Indices, in the period from March 2008 to March 2009 shows that there is a continuous ongoing decline in housing prices (Reidin Turkey, 2010). In addition to the not so-desired performance of house prices, the economy has not been satisfactory in the two-year period in terms of GDP Growth. GDP growth rates was down to 0,7% in 2008 and 4,7% in 2009 (TurkStat Statistical Yearbook, 2009). In addition to the sudden spikes that has affected Turkish Economy, showed improvement at the end of 2010. Coşkun (2011) argues that Turkey has faced less adverse effects from the global financial crisis compared to other countries that has affected terribly. Securitization, derivatives markets and the absence of housing loan market during the financial crisis are some of the reasons that has protected and detached Turkish economy.
Using the global financial crisis in 2007 as a natural experiment, the paper aims to examine the relationship between real estate prices and stock prices, by using data from the Turkish market covering years from 2002 to 2017. The impact of the crisis has been examined in 3 different time periods; pre-crisis, crisis and post-crisis.
A number of the above-mentioned relationship intensively investigated in the international market, however Turkish market has been less effort to assessed. By using the vector error correction model (VECM), we will examine the relationship of Real Estate Investment Trust (REIT) index, stock index, USD / TRY exchange rate and interest rate data. In addition, as far as is known, it has not been studied in Turkey or other developing countries, by a VECM model covering years from 2002 to 2017, in the present context previously.
The remaining paper is divided into sections 2–7. The organization of the article is detailed below. Section 2 covers the construction and real estate market in Turkey while referring the impact and importance. Section 3 reviews the literature that relates to the study. Section 4 describes the data set and examines first set of results, and Section 5 illustrates the statistical methodology which covered in the analysis. The empirical results are detailed in Section 6 according to different crisis periods. Finally, section 7 transmits the results of the article as a whole.
3
2. CONSTRUCTION INDUSTRY AND REAL ESTATE MARKET IN
TURKEY
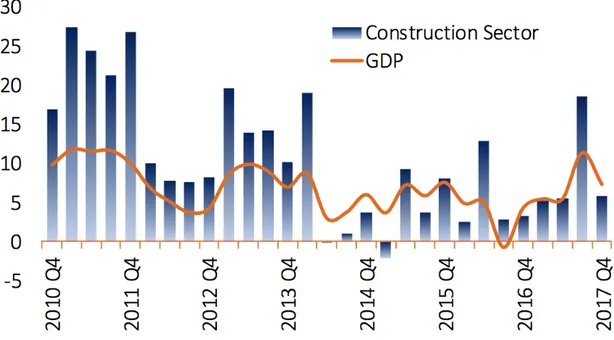
The Turkish construction sector grew by 8.9% yoy in 2017 in real terms with its strong growth performance in recent years. The highest growth rate was experienced in the 3rd quarter of 2017 and reached to 18.6% in the last 3.5 years. This development was the result of measures and policies taken by the government to support the economy. In addition, sales campaigns and low base effects, which have been carried out by some construction companies throughout the year, have also contributed to this strong growth. Although some government incentives have slowed down after the end of September 2017, the investment and consumption appetite has decreased gradually, as shown in Figure 1, construction sector grew faster than GDP in 2017, despite the slowdown in the sector.
Figure 1: GDP and Construction Sector Real Growth Rates (%)
Source: TÜİK, Datastream
However, in recent years, the gap between the rising pace of supply and demand has led to a surplus of supply in the housing market. This situation can be explained by the supply and demand imbalance of building and occupancy permits. According to the data, the average annual increase in the number of building permits was 12% between 2013-2017, while the number of occupation permits increased by only 3.1%. Therefore,
4
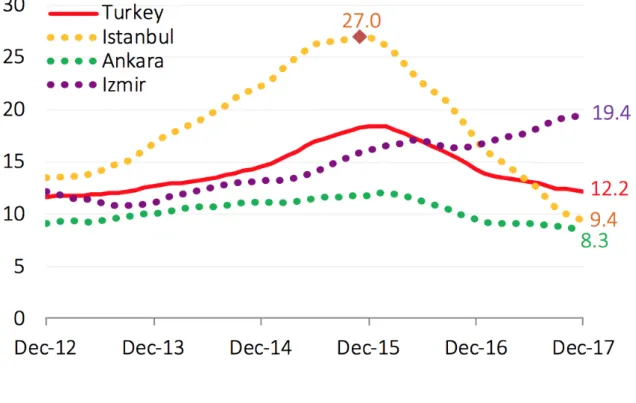
since the end of 2015, there has been a downward pressure on house prices, which got even stronger in 2017. As of December 2017, consumer inflation was realized 11,9%, while house prices across the Turkey was realized as 12.2% higher. However, cities such as Yalova, Bursa, Trabzon and Antalya have rising house prices trend thanks to the foreign investors. (Figure 2)
Figure 2: House Price Index (yoy % change)
Source: CBRT, Turkstat
The housing market has a share of approximately 60% in total construction activity. The noticeable rise in the housing market sector will become the largest business area we can observe the expansion easily. The demand for housing in recent years has been caused by many different factors, such as the increasing population and urbanization rate, the need for modern and earthquake-resistant buildings, urban transformation projects, favourable financing opportunities, strong investor preference due to relatively high returns, and increasing foreign investors’ appetite. As shown in the Figure 3, house sales throughout Turkey in 2017 increased by 5.1% yoy and was realized 1.4 million items compared to the same period in the previous year, while housing sales to foreigners constituting 1.6% of total sales, increased by 22.2% is noteworthy to mention.
5 Figure 3: House Sales (thousands)
Source: CBRT, Turkstat
Although the annual increase in house prices has slowed down for the last 2 years, prices have been increasing rapidly for a while. Price increases raised the question of whether there is a bubble in the housing market. That has brought the following question to mind: If it really is a bubble in the housing market, is it possible to explode?
Studies on the issue suggest that the definition of housing bubble cannot be explained by basic factors such as household demand (usually fed by demographic structure) and increasing costs, but it requires observation of housing price increases. In Turkey, as a result of the strong domestic demand and rising production costs of housing, the recent upward trend in housing prices can be explained. The reasons for contributing to the increase in housing prices can be listed as follows: increasing land prices that account for almost half of the production costs, an unexpected increase in construction iron prices and an increase in financing costs.
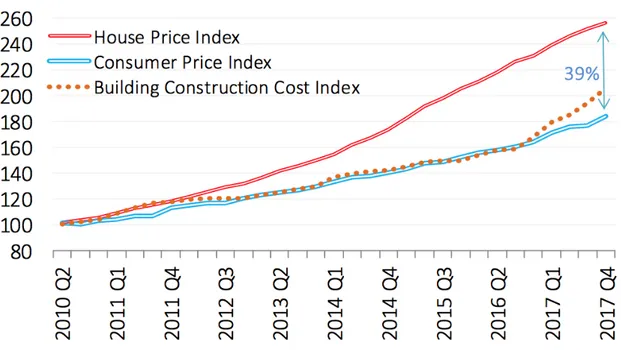
In Q1 - 2017 Q4, consumer prices increased by 84%, while the increase in construction costs was realized as 106%. When the cost effect and inflation is adjusted, Figure 4 shows that the real price increase in the housing market in this period is 39%. In fact, house prices in the US reached its peak in 2006, and the real price increase - just before the bubble explosion - rose by 73%. Therefore, there is not enough evidence to
6
prove the existence of a housing bubble in Turkey. Thus, it is possible to mention the existence of a price correction rather than the bursting balloon, as the surplus housing starts to reduce the market prices.
Figure 4: Price and Cost Developments in the Turkish Housing Market
Source: CBRT, Turkstat
In addition to the surplus in the housing market, the commercial real estate market has experienced the same problems in the same way. Factors behind supply and demand imbalance can be listed: strong growth in production and rapid increase in foreign exchange based commercial rents. In 2017, the depreciation of TL at high speed led to a significant increase in the rental costs of the retail sector and consequently the closure of the store locations.
Although the recent increase in the number of foreign visitors has been positive, the ongoing geopolitical risks and a significant change in the spending behaviour related to the change in the visitor profile have caused the trade volume to stagnate for the shops in the tourist regions. The mentioned risks also limit the investment appetite to build new shopping malls. Some of the projects planned to be started and / or planned as of 2018 were either postponed or cancelled. As a result, in the Figure 5 & 6 is shown that the increase in stocks in the office market and the increase in vacancy rates also led to a reduction in rental prices in 2017.
7
Figure 5: Primary Rent in the Retail Property Market (EUR/m2)
Source: CBRT, Turkstat
Figure 6: Vacancy Rate in Class A Buildings in the Office Property Market (%)
8
The growth and development of the construction sector in recent years is expected to continue in 2018 with the positive impact of ongoing infrastructure projects and urban transformation housing projects. However, expectation is that the growth rate in the sector will remain below the performance of the previous year. It is thought that housing production will be reduced and stocks will be melted by thanks to the improved price cuts and payments conditions supported by the state.
In the years of 2016-2017, since the terrorist attacks, a coup attempt and the state of emergency for almost 3 years have parallelized Turkish Economy, uncertainties have risen and led public and private investors to fled away. As a result, all the struggle has had negative effects on the Turkish economy. State has organized many measures to increase purchasing power, stimulate economic activities and provide investor confidence on these developments.
ü As of 2017, the Regulation on the Implementation of Turkish Citizenship Law, which granted Turkish Citizenship to foreigners acquiring immovable property worth USD 1 million, was amended. As a result, this change in regulation gets the attention of foreign investors from Russia, Middle East and Asia and aims to increase their real estate purchases in Turkey.
ü In March 2017, the construction contracts for land or revenue sharing models, as well as the stamp duty for construction tax contracts between construction contractors and subcontractors, and consultancy service contracts and construction supervision contracts for the works were removed.
ü With the decree dated 31.01.2017, stamp sales tax and real estate sales contracts in pre-paid housing sales contracts were realized as 0%.
ü At the end of 2016, the definition of risky areas was changed positively. In case the public security and order is broken, infrastructure services are insufficient and at least 65% of the total number of buildings is contrary to public housing law, infrastructure and superstructure, the area will be monitored as 'risky'.
In addition, at the beginning of 2018, ‘the savings account for housing’ system was redesigned. Planned measures such as;
ü increased public contribution to savings, ü lower housing interest rates,
9 ü reduced legal fees in housing purchases, and
ü recent changes to the Building Law1 may alleviate pressure on domestic demand. With the state contribution to be made, urban transformation projects will continue to be less problematic, and thus may stimulate domestic consumption activities in 2018.
2.1.CONTRIBUTION OF REAL ESTATE IN TURKISH ECONOMY Considering the medium and long-term view of the sector, the construction sector continues to be optimistic that the increasing incomes as a result of increased population and rapid urban development continue to support the development of the economy in the coming period. The government has taken new actions to make housing investments more attractive. Some of these are detailed below.
In the first instance, actions were taken on the use of real estate certificates in order to facilitate access of the construction sector to finance. New arrangements have been made for the use of real estate certificates and development of interest-free financial instruments in urban renewal projects. In this way, the issuer of real estate certificates provides repurchase guarantees to investors in certain predetermined periods. In order to increase housing demand in the sector and to increase the growth of the sector, institutions such as GYODER, EMLAK REIT and TOKI organized new campaigns to reduce the housing loan costs as much as possible. For example; In GYODER's campaign, it provided financing with a monthly interest rate of 0.7% and a maturity of 10 years with 86 projects. As a result, increased housing sales can stimulate the growth of the construction material sector and other sub-sectors by creating a multiplier effect in the economy. As of the first quarter of 2017, the value-added loans, which add value to mortgage loans, have been increased from 75% to 80% and the value added tax (VAT), which was applied as 18% for the sales of houses above 150 square meters, was reduced to 8%. On the other hand, the newly announced package for Eastern and South Eastern
1 The 'New Turkish Building Earthquake Regulation', which was published in the Official Gazette on March 18, 2018 and put into effect on 1 January 2019, is a more comprehensive revision. The revision includes a total of 17 chapters. Under the new regulation; development of revision works of high-rise, seismic-insulated, cold-formed steel and wooden buildings has been provided. (CBRT, 2018) (Economy, 2018) (Development, 2018) (OECD, 2018)
10
Anatolia includes additional investments for the housing sector and plans to build 66,789 new houses in these regions.
Turkey's demographic and economic characteristics, helps to maintain the vitality of the household sector. In recent years, with the view that the construction sector is the most contributing value to the growth of the economy, it has gained importance in parallel with the housing market. In this part of the study, Turkey's real estate sector and the housing sector is examined, statistical data describing the course of the housing market are presented.
2.1.1. Building Permits Statistics and Percentage Changes
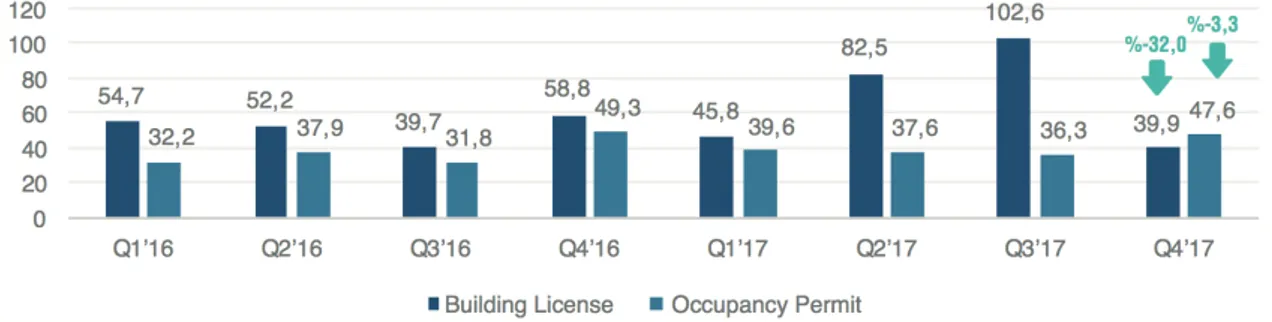
Based on the surface area in the 4th quarter of 2017; the number of building licenses decreased by 32,0% compared to the 4th quarter of 2016 and the number of occupancy permits2 decreased by 3,3%. (Figure 7)
Figure 7: Surface Area (million m2)
Source: Turkish Statistical Institute
Note: Rates of change are given according to the same period of the previous year.
2 The Land Development Law No. 3194 details the need for a residence permit in all new buildings. For this purpose, the authorized municipality supervises the building and verifies that it is suitable for the project. These authorities then grant the occupancy permit. The law establishes a 30-day legal period for the municipality to grant a residence permit. Process takes up an average of 2 months. (The Real Estate Sector in Turkey, JLL, 2017)
11
According to the number of flats, the amount of building license decreased by 40.1% in 4th quarter of 2017 compared to the 4th quarter of 2016 while the amount of occupancy permit increased by 2.1%. The new housing production and supply of completed housing continue. (Figure 8)
Figure 8: Number of flats (thousands)
Source: Turkish Statistical Institute
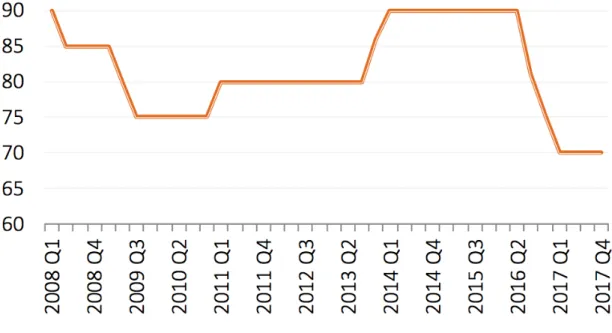
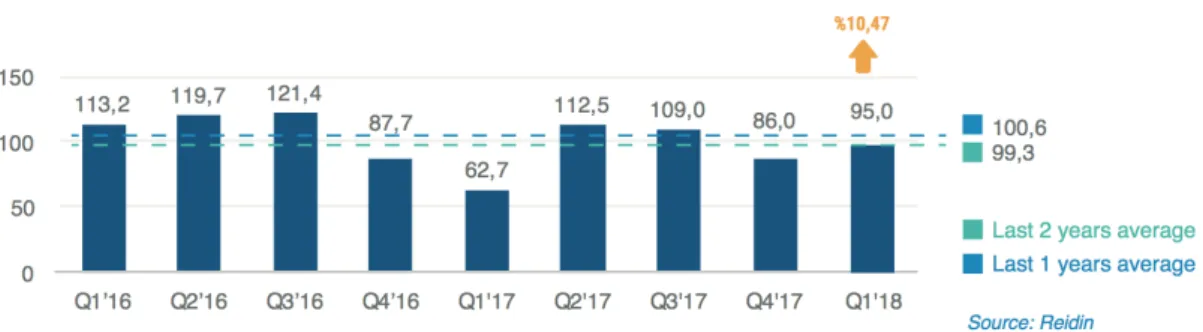
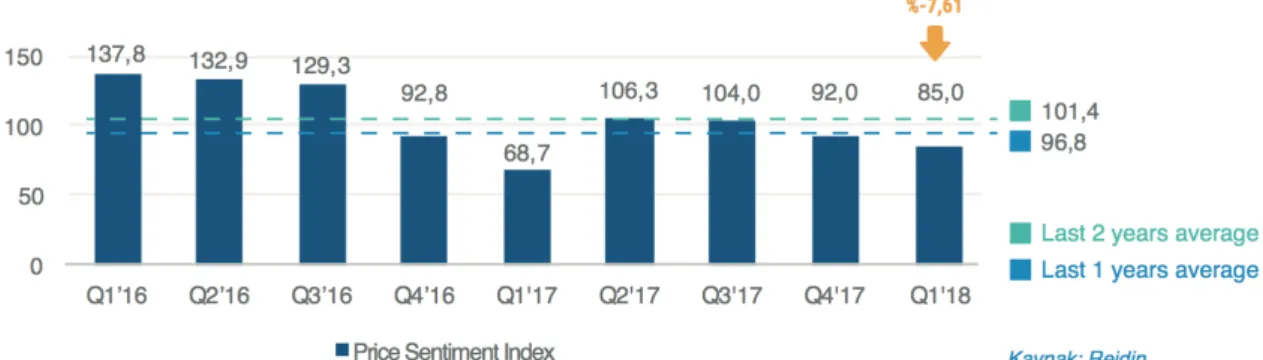
Note: Rates of change are given according to the same period of the previous year. Sectoral confidence measurements are an important factor for the investor's future investment decisions. CBRT policies, recent economic developments, credit market conditions and geopolitical and global conditions directly affect sector confidence. The terrorist attacks on Turkey's agenda, which adversely affects domestic security risks and uncertain environment confidence index. For all these reasons, the construction sector is often fluctuating for the confidence index. As shown in Figure 9 and 10 respectively, the Real Estate Confidence Index, which was measured as 95 in the first quarter of 2018, remained below 100,6, average of the last year, while the Price Expectation Index, measured as 85, remained below last year’s average of 96,8. The indices fell from the level of “Partially Optimist” to the “Partially Pessimist”.
Figure 9: Real Estate Confidence Index
12 Figure 10: Price Sentiment Index
Source: REIDIN
Since Turkish real estate market, has won the attention of international investors after the global crisis and showed a stable and sustainable growth in the new era. As a result of the enactment of the law of reciprocity Turkey, real estate exceeded the 4.1 Mio USD by 1st quarter of 2015. Looking at the investment side by the end of 2017, FDI inflows rose to US $ 3.180 million, while total FDI inflows to real estate sales to foreigners amounted to US $ 960 million. The real estate market is estimated to have 22% share in FDI. As shown ın Figure 11, the decline in direct investment inflows and foreign real estate sales figures continued throughout the year.
Figure 11: Foreign Direct Investment (million USD)
13 2.1.2. Turnover and Production
Another important indicator of the construction sector is the turnover and production indices that underline its place in the economy. The indicators provide the follow-up of cash inflows from housing sales and also provide the analysis of seasonal effects and seasonally adjusted data.
According to TurkStat data, the calendar adjusted construction income index increased by 12.7% in the 4th quarter of 2017 compared to the 4th quarter of 2016. Similarly, at the end of 2017, the annual decrease has decreased by 14.2%. On the other hand, the seasonally and calendar adjusted construction income index decreased by 0.4% in the 4th quarter of 2017 compared to the 4th quarter of 2016.
Also, seasonally and calendar adjusted construction production index followed an upward trend as of the third quarter of 2014. It is only affected by the seasonality and has shown a positive performance for the last 3 years. According to TurkStat data, the index displayed a strong course throughout 2016 except for the third quarter. Despite the slight decline in the last quarter of 2017 compared to the 4th quarter of 2016, the upward trend continued throughout the year.
Another indicator that is questioned when examining the construction sector is the tendency of the turnover index to building and outside the building.
In the first quarter of 2017, the total turnover of the construction sector increased by 13.7% compared to the previous year. The said positive growth continued in the 2nd quarter and the index increased by 28% due to the revival and encouragement in the first half of the year. Although the revival of the Russian market supported domestic construction projects, turnover in infrastructure and mega projects followed a fluctuating course.
14
2.2. STRUCTURE OF REITS IN TURKEY
Measurement of house price changes brings along some difficulties in terms of methodology. Difficulties usually arise from the fact that demand does not occur at a certain frequency or trend, the quality of non-fixed household and neighbourhood, and the heterogeneity of houses. These factors prevent 'accurate' estimation of home price movements. To meet these challenges, several institutions have developed several home price indexes with different methodologies. In many studies such as; Okunev, Wilson, & Zurbruegg (2000), Gyourko and Keim (1992), real estate investment trust (REIT) index was used to estimate the change in real estate prices. The index, as mentioned above, can respond to many challenges and most importantly is comparable to the indices of different countries. Also, REITs are listed on the stock exchange and highly liquidity compared to other stocks. As explained by Eichholtz and Hartzell (1996), this could be an explanation of why the REIT is closer to the movements on the stock exchange than other estimators of property prices.
Turkey’s real estate sector by providing employment to the various sub-sectors and creating business volume, has become the biggest supporter and the locomotive of the national economy, also created a continuous and regular jobs and reduces both general and seasonal unemployment. The implementation of REIT regimes supported the expansion of real estate markets worldwide. Currently, there are REIT regimes in 13 EU countries and represent 84% of EU GDP. In addition to forming the basis of the global economy, REITs continue to be extremely attractive to pension funds, insurance companies and other long-term investors (EPRA Global REIT Survey, 2018).
In Turkey the result of the absence of concepts and functions of a ‘trust’, REITs, are configured as Real Estate Investment Companies (REIC). REIX can invest in real estate, real estate market, real estate projects and real estate rights; is a capital market organization that allows the diversification of the portfolio (Chiang, Y.H., et. al., 2008). In 1995, the Capital Markets Board of Turkey (CMB) after the first legislation made by REITs started to work.
Turkish REICs are companies that are listed in the stock exchange in Istanbul and are exempt from corporate tax. REICs bring together resources from many different investors; realizes various, valuable and high amounts of real estate investments. Thus, while individual investors cannot make large real estate investments with their own
15
savings, they are given the chance to get indirect shares with REIC investment. In this way, REICs have the opportunity to invest in real estate projects and create a real market through the sale of shares in the stock exchange for illiquid real estate. However, it can be claimed that the REICs, listed on the stock exchange, are traded with a significant discount in trade, contrary to the importance. (Titman & Warga, 1986). Table 1 is a proven example for the Titman & Warga (1986) study. Although the number of REICs are increased only by 34%, the total assets are increased by 3 times and the value of total assets 2.5 times larger than total market value.
There were 23 REICs in 2011 in Turkey as shown in the Table 1 below and this number has reached to 31 in the last period of 2017, expanded by 34%. Market value of 23 REICs was 11.7 Mio TL and this was costed at 6.224 Mio USD in 2011. This market value has reached to 7.125 Mio USD in 2017. The year of 2014 has the biggest market value which is 9.462 Mio USD. The REICs in Turkey have not a regular increase in market value thanks to the USD/TRY appreciation3. Thus, after 2014 market value of REICs has decreased till 2017, although the number of companies has increased regularly. Table 1: Net Asset Value Of Real Estate Investment Trusts Net Asset Value Of Real Estate Investment Trusts
Source: CMB Monthly Statistical Bulletin, December 2018
As of the end of 2017, there are 31 REICs traded on the Istanbul Stock Exchange (BIST) with index name of BIST Real Estate Investment Trusts Index (XGMYO). The real estate in their portfolio includes various assets such as housing, office, shopping
3 USD/TRY appreciated 9% by 2014. 26%, 21%, and 7% respectively from the yerars between 2015 to 2017 year-end.
Thousand TRY Million $ Thousand TRY Million $
2011/12 23 11.708 6.224 20.770 11.041 2012/12 25 15.782 8.857 24.087 13.518 2013/12 30 18.632 8.730 37.573 17.605 2014/12 31 21.981 9.462 42.059 18.105 2015/12 31 21.280 7.279 52.530 17.969 2016/12 31 24.962 7.080 60.602 17.189 2017/12 31 26.924 7.125 67.162 17.774
Total Market Value Total Assets Number of
REICs Year
16
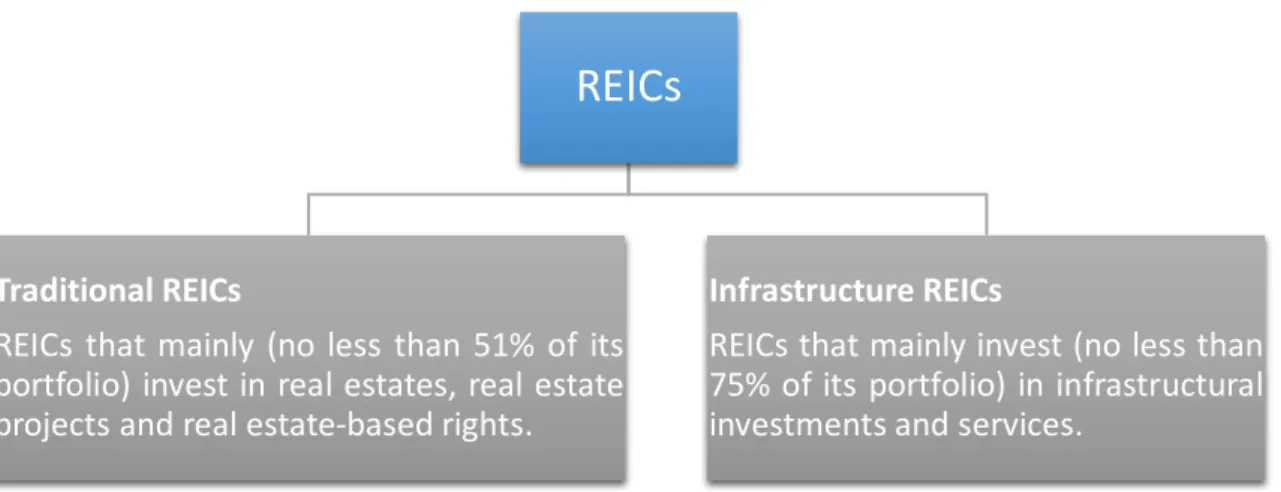
centres and hotels. First legislation was passed in 1995 by CMB of Turkey. In 2003, some changes have made on the management structure, incorporation, legal form, capital and some other requirements. Since the beginning of 2009, the Capital Markets Board (CMB) constituted different type of real estate trust – a regulated company: the Infrastructure Real Estate Investment Company (IREIC4). Table 2 summarises the two types of REICs Turkey, at present all REICs except one are traditional REICs. The latest major amendment about Turkish REICs was published in January 2017, covering how to practice initial capital, profit distributions, assets or other minor amendments.
Table 2: Two Types of REICs in Turkey
Source: Capital Markets Board of Turkey
Furthermore, a new amendment to extend the period of the temporary clause was published on May 10, 2018. Table 3 gives an overview of the year in which the amendments are published. As of 2018 Turkey REIT continues to grow. The following 3 developments are examples of this growth.
ü One infrastructure REIT is established. ü Three traditional REITs are in the pipeline.
ü Four electricity distribution companies’ applications are under way to become REIT with infrastructure concentration.
Table 3: Amendments through 1995 - 2018
4 IREICs are investment companies that manage the portfolios of infrastructure investments and services, exempt from corporate tax.
REICs
Traditional REICs
REICs that mainly (no less than 51% of its portfolio) invest in real estates, real estate projects and real estate-based rights.
Infrastructure REICs
REICs that mainly invest (no less than 75% of its portfolio) in infrastructural investments and services.
17 Source: Global REIT Survey 2018, ERPA
Turkish REITs, in order to create profits through the various real estate portfolio in the real estate market, also providing easy access, has entered as an advantageous investment. Thus, REITs attract the attention of both domestic and foreign investors. Portfolios are enormous and the total asset value of the listed REICs reached TL 67 million as of December 31, 2017. All of REITs in Turkey is being listed in Table 4 is a summary of financial information.
Table 4 provides general information about Turkish REICs market values of the 4th quarter of 2017. According the Table 4, the largest company is Emlak Konut Gayrimenkul Yatırım Ortaklığı with its market value of 10.678.000.000 TRY, total assets of 20.527.994.000 TRY and number of outstanding shares of 3.800.000.000, besides this its Q4 of 2017 stock price is 2,81 TRY.
Emlak Konut REIT was established in 1953. Principal activity is the production of housing. Emlak Konut REIT, is one of Turkey's most established companies. REIT buys land, develops real estate for middle and upper middle income groups, executes marketing and sales activities. In 2002, the Company became a Real Estate Investment Trust. TOKI owned REIT portfolio in terms of real estate and land taken into account, the stock is the largest, in terms of market value, real estate investment trusts operate in Turkey. First public offering was in 2002 and the secondary offering were realized in 2013, becoming the 5th largest public offering in the history of the Turkey.
18 Table 4: General Information Of Real Estate Investment Trusts
Source: CMB Monthly Statistical Bulletin, December 2018
(TRY) (TRY) (TRY) (TRY) (TRY)
1 AKFEN GAYRİMENKUL Y.O. 1.000.000.000 184.000.000 184.000.000 59,39 34,15 0,09 6,37 1.217.053.500 2,41 443.440.000 2 AKİŞ GAYRIMENKUL Y.O. 500.000.000 430.091.850 430.091.850 91,22 2,25 2,00 4,52 4.264.607.448 3,13 1.346.187.491 3 AKMERKEZ GAYRİMENKUL Y.O. 75.000.000 37.264.000 37.264.000 82,00 0,00 8,65 9,35 240.541.899 20,46 762.421.440 4 ALARKO GAYRİMENKUL Y.O. 20.000.000 10.650.794 10.650.794 56,14 0,00 41,41 2,45 926.964.533 50,85 541.592.875 5 ATA GAYRİMENKUL Y.O. 135.000.000 23.750.000 23.750.000 68,55 0,00 29,39 2,06 96.717.405 4,79 113.762.500 6 ATAKULE GAYRİMENKUL Y.O. 200.000.000 154.000.000 154.000.000 86,17 0,00 6,57 7,26 388.587.305 2,05 315.700.000 7 AVRASYA GAYRİMENKUL Y.O. 360.000.000 72.000.000 72.000.000 72,75 0,00 21,67 5,58 175.460.856 1,58 113.760.000 8 DENİZ GAYRİMENKUL Y.O. 95.000.000 50.000.000 50.000.000 70,39 11,78 6,55 11,28 249.932.600 2,70 135.000.000 9 DOĞUŞ GAYRİMENKUL Y.O. 500.000.000 332.007.786 332.007.786 98,36 0,00 0,77 0,87 1.165.054.708 3,24 1.075.705.227 10 EMLAK KONUT GAYRİMENKUL Y.O. 4.000.000.000 3.800.000.000 3.800.000.000 67,24 0,00 2,88 29,88 20.527.994.000 2,81 10.678.000.000 11 HALK GAYRİMENKUL Y.O. 1.500.000.000 820.000.000 820.000.000 87,52 0,00 5,18 7,30 2.376.933.740 0,96 787.200.000 12 İDEALİST GAYRİMENKUL Y.O. 50.000.000 10.000.000 10.000.000 84,32 0,00 0,45 15,23 8.153.067 2,04 20.400.000 13 İŞ GAYRİMENKUL Y.O. 2.000.000.000 913.750.000 913.750.000 92,93 0,04 1,57 5,46 5.311.947.256 1,36 1.242.700.000 14 KİLER GAYRİMENKUL Y.O. 1.400.000.000 124.000.000 124.000.000 71,96 8,37 0,94 18,73 1.941.060.448 3,66 453.840.000 15 KÖRFEZ GAYRİMENKUL Y.O. 330.000.000 66.000.000 66.000.000 70,94 0,00 13,55 15,51 107.458.478 1,66 109.560.000 16 MARTI GAYRİMENKUL Y.O. 200.000.000 110.000.000 110.000.000 78,54 16,81 0,01 4,63 533.327.575 2,12 233.200.000 17 MİSTRAL GAYRİMENKUL Y.O. 100.000.000 39.000.000 39.000.000 75,04 0,04 1,34 23,57 287.433.543 7,39 288.210.000 18 NUROL GAYRİMENKUL Y.O. 200.000.000 80.000.000 80.000.000 84,61 0,00 0,68 14,71 1.841.010.507 4,75 380.000.000 19 ÖZAK GAYRİMENKUL Y.O. 300.000.000 250.000.000 250.000.000 82,05 6,05 6,37 5,53 2.525.074.338 2,34 585.000.000 20 ÖZDERİCİ GAYRİMENKUL Y.O 250.000.000 100.000.000 100.000.000 92,19 0,00 0,14 7,67 540.540.365 1,56 156.000.000 21 PANORA GAYRİMENKUL Y.O 90.000.000 87.000.000 87.000.000 94,97 0,01 2,31 2,71 926.112.775 4,89 425.430.000 22 PERA GAYRİMENKUL Y.O. 250.000.000 89.100.000 89.100.000 91,08 3,73 0,75 4,44 166.088.353 0,88 78.408.000 23 REYSAŞ GAYRİMENKUL Y.O. 500.000.000 246.000.001 246.000.001 83,73 2,07 7,26 6,94 1.895.927.195 1,27 312.420.001 24 SERVET GAYRİMENKUL Y.O. 1.000.000.000 52.000.000 52.000.000 76,79 8,05 1,90 13,26 423.584.991 3,04 158.080.000 25 SİNPAŞ GAYRİMENKUL Y.O. 1.000.000.000 600.000.000 600.000.000 61,77 3,64 1,35 33,24 1.992.895.169 0,77 462.000.000 26 TORUNLAR GAYRİMENKUL Y.O. 1.000.000.000 1.000.000.000 1.000.000.000 87,40 2,78 5,31 4,50 11.335.817.000 3,33 3.330.000.000 27 TSKB GAYRİMENKUL Y.O. 200.000.000 150.000.000 150.000.000 95,38 0,00 2,61 2,00 466.563.935 0,73 109.500.000 28 VAKIF GAYRİMENKUL Y.O. 500.000.000 217.500.000 217.500.000 84,11 0,00 2,56 13,33 1.152.183.130 2,60 565.500.000 29 YAPI KREDİ KORAY GAYRİMENKUL Y.O. 100.000.000 40.000.000 40.000.000 80,75 0,25 13,52 5,48 82.634.767 2,32 92.800.000 30 YENİ GİMAT GAYRİMENKUL Y.O 250.000.000 107.520.000 107.520.000 88,72 0,00 10,77 0,51 1.954.234.951 13,58 1.460.121.600 31 YEŞİL GAYRİMENKUL Y.O. 1.000.000.000 235.115.706 235.115.706 59,31 21,67 0,00 19,02 2.039.708.960 0,63 148.122.895
Affiliates Money and Capital Market Instruments Other Market Value Stock Price Total Assets Asset Allocation % Name of Company # Registered
Capital Paid in Capital Number Of Outstanding
19
All the terms and conditions required for Turkish REICs to be traded on the BIST and continue to be traded are summarized in Table 5 below and explained in the following subsections:
Table 5: Requirements of Turkish REICs
Source: Global REIT Survey 2018, ERPA
Legal Form Minimum Share Capital
Joint stock company TRY 30 million (for T-REITs and TRY 100 million (for Infrastructure T-REITs)
Organization Restriction
-stockholders must have a certain income and satisfy asset ownership requirements
-stockholders must not be involved in business, industry and agriculture outside of legally allowed -stockholders must not be involved in capital market activities other than for managing its own portfolio -stockholders must not be involved in construction
Shareholder requirements Listing mandatory
Only for company founders Yes
Restrictions on assets
Operative income Capital gains
T-REITs determine their own profit
distribution politics Will be regarded within the
Timing
Annually or quarterly.
Current income and Capital gains Witholding tax
Tax-exempt. Credit/refund may be possible.
4. Distribution Requirements
5. Tax Treatment
- Cannot make any expense or commission payment which is not documented or which materially differs from the market value.
-Cannot provide services by its personnel to individuals or institutions in project development, project control, financial feasibility and follow-up of legal permission except for the projects related or to be related with the portfolio.
- Cannot sell or purchase real estate for short-term consistently. 1. Legal & Organizational Requirements
2. Shareholder Requirements
3. Asset Requirements
Real estate investment company (REIC)
- Must primarily deal with portfolio management.
- Only transactions permitted by the Communiqué are allowed.
- The portfolio of a general purpose T-REITs is required to be diversified.
- If a T-REITsis established to display activity in a specific area or invest in a specific project, 75% of its portfolio must consist of assets mentioned in its title and/or articles of association. - Cannot be involved in the construction of real estate.
20
Despite being one of the first countries REIT system that has been applied for the first time in Turkey in 1995, many changes have been made in various arrangements until recently. Therefore, with the system to be modified periodically in Turkey, and due to the global REIT systems it remains the same, significant differences were formed as a result. These differences are particularly important for corporate governance practices at the firm level.
21 3. LITERATURE REVIEW
The relationship between macroeconomic variables and stocks has been the subject of many researches to date. Nowadays, increasing empirical analyses are taken attention on the correlation between the stock market and REITs. In this section, the studies that investigates the relationship between real estate and stock prices will be reviewed. Although this relationship has been studied intensively in many international markets, Turkey has made in less interference to evaluate.
One of the early researches, Liu and Mei (1992), concluded that the real estate market is correlated with the broad asset which are stocks, bonds, etc. The study used quarterly data from from January 1971 to December 1989, by constructing equally weighted real estate investment trust return series using a portfolio of 50 equity REITS on the CRSP. Dynamic Conditional Correlation GARCH model and panel regression method used in the study. As a result of panel regressions; It has been suggested that the relationship between national inflation rates and high global capital market uncertainty and its interaction with one of them leads to an increase in REIT correlations. In addition, it has been determined that the REIT correlations decrease with the default risk premium in the USA and the increases in global stock market volume. As a result, the finding of the study is that equity REITs behave more like small stocks and have minimal relationships with bonds. Ambrose et al. (1992), evaluated the relationship between the stock market and real estate prices, concluded that both variables exhibits co-integration in the long-run, by working data from US markets. Similar studies, Ling & Naranjo (1999), Peng & Schulz (2013) and Quan & Titman (1999) also found that the stock and real estate markets have a mutual relationship in which one variable affects or depends on the other. Quan and Titman (1999) included 17 countries5 and studied from 1984 to 1996 in the paper. As a result of a time series work; in 16 of 17 countries, the relationship was insignificant. In the model, stock prices, real estate prices have been investigated and in addition Gross Domestic Product (GDP), inflation and interest rates were included as
5 Germany, The Netherlands, Belgium, Spain, Australia, France, the U.K, Italy, Japan, New Zeeland, Singapore, Malaysia, Taiwan, Hong Kong, Thailand, Indonesia, and the U.S.
22
control variables. To further investigate the problem, the yearly data was extended. In this way, the prevalence study exhibited a notable positive correlation.
Eichholtz & Hartzell (1996) conducted a similar study from 1978 to 1993. For the real estate prices, a valuation-based index, NCREIF Property Index and the S&P500 index were used. The ordinary least squares regression model was used in the study in order to talk about correlation. It was concluded that significant and a negative correlation coefficient was occurred between S&P500 and NCREIF Property Index. In addition to the US market, the survey also examined the correlation between Canada and U.K. Both markets exhibited a desired conclusion, in which a significant and negative correlation coefficient was found. In addition, the interaction between real estate market and stock market in the USA has been investigated and the results have shown a strong positive relationship.
The vast majority of the studies have focused on developed countries, specially the US and UK, and less studies have focused on Pasific-Asia Countries. Sim and Chang (2006) analyzed the interaction between stock and real estate prices by conducting vector autoregression (VAR), employing the GDP growth rate and 3-year bond yield as control variables. It has been a study providing detailed and supportive evidence on the 'credit price effect' and 'wealth effect'. In the paper, quarterly data ranging from 1986 through 2005 was used for house prices and for the stock prices Korea Stock Exchange (KSE)’s index is employed. House price data was categorized both regional (Nation, metropolitan areas, mid - size cities, and rural areas) and type-wise (residential, commercial, and industrial land.). The study pointed out three conclusions. Firstly, in many regional real estate markets including house and land, real estate prices concluded to be Granger-cause stock prices. Thus, it is not expected to stock market to Granger-Granger-cause real estate market, an opposite causation. Secondly, supported by the VAR analysis, both commercial and industrial land markets were affected from the differentiation in stock prices in a more powerful way, rather than in residential land. Finally, based on the generalized impulse response function, study defended the hypothesis of credit-price affect industrial land prices.
Numerous papers have studied correlation between real estate and stock prices which vary from country to country and over time. Hoesli & Oikarinen (2012) presents
23
data from US, UK and Australia. The study concluded that REIT's performance is directly affected by real estate performance, less affected by stock returns.
Liow & Schindler (2014) concludes that the European, US and Asia-Pacific REIT markets are more integrated with global stock exchanges (including regional exchanges). However, mentioned regions are less integrated into their own local stock exchanges. In the study, Europe represents Germany, France, Denmark, and the United Kingdom; and Asia-Pacific represents Japan, Australia, Singapore and Hong Kong. These mentioned 9 real estate market represents 85% of the global market, all converted to US Dollars. Weekly data used in the study range from 1990 through 2011. The study intends to analyse not only the return and prices but also examines time framework in order to understand the interaction between stock and real estate market. Four different approaches: ‘dynamic conditional correlation (DCC)’, ‘causality in mean (CIM)’, ‘causality in variance (CIV)’, ‘time varying integration scores’, ‘principal component analysis (PCA)’, and finally ‘the return convergence approach’, are used examine the relationship between real estate and stock markets. Their findings suggest that, even though real estate and stock exchanges are also interrelated in terms of returns and volatilities, causality is less effective than others. It is observed that real estate markets moderately integrate with global stock markets in the long term. However, it can be said that these markets are becoming less integrated with regional exchanges.
Correlation analysis is not sufficient to describe the exact connection between stock market and real estate market. Information about causality lacks. If an event originates any other event, it can be said that there is a causality situation. In these cases, it is necessary to note that ‘time frame’ is involved, as well. If B is occurring after the occurrence of A, event B cannot cause 'Granger' to the event A. However, the opposite can be said about the event A. In this sense, causality among the stock and real estate market has attracted many studies before.
Su (2001) examined if long term equilibrium correlation exists between the stock and real estate markets in West of Europe, by applying threshold auto-regressive model through a causality test. The study used data from eight Western European countries from 2000 to 2007, and employed non-parametric ‘rank test’ to describe a long term equilibrium among the mentioned countries. Every country has given a different
Granger- 24
casualty results from one to another. A credit-price effect (unidirectional causality6) was observed in 3 countries such as Germany, the Netherlands and the UK. Unidirectional causality was occurred from the real estate market to the stock exchange. A wealth effect was occurred vice a versa. Unidirectional causality for this example happened to be from the stock exchange to the real estate market, in Belgium and Italy. Moreover, both causalities – a bilateral causality7 - were occurred in Spain, France and Switzerland. McMillan (2012) also discovered a bilateral causality occurring from the real estate trough stock market. McMillan (2012) used the causality model among the variables, gathering data from the US and U.K. using the ESTR model8. Data on property prices in the USA were calculated by the Census Bureau raging from 1974 to 2009.
Another identical paper, Kakes & Van Den End (2004), undertook analysis to distinguish causality in the Netherlands from 1985 to 2002. Besides real estate prices and Australia stock exchange index, the paper used ‘real disposable income’, ‘interest rate’ and ‘the 10-year government bond yield’ as control variables by utilizing vector autoregressive modelling. While estimating a VAR model, generalized impulse response function and the variance decomposition methodologies was used. The study concluded that when stock market is altered it affects the real estate market as well, by altering it. The empirical findings showed that stock indexes and interest rate explains the changes in real estate prices in the long term. Further analysis in the study showed that real estate owners' trading in the stock market increases the sensitivity of the housing prices to the stock market and increases both variables at the same rate.
Kallberg, Liu and Pasquariello (2005) examined how the existing relation among real estate and stock markets are affected by the Asian financial crises in 07-1997 with the reduction of the THB. The study focused on Asia Region that soma countries taken in to account which were; Malaysia, Indonesia, South Korea, the Philippines, Thailand, and Taiwan. Monthly time series of local equity returns gathered from 1990 through 1999. Using Granger Causality test and method of Bai, Lumsdaine, and Stock (1998), study identified that the monthly securitized returns and equity indices experienced in eight
6 Unidirectional causality occurs when event M changes event N, but N do not influence M.
7 Bilateral causality occurs when the events causes one another at the same time. 8 Exponential smooth transition model.
25
Asian countries are changing in the time series of returns and volatility. It was concluded that, as the regime breaks in eight Asian countries, domestic equity markets became more responsive to the volatility in currency markets.
In addition, Kapopoulos and Siokis (2005) examines a relationship among the real estate and stock market, as well. Paper utilizes a Granger causality test covering years from 1993 trough 2003, the study concluded that the wealth effect hypothesis accepted for Athens but not for the cities in Greece (urban areas, not rural). Wealth effect, that has been covered in the paper, explained ‘households that has unpredicted share in prices, increases the amount of houses built’.
The first of two articles using the co-integration approach, İbrahim (2010), investigated the relationship among stock market prices and real estate prices in Thailand, from 1995 to 2006. In order to investigate the effect of wealth, the analysis was made by including the actual output and consumer price data and a significant effect was found. In addition, it has been concluded that real activities have an important effect on both housing and equity prices.
Another study, Lean & Smyth (2012), studies Malaysia, using interest rates in the model as control variable. Instead of expressing data as an index rate, every REIT in Malaysia included in the data. While a wealth effect can be mentioned for some REITs, it has been concluded that there is evidence of feedback effects between real estate and stock markets for most of the others.
While the correlation among the variables such as; real estate market, stock market prices has been a wide-spread of interest in both developed and emerging market countries, no attempt has been made to asses Turkey until Yüksel (2016). The paper used global financial crises that happened in 2007 as a control conditions and examined if the relation among the variables; real estate and stock prices has evolved following the global crisis. A threshold co-integration framework employed for the research. Daily closing values were taken into consideration in the data used in the study. Data includes; real estate investment trust index, stock exchange index and the monthly interest rate; covering 2005 through 2009. When the results were taken into consideration, it was observed that the price effects of wealth and credit were different in the pre-crisis and
26
crisis periods. In the pre-crisis period in Turkey, wealth and credit price effects were observed. In the crisis period, only the effect of credit price has emerged.
4. DATA
The hypothesis of this thesis is to discover the relation among the real estate and stock market in Turkey, Using the global financial crisis occurred in 2007 as a control condition, by modelling the data using the VECM. The paper covers years between 2002 to 2017. Also, the impact of the crisis has been examined in 3 different time periods; pre-crisis, crisis and post-crisis. Four variables studied in the model were carefully selected by searching the relevant literature. BIST100 represents Stock Market, House Price Index is represented by BIST XGMYO. Finally, USD/TRY and one-month deposit rate relation to stock market investigated as well. This section contains information about the variables used in the study.
4.1.CHOICE OF VARIABLES
All data used in this study were taken from REUTERS DataStream on daily-basis. The data includes the stock market values of the real estate investment trust index quoted in BIST, the stock exchange index of BIST 100, the buying rates of the USD / TRY exchange rate and the monthly deposit rate.
The sample period covers 4,176 working days during the period when the global financial crisis of 2007 is continuing worldwide. The time period from January 01, 2002 to May 5, 2006 is categorized as the pre-crisis period, period from June 01, 2006 to January 30, 2009 is categorized as the crisis period whereas from February 02, 2009 to December 31, 2017 time period is categorized as the post-crisis period. Table 6 summarizes the crisis period, which will be referred to through the paper and will be explained how the time periods are decided in this section.
Table 6: Crisis Periods
START DATE END DATE PERIOD
1/1/2002 5/31/2006 pre-crisis
6/1/2006 1/30/2009 crisis
27
Borsa İstanbul was established in December 1985 with the short name of BIST. The effects of the global financial crisis, in the period until emerging in Turkey, stock index showed a high and remarkable growth.
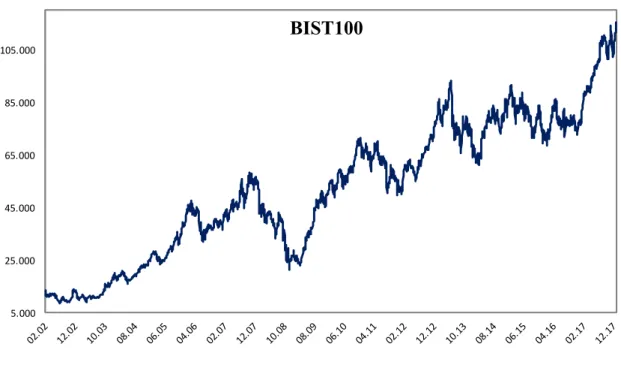
In 2002, total market value of 300 listed stocks’s market capitalization in BIST increased from 98 billion USD to 236 billion USD, and by the end of 2018, since USD/TRY depreciated market value was calculated 132 billion USD9. Figure 12 shows the levels of BIST 100 index covering from 2002 to 2007. As it is seen on the graph, from June 01, 2006 to January 30, 2009 BIST 100 experienced a remarkable decline.
Figure 12: BIST 100 index from 2002 to 2017
Source: DataStream
Employing real estate investment trust data is a common option to examine linkages among stock and real estate investments (Subrahmanyam, 2007) and also check for other studies of Gyourko & Keim (1992) and Okunev et al. (2000) for a similar approach. In order to monitor price movements of the real estates, a Housing Price Index, covering all of Turkey, was created by the Central Bank. The mentioned index started in January 2010 and takes place 8 years after the data we employ for this paper. The
9 Real Estate Investment Trust Index and Stock Exchange figures in this paragraph are obtained from BIST http://www.borsaistanbul.com/
5.000 25.000 45.000 65.000 85.000 105.000 BIST100
28
comparison of the price index and real estate investment trust index (not shown) between the years 2010 and the end of the year 2017 was sketched and showed that the REIT index since the portfolio is more various, is seemed to be volatile than the Index created by Central Bank. As noted previously in Turkey REITs had began to be recognized as of 1995, but since 1997 has been listed on the stock exchange. Turkish REITs do not have to pay both corporate and income tax, in the same way of other countries exempted. However, while other countries have to pay dividends yearly, this is invalid for Turkish REITs.
From the beginning of the study period, they accounted for approximately 1.21% of the Turkish Stock Exchange's total capital with 10 REICs traded on the BIST. In 2009, REITs were totals up to 14 and accounted for 2.08% of total market capitalization. As of the end of 2018, 31 REITs are listed in BIST. Figure 13 shows the levels of REIT shares between 2002 and 2017. As shown in the Figure 13, the most significant decline was realized between 2005 and 2006 and the index reached a maximum of 44.990 on 03/01/2006 and closed the day 06/13/2006 at 25.322. There has been a rapid decline of 43.7% between the relevant dates. REIDIN studies Turkish Residential Property Price Indices, in the period from March 2008 to March 2009 shows that there is a continuous ongoing decline in housing prices, as well (Reidin Turkey, 2010).
Figure 13: BIST XGMYO index from 2002 to 2017
Source: DataStream 0 10.000 20.000 30.000 40.000 50.000 60.000
29
Figure 14 shows the levels of BIST 100 and BIST XGMYO that moves together through the sample period. It is important that REIT and stock indices react together to certain time intervals. In the Figure 12, REIT and stock market indices graphed together, aiming to show the significant decrease from 2006 to 2008. As a matter of fact, the starting date of the crisis in June 2007 is based on this observation. Likewise, the global financial crisis has affected many countries at different times. For this reason, the analyses were repeated by selecting the start date of the crisis on May 1, 2006 and June 1, 2006, and June, 2006 was selected as the start date of the crisis.
Figure 14: BIST 100 & BIST XGMYO index from 2002 - 2017
Source: DataStream
The other variables used in the study are one-month deposit rate and USD/TRY exchange rate, also covering period from 2009 to 2017. Figure 15 shows the levels of One-Month Deposit Rate from 2002-2017. When the changes in interest rates are examined during the sample period, two striking trends are observed. The first is the upward trend that started in June 2006 and the second decline in the last quarter of 2008. 1-month deposit rate, which was 13% in May 2006, increased by 15% on June 8, 2006 and was realized as 15%. At the end of June 2006, it was increased by 53% compared to May 2006 and realized as 20.25%. After the said increases, the interest rate dropped to 15.50% at the end of 2018. Both of this period, can be explained by the capital outflows from emerging market countries, which is true to Turkey, as well (Yüksel, 2016).
0 20000 40000 60000 80000 100000 120000 140000
BIST 100 & BIST XGMYO
30
Figure 15: One-Month Deposit Rate from 2002-2017
Source: DataStream
In the said periods when interest 1-month deposit rate was affected, the Turkish Lira had depreciated significantly against the USD. Figure 16 represents the levels of USD/TRY exchange rate for the sample period. The exchange rate of USD/TRY, which was realized as 1.30 in May 2006, decreased by 20% against TRY, due to an increase of the exchange rate to 1.71 in June 2006. In addition, faster depreciation occurred in 2008. The exchange rate, which was 1.15 in January 2008, decreased by 33% in the last quarter of 2008 to 1.71. In both cases, the CBRT monetary policy resolutions are the opposite of each other. In the May-June period of 2006, despite an unforeseen and powerful monetary policy to tighten the economy, against capital outflows, an expansionary monetary policy executed in the last quarter of 2008 (Yüksel, 2016).
Yılmaz (2008) describes the statements which are opposed to each other, taking into consideration two different reactions, mostly due to economic dissimilarities and shock sources between the two periods. 2006 was a kind of predictor and precursor for the 2008 financial crisis. The reason for this is that the global crisis that triggered the whole world in 2008 was triggered by the start of the US mortgage crisis in 2006. Demand was strong in 2016, both locally and globally. Therefore, capital outflows triggered exchange rate movements and resulted in an appreciation in estimated inflation. However, the main reasons for the pressure on inflation are the global crisis and the decreasing domestic demand. The 2008 financial crisis, which is considered to be most shocking
0 10 20 30 40 50 60
31
crisis in the world since the 1929 crisis, caused remarkable changes in monetary policy. The Central Bank has taken measures in monetary policy and reduced the short term interest rates for balancing the monetary policies. The responses of macroeconomic variables in response to all these policies indicate and prove that the economic conditions are quite unlike in the crises period covering individually; pre-crisis, crisis and post-crisis periods.
Figure 16: USD/TRY Exchange Rate from 2002-2017
Source: DataStream
4.2.DESCRIPTIVE STATISTICS
To understand the distribution of variables, descriptive statistics will be useful. The mean, median, max., min., standard deviation, skewness, kurtosis and Jarque-Bera for BIST100, BIST XGMYO, 1-month deposit rate and USD/TRY exchange rate are shown. Descriptive statistics covering the whole sample period, including 4,176 observations, can be seen in Table 7 below. Descriptive statistics were analyzed separately in each of the 3 periods: pre-crisis, crisis and post-crisis.
1,00 1,50 2,00 2,50 3,00 3,50 4,00 4,50
32 Table 7: Descriptive Statistics
Notes: For Jarque-Bera test ‘a’ indicates significance at 1% level.
BIST 100 BIST
XGMYO
1 Month
Deposit Rate USD/TRY Mean 20.507 19.468 28,39 1,44 Median 18.234 15.990 22,63 1,39 Max. 47.729 44.990 59,00 1,76 Min. 8.627 7.981 12,00 1,26 Std. Dev. 10.491 10.182 13,89 0,12 Skewness 0,93 0,80 0,56 0,84 Kurtosis 2,87 2,46 1,88 2,45 Jarque-Bera 167,18a 136,94a 120,24a 148,58a PRE - CRISIS Descriptive Statistics BIST 100 BIST XGMYO 1 Month
Deposit Rate USD/TRY Mean 41.171 28.249 17,21 1,35 Median 40.720 31.059 17,60 1,33 Max. 58.232 38.876 20,80 1,73 Min. 21.228 10.269 11,25 1,15 Std. Dev. 8.241 7.882 1,24 0,14 Skewness -0,12 -0,89 -0,98 0,44 Kurtosis 2,75 2,75 4,44 2,13 Jarque-Bera 3,60 93,45a 171,70a 43,93a CRISIS Descriptive Statistics BIST 100 BIST XGMYO 1 Month
Deposit Rate USD/TRY Mean 70.638 36.047 8,31 2,23 Median 72.832 36.944 8,10 1,93 Max. 115.333 47.205 13,40 3,96 Min. 23.036 11.797 3,10 1,39 Std. Dev. 17.216 6.813 2,08 0,72 Skewness -0,19 -1,31 0,15 0,82 Kurtosis 3,49 5,01 2,07 2,40 Jarque-Bera 36,60a 1054,03a 92,07a 296,49a POST - CRISIS Descriptive Statistics
33
The performance of BIST100 and BIST XGMYO indices were analyzed during crisis periods. Although BIST100 outperforms BIST XGMYO all through the sampling period, during crisis and post-crisis BIST XGMYO have elevated volatilities compared to BIST 100 index. In the pre-crisis period, mean of the BIST 100 index is 20.507 and BIST XGMYO index is 19.460, concludes a lower volatility.
The mean value of all variables are greater than the median value which specifies that 4 variables are positively skewed. The adverse is valid for the ‘post crisis and crisis’ period for variables; BIST XGMYO and BIST100 index. Also, kurtosis value which diverges from 0, stipulates that the given data aren’t normally distributed. Thus, seemingly whole sample data is not normally distributed. Distribution of the variables are not normal in the given time intervals. The skewness values show that BIST 100 and BIST XGMYO, both variables are long right tails, and in contrary interest rate has a long left tail in all time intervals.
As it is shown in Table 7, the standard deviation of the BIST XGMYO index and 1-month deposit rate depreciates significantly10 throughout the crisis period from 10 to 7.8 while other variables show minor decreases.
10 In the periods used in the study, interest rates are very different from each other. Significantly low and high values are observed. After the banking crisis in 2001, an economic program was designed to combat inflation. With respect to all these, the monthly deposit rate of 65% in 2001 was reduced to 19% at the end of 2005.