THE REPUBLIC OF TURKEY
BAHÇEŞEHİR UNIVERSITY
COMPARING CLUSTERING METHODS
BASED ON LIFESTYLE TRENDS
Master Thesis
THE REPUBLIC OF TURKEY
BAHÇEŞEHİR UNIVERSITY
THE GRADUATE SCHOOL OF SOCIAL SCIENCES MARKETING
COMPARING CLUSTERING METHODS
BASED ON LIFESTYLE TRENDS
Master Thesis
DATEV YAZDANOGLU
Thesis Supervisor: ASSOCIATE PROF. DR. HUSEYIN INCE
FOREWORD
The completion of this dissertation was made possible through support and encouragement of many individuals, and I would like to take this opportunity to acknowledge them.
I would like to express my deepest appreciation and thanks for my advisor, Associate Prof. Dr.Huseyin INCE, for his guidance, support, helpful suggestions and endless enthusiasm for this study.
Very special thanks to BAREM research for significant support and helpful comments during the analysis stage of this study and gathering the life style survey data.
I owe my special thanks to my parents, my brother and my grandmother for them extensive help throughout this study.
Finally, I would like to thank beloved Natali BAPUCOGLU for her endless encouragement and support. This dissertation is dedicated to her.
ABSTRACT
COMPARING CLUSTERING METHODS BASED ON LIFESTYLE TRENDS
Yazdanoglu, Datev
Thesis Supervisor : Associate Prof. Dr. Huseyin Ince January 2011, 73 Pages
Cluster analysis is one of the most widely used methods to market segmentation which means that dividing a market into distinct subsets of consumers with common needs or characteristics. However, variety of factors are affecting the consumers’ decision and purchasing behaviour directly. The bases of these factors are respect of demographical, geographical, socio cultural and psychological causes.
In this research three clustering approaches, k-means, two-stage and self organizing map, are analyzed on the life style trend data set. The two main objectives of this study is identifying the possible consumer segments based on their life style trends and comparing the performance of three clustering approaches. Trend Statements were measured to cluster the consumers and three potential consumer segments, which were named as consistent, rebellious and traditional, were determined.After selecting the segments, the demographical characteristics of each segment are examined.
It can be mentioned that the consumers’ life style related concerns are significantly more important during the segmentation of market.While consistent segment are more open to eco living however not interested in living on the net and being master of the youniverse. The rebellious segment are more open to accelerated society trend and has an aim to living on the net and being master of the youniverse. On the other hand conventional group are close to erosion of trust, self reflection and culturel diversity trends.
ÖZET
KÜMELEME ANALİZİ YAKLAŞIMLARININ YAŞAM BİÇİMİ TRENDLERİ BAZINDA KARŞILAŞTIRILMASI
Yazdanoglu, Datev
Tez Danışmanı : Doç. Dr. Huseyin Ince Ocak 2011, 73 Sayfa
Kümeleme analizi, pazar segmentleri için sıkça kullanılan metodlardan biri olup, pazarın tüketicilerin genel ihtiyaç veya özellikleri açısından farklı gruplara ayrılması anlamına gelmektedir. Ancak faktör çeşitliliği, tüketicinin karar ve satın alma davranışını etkilemektedir. Bu faktörlerin temelleri demografik, coğrafi, sosyo kültürel ve psikolojik etmenlere dayanmaktadır.
Bu araştırmada, üç çeşit kümeleme yaklaşımı, k-means, two stage ve self organizing map, yaşam biçimleri veri seti üzerinde analiz edilmiştir. Yapılan çalışmanın amaçlarından ilki, muhtemel tüketici segmentini yaşam biçimlerine göre uygulamak, diğeri ise üç kümeleme yaklaşımlarının performansını karşılaştırmaktır. Çalışmanın uygulamada aşamasında tüketici davranışlarını kümelemek için yaşam biçimleri ifadeleri kullanılmıştır. Uygulama sonucunda oluşan üç küme asi, uyumlu ve geleneksel olarak adlandırılmıştır. Segmentler seçildikten sonra her bir segmentin demografik özellikleri incelenmiştir.
Pazar araştırmasında tüketicilerin yaşam biçimleri ile ilgili durumların çok önemli olduğu açıkça belirtilebilir. Uyumlu olarak nitelendirilen grup, çevreye karşı daha duyarlı ancak internette yaşamayı tercih etmeyip risk almaktan kaçınmaktadırlar. Asi grup ise, hayatı ve zamanı yakalamaya çalıştıkları için, internette yaşamak kaçınılmaz bir sonuç olmaktadır ve kendilerine olan güvenleri yüksektir. Diğer yönden, geleneksel grup kurumlara karşı güven problemi yaşamalarına rağmen kültürel farklılıklara açık ve başkaların karşı saygılı olmaktadırlar.
Anahtar Kelimeler: Kümeleme Analizi, Pazar Segmentasyonu, Yaşam Biçimi Trendleri, Kohonen Networks
TABLE OF CONTENTS LIST OF TABLES...vi LIST OF FIGURES...vii 1. INTRODUCTION……….1 2. LITERATURE REVIEW……….4 2.1. CLUSTER ANALYSIS………..……..4
2.1.1. Hierarchical Cluster Analysis……….……7
2.1.1.1. Single Linkage………..8
2.1.1.2. Complete Linkage………..…11
2.1.1.3. Average Linkage………....13
2.1.1.4. Ward’s Method………..…14
2.1.2. Partitional (Non – Hierarchical) Cluster Analysis………..15
2.1.2.1. K-means………...17
2.1.2.2. Fuzzy C-means………...18
2.1.2.3. Two stage clustering………..19
2.1.3. Self Organizing Map (Kohonen Network)……….21
2.2. MARKET SEGMENTATION………...….29
2.2.1. Bases for Segmentation………..31
2.2.2. Criteria for segmentation………..32
2.2.3. Market Segmentation Approaches………...34
3. METHODOLOGY………..41
3.1. RESEARCH DESIGN………...…….41
3.2. POPULATION and SAMPLING………..42
3.3. MEASUREMENT INSTRUMENTS………....43
3.4. DATA COLLECTION METHOD………...…….45
3.5. DATA PROCESSING………..…..47
3.6. DATA ANALYSIS………..48
4. RESULTS AND DISCUSSION……….50
4.1. DEMOGRAPHIC CHARACTERISTICS………..……….50
4.2. CLUSTER ANALYSIS RESULTS………...………52
4.2.1. Characteristics of Segments Based on Lifestyle Trends…………...…..52
4.2.2. Performance Comparison of Clustering Approaches………...58
5. CONCLUSIONS……….61
REFERENCES………...63
APPENDICES……….……73
Appendix 1- Life-style trend statements……..………...……..…74
Appendix 2- Socio economic statue table………..……….…..……….76
LIST OF TABLES
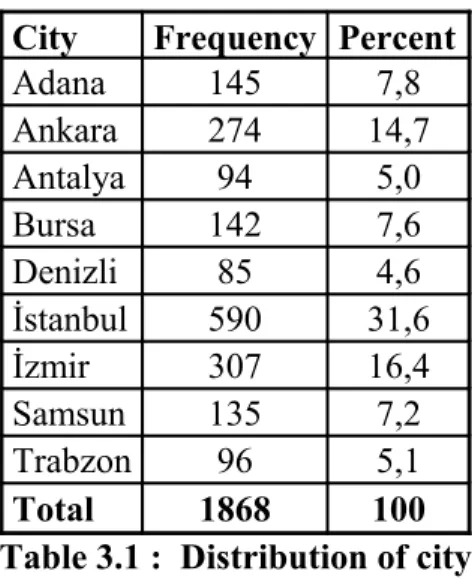
Table 3.1 : Distribution of city………..43
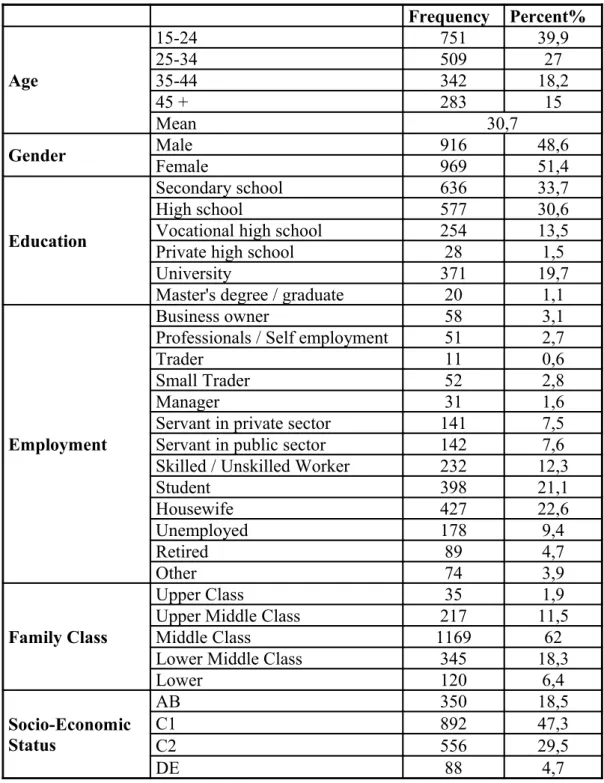
Table 4.1 : Characteristics of the Sample of Study...51
Table 4.2 : Final cluster sample distribution...53
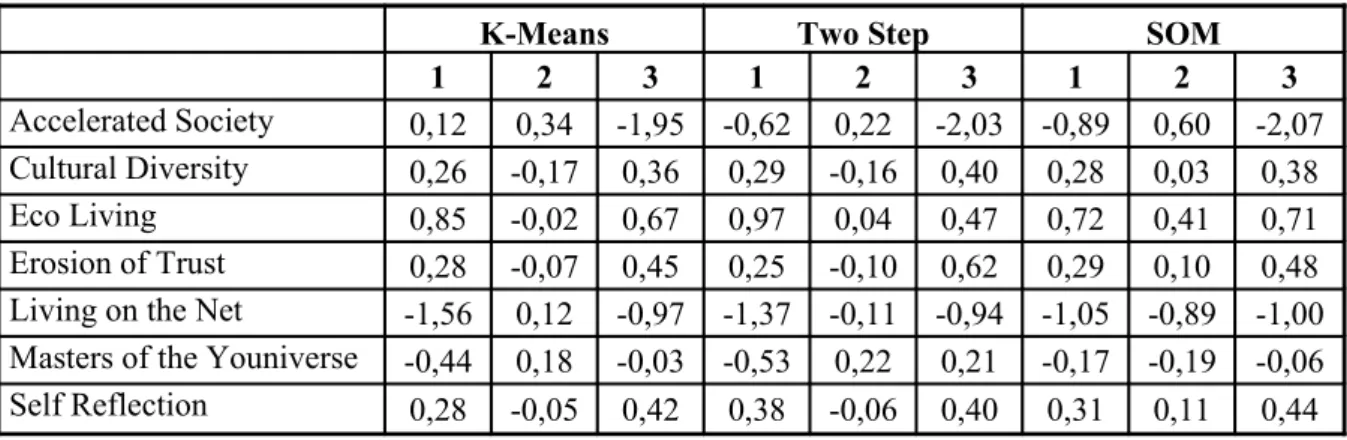
Table 4.3 : Final cluster centers with trends………...53
Table 4.4 : Significance test for k-means cluster analysis...55
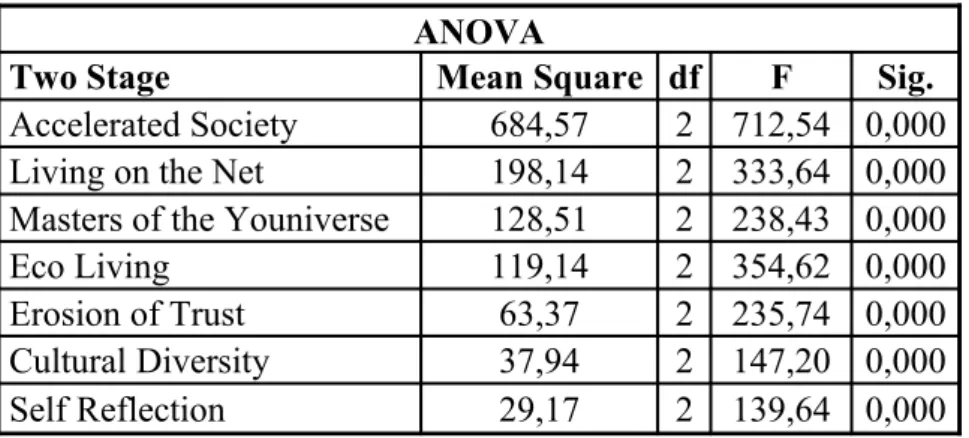
Table 4.5 : Significance test for two stage cluster analysis...55
Table 4.6 : Significance test for SOM cluster analysis...56
Table 4.7 : Sample characteristics of clusters for k-means approach...57
Table 4.8 : Total within cluster variance of the three approaches….………...59
Table 4.9 : Cross-tabulation of the k-means’ clusters and two stage’s clusters………...59
Table 4.10 : Cross-tabulation of the k-means’ clusters and SOM’s clusters………..…..60
LIST OF FIGURES
Figure 2.1 : Single linkage distance...8
Figure 2.2 : Complete linkage distance...12
Figure 2.3 : Average linkage distance...13
Figure 2.4 : Algorithm steps of fuzzy c-mean...19
Figure 2.5 : Two-stage clustering procedure...21
Figure 2.6 : Neural network for clustering………..22
1. INTRODUCTION
The most challenging concept in marketing deals with understanding consumer behaviour. The term of consumer behaviour is defined as the behaviour that consumers display in searching for, purchasing, using, evaluating and disposing of products and services that they expect will satisfy their needs (Schiffman & Kanuk, 2000). In today’s dynamic marketplace, in order to succeed in any business marketers need to know everything about consumers - what they want, what they think, how they work, how they spend their time. Having this knowledge and strong understanding of consumer behaviour would create successful marketing activities and the result of this rapidly evolving in the marketplace.
The main objective of this study is comparing three widely applied clustering techniques, k-means clustering, two stage clustering and self organizing map (SOM) clustering, to market segmentation which is one of the fundamental concepts of marketing to understand the consumer behaviour and determine the proper market strategy. These three approaches were performed on the real life-style research data set. The experimental results based on a life-style survey data set compared in respect of segments, determined by k-means, two stage and self organizing map clustering methods.
Although there are many hierarchical clustering approaches, in this study we applied k-means, two stage non-hierarchical clustering and self organizing map approaches. K-means clustering is the most frequently used and dominant technique for segmenting large datasets in the marketing area among the clustering areas (Gehrt & Shim, 1998). The method defines a fixed number of clusters, iteratively assigns records to clusters, and adjusts the cluster centers until further refinement can no longer improve the model. K-means clustering approach search for the optimum center locations to
minimize the total distance between the data and the centers based on the Euclidean distance. The main reason to prefer this approach is due to the faster computational algorithm, respect to the presence of outliers and producing tighter clusters than other hierarchical clustering methods (Mashor, 1998).
The other clustering method performed to classify the data is a non-hierarchical two stage clustering. If the number of clusters is unpredictable the user can choose two-stage clustering procedure. Two-two-stage is a clustering method that involves preclustering the records into a large number of subclusters and then applying a hierarchical clustering technique to those subclusters to define the final clusters. The first step is formation of preclusters which will be input of the second stage of hierarchical clustering. Preclusters are just clusters of the original cases that are used in place of the raw data to reduce the size of the matrix that contains distances between all possible pairs of cases. In the second step standard hierarchical clustering algorithm is used on the preclusters in order to merge the subclusters into larger and larger clusters (Huang, 1998). Two stage clustering approach has the advantage of automatically estimating the optimal number of clusters for the training data and it can handle large datasets or datasets that have a mixture of continuous and categorical variables.
Self organizing map, which was introduced by Kohonen, is a special type of neural network to define clusters and transform into visually decipherable maps in large data bases. Basically, the self organizing map network model consists of input and output layers, which is visually examining the relationship between input data and output data for identifying important patterns and clusters. When the network is fully trained, records that are similar should appear close together on the output map, while records that are different will appear far apart. Because of outperforming the traditional data reduction and clustering techniques and because of operating on very large samples and no need a priori assumptions about the distribution, self organizing map method has attracted a wide range of application especially in market segmentation (Kohonen, 1989).
Because of life-style characteristics provide a rich view of the market and depth understanding to the consumer behaviour, life-style information has become a popular tool in marketing application since the 1960’s. The main objective of life-style studies classifying consumers into segments with specific and identifiable patterns. On the bases of measured activities, interest and opinions (AIO) life-style research constructing consumers’ psychographic profiles (Plummer, 1971). Values, Attitudes and Lifestyles (VALS) is another concept of classifying American population into segments based on attitudes, lifestyles and decision making styles, which developed by SRI consulting in the late 1970’s and then revised in 1989 to focus more explicitly on explaining consumer purchase behaviour (Linda, 1999). Yankelovich’s segmentation methodology, Monitor Mindbase (1971), is based on consumers' actual purchasing behaviour and their likely behaviour. The Yankelovich Monitor study has gathered and trended the values, motivations and attitudes that redefine segments as market conditions change.
The rest of the thesis is organized as follows: Section 2 reviews the market segmentation and cluster analysis approaches. Section 3 describes the methodology of survey and the characteristics of data that we have used. In section 4 experimental results of two stage clustering, k-means clustering and self organizing map approaches are compared with the base on cluster outputs. The characteristics of segments are searched according to fit approach. The conclusion of our study is presented in section 5 with a summary of our findings.
2. LITERATURE REVIEW
This section explores the literature review of hierarchical, non-hierarchical and self organizing map clustering methods. The scope of this literature review is expanded to include market segmentation regardless of the using specific clustering methods.
2.1. CLUSTER ANALYSIS
Classification in the widest sense is one of the oldest scientific pursuits undertaken by humanity. In the general terms of classification can be defined as the process of giving names to a collection of different types of events, objects and people which are thought to be similar to each other in some respect. Classification has played an important role in the development of many areas of science including psychology, artificial intelligence, biology and zoology, chemical, astronomy, pattern recognition and marketing research area for segmentation(Jain, Murty, & Flynn, 1999).The property of clustering makes it become a popular tool for market segmentation. Segmentation theory proposes designed to identify groups of entities that share certain common characteristics such as needs and purchasing behaviours. Segmentation has consequently been regarded as one of the most critical element in marketing area for the achievement of successful marketing activities and customer relationship management by the companies (Berson, Smith, & Thearling, 2000).
Clustering is an unsupervised process of dividing patterns into groups such that each group is homogeneous with respect to predefined attributes. Cluster analysis is widely applied to many areas, such as customer and market segmentation, pattern recognition and image processing, bioinformatics or biomedicine application. These inductive techniques have been employed as a classification tool of market segmentation (Jain, Murty, & Flynn, 1999). Applications are distinct from the use of cluster analysis for classification and represent an alternative to representing similarity of data.
Classification is concerned with the identification of numerical taxonomies, where on the contrary structural representation is concerned with the development of a faithful representation of relationships. Both uses of cluster analysis are legitimate, but the objectives of these applications different from them. The best clustering algorithm regarding of these objectives is not necessarily the best for the other objective (Wedel & Kamakura, 2000).
Cluster analysis is a generic term for numerous methodologies which attempt to find similarity measures into homogeneous groups with respect to predefined attributes. Cluster analyses have been used in a variety of fields including both natural and social sciences. Some of these fields are data mining, identification of different consumer’s profiles, building up the stratified sampling and identification of the variables that have an inevitable important to describe a phenomenon (Mingoti & Lima, 2006). Cluster analysis, which takes a sample of variables and groups them such that the statistical variance among elements grouped together, is minimized while between-group variance is maximized. A critical issue to perform successful cluster analysis is the selection of the variables. Segmentation variables can be broadly classified into general variables and product specific variables. The general variables include the customer demographics and lifestyles. The product specific variables involve customer purchasing behaviours and intentions (Wedel & Kamakura, 1997).
Cluster analysis consists of grouping similar objects into distinct, mutually exclusive subsets known as clusters. Cluster analysis can be defined also as a statistical technique that sorts observations into similar sets or groups. Cluster analysis' sorting ability is powerful enough that it will provide clusters even if no meaningful groups are embedded in a sample. Thus, cluster analysis has the potential not only to offer inaccurate depictions of the groupings in a sample but also to impose groupings where none exist (Barney & Hoskisson, 1990).
The purpose of cluster analysis is to response to the general question facing researchers in many areas of inquiry is how to organize observed data into meaningful structure. Cluster analysis amalgamates data objects into constituent groups (natural groupings) such that objects belonging to the same cluster are similar, while those belonging to different ones are dissimilar. Natural groupings are also named as clusters having properties such as internal cohesion and external isolation. Until the 80’s the discussion concentrated mainly on techniques that encompass a number of different classification algorithms. At the end of the 80’s the whole process of clustering – starting with the selection of cases and variables then ending with the validation of cluster became dominant(Everitt, 1993).
Clustering methods can be divided into classification within each of the classification exists a wealth of subtypes and different algorithms for finding the clusters. The first classification of clustering procedures is between sequential and simultaneous algorithms. The most clustering algorithm is sequential method which searches for the equivalence relation repeated at all levels of similarity in the association matrix. The simultaneous algorithms, searches the solution which is obtained in a single step. The second classification is between agglomerative and divisive. Agglomerative procedures the objects are considered as being separate from one another. They are successively grouped into larger and larger clusters until a single cluster is obtained. On the other hand, if a single group containing all objects, divisive algorithms subdivides the group into sub-clusters, and so on until the discontinuous partition is reached. The most known common classification is hierarchical and non-hierarchical methods. In hierarchical methods, the members of inferior ranking clusters become members of larger, higher-ranking clusters. Non-hierarchical methods produce a single partition which optimizes within group homogeneity, instead of a hierarchical series of partitions optimizing the hierarchical attribution of objects to clusters (Sneath & Skol, 1973). In a such kind of various clustering algorithms affords a basis for establishing some general guidelines for the appropriate use of cluster analysis and The selection of the clustering algorithm appears to be critical to the successful use of cluster analysis.
2.1.1. Hierarchical Cluster Analysis
Hierarchical clustering algorithms are heuristic algorithms which begin by placing each unit in an individual group and proceed by combining these groups in hierarchical fashion until all units are grouped together and instead of producing a single clustering they produce a hierarchy of clustering (Theodoridis & Koutroumbas, 2006). Hierarchical approach help users on the way of identifying not only distinct clusters but also the subgroups they may contain. Additionally, agglomerative hierarchical clustering methods are considered to be the most popular cluster analysis technique. Agglomerative algorithms begin by grouping each unit individually and proceed by grouping the pair of units which has the greatest similarity, in another word the smallest distance (Gong & Richman, 1995).
The increasing number of cluster analysis methods available has led the selection of appropriate clustering algorithms is critical to the effective use of cluster analysis. Hierarchical algorithms progress through a series of steps that structure by either adding individual elements to (agglomerative) or deleting them from (divisive) clusters. The most popular agglomerative algorithms are single linkage, complete linkage, average linkage, centroid method, and Ward's method (Hair, 2000). The differences among them lie in the mathematical procedures used to calculate the distance between clusters. Each has different systematic tendencies or biases in the way it groups observations.
2.1.1.1. Single Linkage
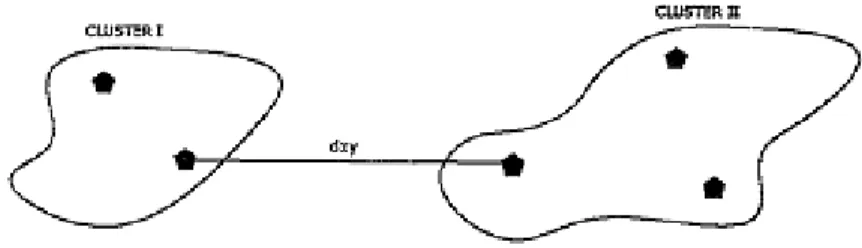
Single linkage clustering method’s logic is natural, so that it is defined as the principles of clustering and a simple to understand method. In single linkage clustering, distance between two clusters is defined as the minimum distance from any member of one cluster to any member of the other cluster. The method of forming clusters is
observation joined to as a cluster if it has a certain level of similarity with at least one of the members of that cluster. Connections between clusters are based on links between single entities. In this method, the distance between two clusters is determined by the distance of the two closest cases (neighbours) in the different clusters (Small, 1998). The equation of distance between clusters is,
D (CI,CII) = min XI Є CI, XII Є CII d(XI,XII) (2.1)
The measure of inter clusters is illustrated in following figure.
Figure 2.1 : Single linkage distance Source : Mulvey & Gingold, 2009
The algorithm for single linkage clustering is sequential, agglomerative, and hierarchical. Its starting point is any association matrix including similarity or distance among the objects or descriptors to be clustered. The method involves in two steps. First, the association matrix is rewritten in order of decreasing similarities or increasing distances, heading the list with the two most similar objects of the association matrix, followed by the second most similar pair, and proceeding until all the measures comprised in the association matrix have been listed. Second, the clusters are formed hierarchically, starting with the two most similar objects, and then letting the objects clump into groups, and the groups aggregate to one another, as the similarity criterion is relaxed (Demirel, 2004).
1 2 3 4 5 1 0 2 3 0 D1= 3 4 2 0 4 8 7 6 0 5 4 10 9 7 0
The smallest entry is that for individuals 2 and 3, consequently these are joined to form a two-member cluster. Distances between this cluster and the other three individuals are below;
d(23)1 = min [d12,d13] = d12 = 3 (2.2)
d(23)4 = min [d24,d34] = d34 = 6 (2.3)
d(23)5 = min [d25,d35] = d35 = 9 (2.4)
A new matrix is now constructed whose entries are inter-individual distances and cluster individual values.
23 1 4 5
23 0
D2= 1 3 0
4 6 8 0
5 9 4 7 0
The smallest entry is in D2 is that for individual (23) and 1, so these now form a three
d(123)4 = min [d231,d234] = d231 = 3 (2.5) d(123)5 = min [d231,d235] = d231 = 3 (2.6) 123 4 5 123 0 D3= 4 3 0 5 3 7 0
The smallest entry is in D3 is that for individual (123) and 4 or 5. The entry 4 is added to the cluster containing individuals 1,2,3. Finally the groups containing individuals 1, 2, 3, 4 and 5 are combined into one single. The partitions produced at each level are;
Level Groups 5 [1], [2], [3], [4], [5] 4 [1], [2 3], [4], [5] 3 [1 2 3], [4], [5] 2 [1 2 3 4], [5] 1 [1 2 3 4 5]
As a consequence of proceeding, results of single linkage clustering are sensitive to noise in the data, because noise changes the similarity values and may thus easily modify the order in which objects cluster.
2.1.1.2. Complete Linkage
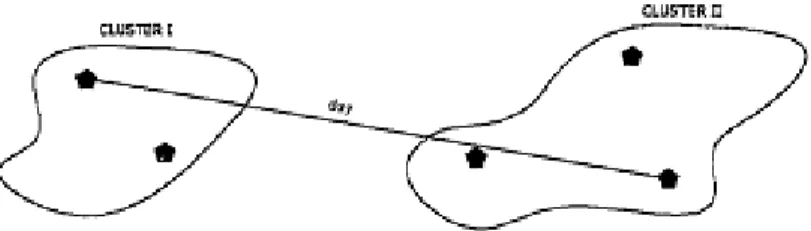
A variation on the simple linkage method is often known as complete linkage or furthest neighbour or maximum method. The distance between two clusters is defined as the greatest distance between objects in them. In complete linkage clustering methods, an object joins a cluster only when it is linked to all the objects already members of that cluster. Two clusters can fuse only when all objects of the first are linked to all objects of the second, and vice versa. Therefore in the complete linkage strategy, it becomes more and more difficult for new objects to join to it because the new objects should bear links with all the objects already in the cluster before being incorporated (Gong & Richman, 1995). In the agglomerative complete linkage method, the most similar clusters are combined; on the other hand in the divisive methods the most dissimilar clusters are splited. The equation of distance between clusters is,
D (CI,CII) = max XI Є CI, XII Є CII d(XI,XII) (2.7)
The measure of inter clusters is illustrated in following figure.
Figure 2.2 : Complete linkage distance Source : Mulvey & Gingold, 2009
If we compare complete linkage with the single linkage, the former is opposite approach of the latter in the sense that the distance definition. The complete linkage clustering model has one drawback when compared to single linkage. In all cases where two incompatible candidates present themselves at the same time to be included in a cluster, algorithms use a pre established arbitrary rule to choose one and exclude the other. The recommendation of this problem is chosen the fusion leading to the largest cluster. If equality persists, the recommendation is chosen the fusion that most reduces the number of clusters or as a last criterion, choose the fusion that maximizes the average similarity within the cluster. This problem does not exist in single linkage. Beside of these differences, the results depend very much on which two cases are taken as starting point in the process. Briefly, complete linkage tends to produce small, compact clusters in which the observations or cases are very similar to each other, while single linkage tends to produce long and stringy clusters (Gong & Richman, 1995).
2.1.1.3. Average Linkage
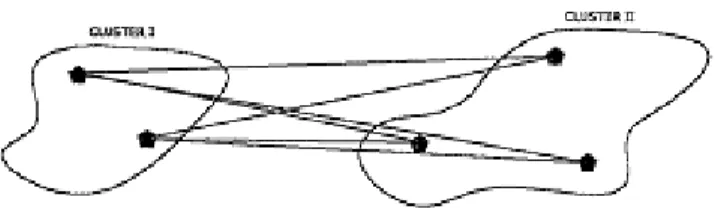
There are two kinds of average clustering that unweighted and weighted arithmetic average clustering. This technique treats the distance between two clusters as the average distance between all pairs of objects in the two different clusters. This method using arithmetic averages (Sneath & Sokal, 1973). The distance between cluster a, merged by cluster i and j, and another cluster b is determined by the following formula;
jb j i i ia j i i ab d N N N d N N N d + + + = (2.8) The measure of inter clusters is illustrated in following figure
Figure 2.3 : Average linkage distance Source : Mulvey & Gingold, 2009
The method computes an arithmetic average of the similarities or distances between candidates object all members of the two clusters. The highest similarity or smallest distance identifies the next cluster to be formed. All objects receive equal weights in the computation. The unweighted arithmetic average method assumes that the objects in each group form a representative sample of the corresponding larger groups of objects in the reference population under study. For that reason, unweighted arithmetic average clustering should only be used in connection with simple random or systematic sampling designs if the results are to be extrapolated to some larger reference population. On the other hand, weighted arithmetic average clustering occurs that groups of objects unweighted arithmetic average or representing different regions of a territory. Weighted arithmetic average, method consists in giving equal weights, when computing fusion similarities. Weighted arithmetic average clustering increase the separation of the two main clusters, compared to unweighted arithmetic average. This gives sharper contrast to the classification (Demirel, 2004).
2.1.1.4. Ward’s Method
All the linkage techniques such as single linkage, complete linkage and average linkage are based on similar principle, but the rules of produce cluster differ from one linkage technique to another. Ward’s method is another approach which is more complex than other linkage algorithms. The main objective of this method is to join cases into cluster
such that the variance within a cluster is minimized. Ward's minimum variance method is forming clusters, with minimizes an objective function which is the same "squared error" criterion as that used in multivariate analysis of variance. Distances are computed as squared Euclidean distances in Ward's method. To measure the distance between two objects i and j, the Euclidean distance function, dij is used (Gong &
Richman, 1995), which is determined by the following formula;
2 / 1 1 2 ) ( − =
∑
= p k jk ik ij x x d (2.9)At each clustering step, two objects or clusters h and i are merged into a new cluster hi, as in previous sections. Since changes occurred only in the groups h, i, and hi, the change in the overall sum of squared errors, ΔEhi, may be computed from the changes
that occurred in these groups only with the following formula;
2 2 2 2 i h hi hi e e e E = − − ∆ (2.10)
Ward's method tends to produce clusters with roughly the same number of observations and the solutions it provides tend to be heavily distorted by outliers. At each step in Ward’s method procedure, union of every possible pair of clusters is considered and the two clusters whose fusion results in the minimum increase in information loss in term of an error sum of squares criterion are combined (Everitt, 1993). Using squared Euclidean distance as dissimilarity measurement, together with Ward’s method for linkage, produced the most distinctive groups because it uses an analysis of variance approach to evaluate the distances between clusters. Ward’s method has been limited to
Euclidean metric space while getting the most accurate solutions and that the large majority of investigators applied this metric for their study (Güler, 2002).
2.1.2. Partitional (Non-Hierarchical) Cluster Analysis
Non-hierarchical algorithms, which are also referred as iterative methods, are based on partitioning a data set of observations into a pre specified number of clusters. Observations are then reassigned to clusters until some decision rule terminates the process. The decision rule is used for terminating clustering, and the frequency with which cluster centroids are updated during the reassignment process. The objects inside a cluster show a certain degree of closeness or similarity (Gerstengarbe & Werner, 1999).
Non-hierarchical methods have two potential advantages over hierarchical methods. The first advantage is non-hierarchical methods are less impacted by outlier elements. Although outliers can initially distort clusters, this is often corrected in subsequent passes as the observations switch cluster membership. Second, the final solution optimizes within cluster homogeneity and between cluster heterogeneity. Obtaining this improvement requires that the number of clusters be specified a priori (Hair, 2000).
Clustering methods can be considered as either hard or fuzzy depending on whether a pattern data belongs exclusively to a single cluster or to several clusters with different degrees. In hard clustering, a membership value of zero or one is assigned to each pattern data whereas in fuzzy clustering, a value between zero and one is assigned to each pattern by a membership function. Two types of non-hierarchical methods are generally used; K-means and Fuzzy C-means. Clustering algorithms such as K-Means as known hard clustering and C-Means, as known fuzzy clustering are based on the sum of intra cluster distances criterion. Additionally, the two stage clustering algorithm is
used when some specifications about the clustering procedures are absent and not available to priori descriptions of expected clusters (Kaya, 2005).
2.1.2.1. K-means
K-Means clustering is one of the most widely used market segmentation technique among the other clustering techniques to classify the data (Gehrt & Shim, 1998). The algorithms aim at finding a K-partition of the sample, with within cluster sum of squares which cannot be reduced by moving points from one cluster to the other. The method defines a fixed number of clusters and adjusts the cluster centers until further refinement can no longer improve the model. There are two versions of K-Means clustering, a non-adaptive version and an adaptive version. The most commonly used K-Means clustering is the adaptive K-means clustering based on the Euclidean distance (Everitt, 2001).
K-Means clustering algorithm search for the optimum center locations and it is assumed that the initial centers are provided. The search for the final clusters or centers starts from these initial centers (Mashor, 1998). The centers should be selected to minimize the total distance between the data and the centers. A simple and widely used square error cost function is used to measure the distance, which is defined as:
∑∑
= = − = nc j N i i j c x E 1 1 2 ) ( (2.11)where N, and nc are the number of data and the number of centers respectively; xi is the
data sample belonging to center cj. K-Means clustering tries to minimize function by searching for the center on line as the data are presented and with the Euclidean
distances between the data sample and all the centers are calculated and the nearest center is updated.
Even if K-means clustering perform when non-random starting point is specified, the procedure appears to be more forceful than any of the hierarchical methods with respect to the presence of outliers, error perturbations of the distance measures, and the choice of a distance metric. If we compare the K-means algorithm with hierarchical clustering, K-Means may be computationally faster than hierarchical clustering respect to with a large number of variables. Additionally, K-Means may produce tighter clusters than hierarchical clustering. However, difficulty in comparing quality of the clusters produced and difficult to predict what K should be are the main disadvantages of K-Means clustering.
2.1.2.2. Fuzzy C-means
Fuzzy C-Means is generally used in pattern recognition. The aim of Fuzzy C-means is to find cluster centers that minimize the dissimilarity function (Albayrak & Amasyalı, 2003). Fuzzy C-means clustering is separated from K-means clustering with the using of fuzzy partitioning method which means a data point can belong to all groups with different degrees (Berks et al., 2000). In general, fuzzy clustering methods can be considered to be superior to that can represent the relationship between the input pattern data and clusters more naturally.
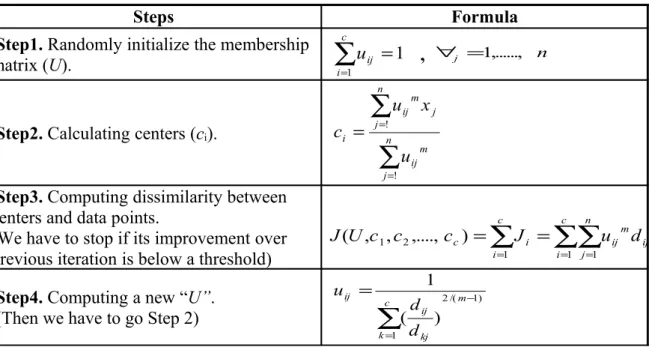
Fuzzy C-means algorithm determines the following steps (Jang, Sun, & Mizutani, 1997).
Steps Formula
Step1. Randomly initialize the membership
matrix (U).
∑
=1 =1c i ij
u , ∀j =1,..., n
Step2. Calculating centers (ci).
∑
∑
= = = n j m ij n j j m ij i u x u c ! !Step3. Computing dissimilarity between centers and data points.
(We have to stop if its improvement over
previous iteration is below a threshold)
∑
=∑∑
= == = c i c i n j ij m ij i c J u d c c c U J 1 1 1 2 2 1, ,...., ) , ( Step4. Computing a new “U”.
(Then we have to go Step 2)
) 1 /( 2 1 ) ( 1 − =
∑
= m c k kj ij ij d d uFigure 2.4 : Algorithm steps of fuzzy c-mean Source : Jang, Sun, & Mizutani, 1997
Because of cluster centers are initializing using U, Fuzzy C-means doesn’t always good solution. Therefore two approaches are proposed that using an algorithm to determine all of the centers or run algorithm several times each starting with different initial centers.
2.1.2.3. Two Stage Clustering
Although, partitioning methods require some more specifications comparing with hierarchical methods, studies of clustering algorithms suggest that iterative partitioning methods are preferable to the hierarchical methods. Partitioning methods can be performed only when a non random starting point can be specified or the number of clusters can be desired. Under the absence of this information, the user can choose two-stage clustering procedure, in order to determine specifications and demonstrated superior performance of cluster method. Research has shown that in this situation the
best solutions may be those obtained by using hierarchical and non-hierarchical methods with two-stage clustering. Additionally, the two-step cluster is appropriate for large datasets or datasets that have a mixture of continuous and categorical variables (Huang, 1998).
Empirical studies of the clustering algorithm performance suggest that the integration of hierarchical and non-hierarchical methods can provide a better solution than hierarchical methods. In addition, iterative partitioning methods require prior specification of the number of clusters desired, while hierarchical methods do not need such specification. Thus, the researcher is confronted with determining both an initial starting point and the number of clusters in order to use the non-hierarchical methods. Therefore, first, the hierarchical methods, such as Ward's minimum variance method, can be applied to obtain a rough solution. The main reason for such integration is that Ward's minimum variance method can provide the number of clusters and also provide the starting point which the K-means method requires. Thus the number of clusters need not be assumed by the researcher and starting point is not randomly selected. Then the non-hierarchical methods, like the K-means method, can use the information to obtain the final clustering results (Kuo, Ho, & Hu, 2002).
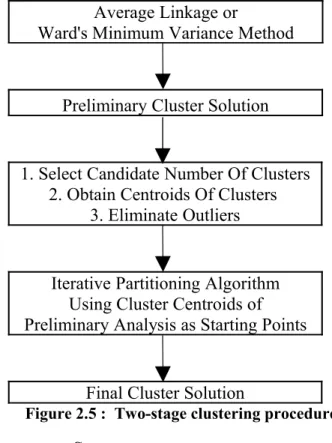
In the first step one of the hierarchical methods such as average linkage or Ward's minimum variance method, may be used to obtain a first approximation of a solution. By examining the results of this preliminary analysis, one can determine both a candidate number of clusters and a starting point for the iterative partitioning analysis. Additionally, this analysis can be used for examining the order of clustering of various observations and the distances between individual observations and clusters to provide an opportunity for the identification of outliers. The remaining cases may then be submitted to an iterative partitioning analysis for refinement of the clusters (Hair, 2000). Two step clustering has the advantage of automatically estimating the optimal number of clusters for the training data and it can handle mixed field types and large
data sets efficiently. The Figure 2.4 is a schematic representation of the procedure by Punj and Stewart in 1983.
Average Linkage or
Ward's Minimum Variance Method
Preliminary Cluster Solution
1. Select Candidate Number Of Clusters 2. Obtain Centroids Of Clusters
3. Eliminate Outliers
Iterative Partitioning Algorithm Using Cluster Centroids of Preliminary Analysis as Starting Points
Final Cluster Solution
Figure 2.5 : Two-stage clustering procedure Source : Punj & Stewart, 1983
2.1.3. Self Organizing Map (Kohonen Network)
Although the first model in artificial neural networks dated from the 1940s, which was explored by Hebb, it started been more used in the 1980’s (Mingoti & Lima, 2006). The bases artificial neural network consists of a set of simple processing units, neurons that are connected to each other to form a network topology. In clustering problems, the artificial neural networks cluster observations in two main stages. The first step is learning stage which is used to train the network for a specific data set. The second step is observations are classified, which is called a recall stage. There are two ways to train a network, supervised and unsupervised. In supervised learning the network is presented with examples of known input-output data pairs and the network is then tested to see whether it is able to produce correct output, when only input is presented
to it. In unsupervised learning, the output data is not available and usually not even known beforehand. Similar samples form clusters that constitute the output of the network. The user is responsible for giving an interpretation to each cluster (Back, Sere, & Vanharanta, 1998).
In another word the artificial neural networks are working into layers. Basically, the input layer contains the nodes through which data are input. The output layer generated the output interpreted by the user. Between these two layers there can be more layers called hidden layers (Mingoti & Lima, 2006). The output of each layer is an input of the next layer until the signal reaches the output layers as shown in following figure.
Figure 2.6 : Neural network for clustering Source : Mingoti & Lima, 2006
Self organizing map, which proposed by Kohonen, is one of the most common neural network model. It was originally designed for solving problems that involve tasks such as clustering, visualization, abstraction and the theory is motivated by the observation of the operation of the brain. Various human sensory impressions are neurologically mapped into the brain such that spatial or other relations among stimuli correspond to spatial relations among the neurons organized into a two-dimensional map (Kohonen,
1989). SOM belong to a general class of neural network methods, which are non linear regression techniques that can be applied to find relationship between inputs and outputs or to organise data so as to disclose previously unknown patterns or structure. Kohonen’s Self organizing map approach has been successfully applied because of its good performance as a classification tool to various problem domains including speech recognition, image or character recognition, robot control, medical diagnosis and market segmentation (Kiang, Hu, & Fisher, 2006).
SOM network is a special type of neural network that can learn from complex, multi-dimensional data and transform them into visually decipherable clusters. In another word SOM is a dimensionality reduction visualization technique such as one or two-dimensional map, to generate compact but distorted map visualizations for an expertise data set. Dimensional map provides an easy to use graphical user interface to help the decision maker visualize the similarities between consumer preferences. These dimensional maps not only help the companies to see fully visualized clusters of market but also reveal mutual non-linear correlations between different customers’ characteristic variables. Briefly, the main function of SOM networks are discovering of structure in large high-dimensional data sets and mapping the input data from an n-dimensional space to a one or two-n-dimensional plot while maintaining the original topological relations (Kiang & Fisher, 2007).
Self Organizing Maps have some advantages which make them appropriate in much area of studies. The first advantage is they are able to outperform the traditional data reduction and clustering techniques, in both speed and quality of solution (Smith, 1999). Second, they have the capacity to operate on very large samples and need no a priori assumptions about the distribution of the sample. The other advantage is using SOM helps overcome structuring task problems associated with finding the appropriate underlying distribution and the functional form of the underlying data. The fourth advantage is ability of SOM is to reduce the input space to a one or two dimensional output map and also projecting them non-linearly in a two-dimensional map while
maintaining the original topological relations (Vesanto, 1999). Furthermore, it detects clusters existing in the original data while avoiding creating artificial ones, thus providing a true representation of the original data’s characteristics. Another advantage of Self Organizing Map is that the user can determine the number of clusters needed by examining the merge process visually on the map. Self Organizing Maps are useful in visually examining the relationship between input data and identifying important patterns and clusters.
SOM belongs to unsupervised neural networks and the basic idea behind them is competitive learning that, clusters objects having multi-dimension attributes into a lower-dimension space, in which the distance between every pair of objects captures the multi-attribute similarity between them. Although more common approach to neural networks required supervised training of the network, the SOM network performs unsupervised training which provides a visual representation of the relationships that exist in the original data, while avoiding creating artificial clusters (Deichmann, 2003). The SOM network model consists of two layers, an input layer and an output layer (Kohonen layer). An input layer represents the object features and output layer in the shape of a two-dimensional grid that determines the positions of the objects. In another word, the input layer neurons present an input pattern to each of the output neurons and it is fully connected to a two-dimensional Kohonen layer. The neurons in the output layer are usually arranged in a grid, and are influenced by their neighbours in this grid. The output layer acts as a distribution layer to summarize general feature patterns in the collection of objects and the output from SOM networks is a dimensional map (Kiang & Fisher, 2007).
Kohonen network is trained using unsupervised learning. During the training process the network has no knowledge of the desired outputs and it’s accomplished by iterative application. The training process is characterized by a competition between the output neurons. The input patterns are presented to the network one by one in the input space with a random order. As the training process proceeds, the nodes adjust their weight
values according to the topological relations in the input data. Each node on the map may represent zero to many input data. The nodes that are closely located on the representational grid should have similar cluster center. Each node in the input layer corresponds to one of the features of an object and in the mapping layer is connected to all input layer nodes with certain link weights (Kiang & Fisher, 2007). Thus, a mapping layer node can be also viewed as a feature vector with link weights as the feature values and each node on the output map as one group and cluster the input data accordingly. The SOM exhibits the important property of topology preservation. In other words, if two input vectors are close in the input space, the corresponding closest neurons will also be close in the neural network. The network topology can be described by the number of output neurons present in the network and by describing which neurons in the output array are mutual neighbours (Huang et al., 2006)
Neurons on the output layer are arranged in either a rectangular or a hexagonal grid as the following figure.
Figure 2.7 : Network topologies Source : Back, Sere, & Vanaranta, 1998
In a rectangular grid each neuron is connected to four neighbours, except for the ones at the edge of the grid. The output neurons are arranged in a hexagonal lattice structure which means that every neuron is connected to exactly six neighbours, except for the ones at the edge of the grid. The basic SOM consists of a set of neurons that there are neighbourhood relations among them. The neighbourhood structure of the output layer
will cause neighbouring neurons in the output layer to have similar weight vectors. Each neuron has an associated weight vector of the same dimension as the input space. The output neurons compete for each and every pattern. The output neuron with a weight vector that is closest to the input vector is called the winner. In another word the node with the minimum distance becomes the “winning” node and the link weights between output layer node and the input nodes are updated according to its distance to this “winning” node. For expressing the distance between two vectors, we use the Euclidean distance between the two vectors (Back, Sere, & Vanaranta, 1998).
The weight vector of the winner adjusts its weights to be closer to the value of the input pattern. The size of adjustment in the weight vectors of the neighbouring neurons is dependent on the distance of that neuron from the winner in the output array. There are widely used three adjustment criteria. The first is learning rate which influences the size of the weight vector adjustments after each training step, whereas the neighbourhood width parameter determines to what extent the surrounding neurons, the neighbours, are affected by the winner. The second criterion is training length, which measures the number of iterations through the training data. Another criterion is the average quantization error, which is an average of the Euclidean distances of each input vector and its best matching reference vector in the SOM. When the adjustment proceeds the clusters are formed by identifying neurons on the output layer that are close to each other using the weight vectors as a starting point which defined as a U-matrix (Kohonen, 1997). The matrix can be used to visualize the distances between neighbouring neurons. Thus, a set of neurons form a cluster, if they are sufficiently close to each other.
Before examining the steps of self organizing map, we should focus on the methodology which has important principles. The first is choosing the data material which is often advisable to pre process the input data so that the learning task of the network becomes easier (Kohonen, 1997). Then choose the network topology, learning rate, and the neighbourhood width. The third principle is constructing the network
which takes place by showing the input data to the network iteratively using the same input vector many times. Final principle is choosing the best map for further analysis; identify the clusters and interpreting the clusters. The process of self organizing map has following 4 steps;
(1) Initialize the weights as random small numbers.
(2) Put an input sample, Xi, into the SOM network, and the distances between weight
vectors, Wj = (wj1, wj2, . . . ,wjm), and the input sample, Xi, are calculated. Then, select
the neuron whose distance with Xi is the shortest, as in equation (2.16). The selected
neuron would be called the “winner”
∑
− = i i ji x w j d( ) ( )2 min (2.12)(3) Update the weights of the winner as well as its neighbours by the following equation when α is assumed to be the learning rate
j i j NEW j W X W W = +α − (2.13)
(4) Iterate Steps (2) and (3) until the weights have stabilized and stop criterion is satisfied
If we compare cluster analysis with the self organizing map method, cluster analysis is a technique for grouping subjects into clusters of similar elements and tries to identify similar elements by their attributes. The technique is forming clusters that are
homogeneous but are different from other groups. On the other hand self organizing map networks combine competitive learning with dimensionality reduction by smoothing the clusters with respect to an a priori grid and provide a powerful tool for data visualization (Kiang & Fisher, 2007).
Self organizing maps have an important limitation which has no mechanism to determine the number of clusters, initial weights and stopping conditions where as the other neural network based algorithms hasn’t. If we compare the number of clusters between cluster analysis and self organizing map, in clustering algorithm the number of clusters should be chosen according to the number of clusters there are in the data, but in the self organizing map algorithm the number of neurons and related weight vectors can be chosen to be much larger, irrespective of the number of clusters. Another difference is a self organizing map is more sophisticated than clustering methods in terms of presentation the relationship between the clusters in a two-dimensional space (Urso & Giovanni, 2007).
2.2. MARKET SEGMENTATION
In 20th century the concept of market segmentation entered in the literature and after this time it becomes nearly impossible to see the situation where mass marketing approach is feasible (Wedel & Kamakura, 2000). The reason, which has obviously long been accepted, is that consumer’s shows differentiation between each other among their individual choices. Here appears a new terms heterogeneity which could be a core point of the segmentation (Hunt & Arnett, 2004). Customers are heterogeneous, which means that their purchasing behaviour over time varies, their willingness to pay varies from customer to customer, and they are attracted by different benefits offered by the same type of products. Market segmentation involves the identification of segmentation variables followed by segmentation of the market. Segmentation is a grouping task for, which a large variety of methods are available, leads to market targeting and evaluation
of the attractiveness of the obtained segments and a selection of the target segments. For achieving target segments, positioning concepts are developed, selected and communicated. The segments are distinguishing from each other because of some factors like product, distribution, pricing, and communication strategy (Wedel & Kamakura, 2000).
The concept of market segmentation arises from viewing a heterogeneous market composed of a couple of smaller homogeneous markets. Market segmentation desires that groups of customers with similar needs and purchasing patterns are likely to demonstrate that specific customer groups (Tsai & Chiu, 2004). As our world getting industrialised, the importance of the market segmentation is dramatically increasing because unless considering customer needs and recognising the heterogeneity of those needs, goods and services can no longer be produced and sold. In other words able to balance diverse customer needs with the capabilities and resources of competing organizations in the marketplace getting the core point of the company's market strategies. Most markets the breadth of customer requirements is too extreme to allow single organizations to satisfy all customer products and service needs all of the time. Therefore, in order to satisfy various customer requirements within company’s capacity, companies need to split consumer market into several segmentations and find out appropriate marketing strategies for them. As a result companies achieve a full understanding of a market; the ability to predict behaviour accurately; and an increased likelihood of detecting and exploiting new market opportunities (Kotler, 1997).
Segmentation is enable understanding market through collecting and then analysing several variables using sophisticated multivariate techniques. The companies use these techniques to divide subgroups because they would like to reach this segment by developing different offerings with aiming increasing their profit. Companies could be successful if segmentation allows them to determine which actions would attract or retain customers, or decide which additional products or services they could introduce profitably. With proper market segmentation, companies can deploy the right resource
to target customer groups and cultivate the closer relationships with their customers more efficiently and effectively (Huang, Tzeng, & Ong, 2007). Based on this proper market segmentation perspective, companies need to understand their customers, differentiate between various customer groups and identify the most or the least valuable customers and increase customer loyalty through providing customized products and services. In another word segmentation must help identify different response groups which have uniform and stable responses to a particular set of marketing variables by analyzing customer information and the result of this marketers aim to change, reinforce or initiate behaviour patterns (Ha, 2007).
2.2.1. Bases for Segmentation
In the marketing strategy there are three phases; in sequence segmenting the market, selecting one or more segments to target and positioning the product or service. Market segmentation, which is the first phase of marketing strategy, can be defined as the process of dividing a market into distinct subsets of consumers with common needs or characteristics and selecting one or more segments to target. Segmentation studies have two major components: the information used as input, called the ‘bases’ of segmentation, and the methods used to identify segments/subpopulations based on the input data (Wedel & Kamakura, 2000). The first step in developing a segmentation strategy is to select the most appropriate bases on which to segment the market. Four major categories of consumer characteristics provide the most popular bases for market segmentation; which are geographical, demographical, socio cultural and psychological-psychographic. In general, demographical and geographical segmentation help to locate a target market, whereas psychological and socio cultural characteristics help to describe how its members think and how they feel. Therefore in some situation, marketers can segment the markets by combining several bases rather than relying on a single segmentation base (Schiffman & Kanuk, 2000).
In geographic segmentation, the market is divided by location using with region, city size, climate or density of area variables. The theory behind this strategy is that people who live in the same are share some similar needs and wants and these needs and wants differ from those of people living in other areas. Geographic segmentation is a useful strategy that can be easily reached through the local media, including newspapers, TV and radio, regional editions of magazines. Demographic segmentation is most wide used as the basis for segmentation research. Demography explains the main characteristics of a population with using the measurable statistics such as age, sex, marital status, income, occupation and education variables. Demographic segmentation is often the most accessible and cost effective way to segmentation. Additionally demographical variables are easier to measure than the other segmentation variables (Baker & Hart, 2008).
Socio cultural variables provide further bases for market segmentation. This approach divides the segments on the basis of the stage in the family life cycle, social class, core cultural values, sub cultural membership and cross-cultural affiliation. Family life cycle based on the premise that many families pass through similar phases in their formation, growth and dissolution. Social class is measured by a weighted index of several demographic variables in which individuals in the same class generally have the same degree of status Consumer segmentation strategies are often based on specific psychological variables such as motivations, personality, perceptions, learning and attitudes. On the other hand, psychographic segmentation can be thought of as a composite of consumers’ measured activities, interests and opinions with the larger number of statements (Schiffman & Kanuk, 2000).
2.2.2. Criteria for segmentation
Segmentation is a very critical process that companies have to give attention to it therefore Morrison (1996) listed eight criteria for effective segmentation to help companies. According to these effective markets segmentation has the following characteristics (Morrison, 1996).
The first criterion is achieving homogeneity inside of the group which defined as segmentability. People within a segment should be similar to each other but at the same time they should be as different from each other as possible. In another word, segments should satisfy homogeneity within and heterogeneity between them. This is the base on the segmentation (Kotler, 1997). Second criterion is segments should be measurable in other words segments should be identified with a reasonable degree of accuracy. This criterion is used mostly in demographic and geographic segmentation which use commonly age, sex, income, education, occupation, gender, region, city size, density of area, climate variables (Raaij & Verhallen, 1994). The next criterion is segments should be substantial, it means that segments should be large enough in size to warrant separate attention. It is important because as large is the segment as better as the segmentation. If the targeted segments represent a large enough portion of the market the substantiality criterion is satisfied which is closely connected to the firms’ goals and costs. Another criterion is segments should be accessible; if an organization needs to be able to easily reach or access the identified segments. That means for example that there are target group specifically advertising media, as magazines or websites the target audience likes to use because they usually have to contact with their segment to ale to accessible (Baker & Hart, 2008).
Another important criterion is each segment must need different marketing approaches (Dibb, 1998). This suggests that the segments must differ on those characteristics which will be most relevant to the organization’s services or products. Addition to this until
competitors copy or segment your segmentation, you have a competitive edge, even if you serve the segment with a standard product or service. The next criterion segments must have meaningful relation with o the products or services offered by the organization. Another criterion is identified segments need to be compatible with existing markets. The last criterion is there must be some stability in the segments. The identified segments must be durable, in another words need to remain relevant over an extended period of time (Morrison, 1996).
2.2.3. Market Segmentation Approaches
The segmentation approach can be divided into two groups. The first subgroup consists of priori and posteriori approaches. The other subgroup consists of forward, backward and simultaneous approaches. In priori approach the segments are chosen before the data are analyzed according to pre-existing demographic criteria such as age, sex, working status, education level, social economic status. A priori segmentations are easy to define and also the simplest segmentation to apply and use. The posteriori approach is one where the segments are determined by the data rather than by the researcher. The aim of these studies is not only to understand commonalities in opinion, but also what makes one group of users different from another. To understand how attitudes affect purchase statistical techniques are used where people with similar attitudes are combined together and so this approach is usually associated with cluster analysis (Mazanec, 1999).
If we examine the second subgroup we consider that, there are three approaches that mentioned in the segmentation literature are forward, backward and simultaneous. In the forward approach or the analysis of consumer response, consumers are divided into group according to the similarity in their behavioural response to the supply of goods and services. Here, consumers are assigned to groups by their similarity in one or more consumer characteristics. Additionally, the differences between the groups are related
to behavioural differences for specific consumer characteristics. A forward segmentation approach includes grouping consumer characteristics based on their similarity in demographics, personality, attitude and benefits sought followed by discriminating groups by consumer response for a specific chosen product or service (Kuylen & Verhallen, 1981).
The second approach which is backward segmentation approach, the analysis start point is the consumer characteristics. The segment group is formed by their similarity in one or more consumer characteristics. Consumer characteristics are distinguished as general characteristics and situation-specific consumer characteristics. General characteristics consist of sex, age, stage in life-cycle, lifestyle or personality. On the other hand consumer characteristics consist of attitudes, opinions, perceptions and preferences. The differences between the groups are related to behavioural differences. Backward segmentation approach involves grouping consumer response based on their similarity in choice of products and services followed by discriminating groups by consumer characteristics (Raaij & Verhallen, 1994).
The third approach is the simultaneous segmentation that analysis of consumer characteristics and responses and consumers are assigned to groups on the basis of the relationship between consumer characteristics and behavioural responses to the supply of goods and services. Several researchers in marketing and consumer behaviour have emphasized that consumers may belong to multiple segments rather than one and only one segment. Large number of respondents fell into more than one segment and revealed both overlapping and unique (mutually exclusive) product-benefit segments. Therefore, as an alternative method simultaneous approach was developed on lodging market segmentation to analyzed both consumer response and behavioural responses simultaneously (Mazanec, 1999).