New high-resolution display device for
holographic three-dimensional video:
principles and simulations
Levent Onural, MEMBER SPIE Gözde Bozdau, MEMBER SPIE Abdullah Atalar
Bilkent University
Department of Electrical and Electronics Engineering
TR-06533 Bilkent, Ankara, Turkey E-mail: [email protected]
1 Introduction
Displaying3-D information is getting more and more
im-portant in many fields such as computer-aided design, sci-entific visualization, medical imaging, and navigation. Two well-known techniques for 3-D display are stereoscopy and holography. Stereoscopy is based on the psychological nature ofperception. Although the underlying principles are not well understood, it has been known for more than a century that the perception of the 3-D environment is partially due to the difference in the views seen by the right and the left eyes. Therefore, any recording system that records a scene from two suitable angles and includes a means to transfer each image to the corresponding eye, will generate a 3-D percep-tion. A major drawback of stereoscopy is the lack of proper parallax. So, it does not give a true 3-D display. On the other hand, holography is based on the physics of optical waves. The information-carrying optical waves that come from the 3-D environment are somehow duplicated in the absence of the original source. Therefore, holography is a true 3-D method.
Some 3-D holographic television systems, including both the camera and the display ends, are reported in the literature but the display problems related to 3-D moving imagery seem to be the major obstacle for commercial development.'8 For example, in a reported system, the receiver gets the video signal, which represents the hologram, and forms the holo-gram on a cathode ray tube. This holoholo-gram is then imaged onto an optical-to-optical transducer called a liquid crystal light valve, and a coherent source forms the 3-D field re-Paper 07013 received Jan. 9, 1993; revised manuscript received June 14, 1993; accepted for publication June 14, 1993.
1994 Society of Photo-Optical Instrumentation Engineers. 009 l-3286/94/$6.00.
Abstract. A new acousto-optical holographic display device, which is ex-pected to solve the display resolution and refresh problems that are com-mon to available holographic displays, is proposed. The device is based on the reproduction of a hologram as a surface pattern using traveling surface acoustic waves (SAWs). There is an array of electrodes attached
to the SAW device. An electrical signal applied to any one of these
electrodes generates an acoustical wave propagating on the surface of the crystal. If signals are applied to all of the electrodes simultaneously, propagating waves from the electrodes superpose to form a time-varying SAW pattern on the crystal. This pattern forms the hologram at a specific
time. The signals that should be applied to the electrodes are found through a mathematical inversion relation that is derived from the
un-derlying physics. The inversion relation is checked by computer
simu-lations. Simulations also show that the image quality of the proposed
3-D TV display is satisfactory.
Subject terms: holography; electroholography; acousto-optics; multidimensional signal processing; three-dimensional television.
Optical Engineering 33(3), 835—844 (March 1994).
constructionfrom the hologram.' In this system, the reso-lution at the display end is limited to resoreso-lution of the optical-to-optical transducer. Other examples of holographic tele-vision systems using liquid crystal light valves are given in Refs. 2 and 3. Although now optical-to-optical transducers are also beginning to be produced in a resolution range suit-able for holographic display,9 the trade-off between the res-olution and refresh rate still remains a problem. In another system, a photoconductor-thermoplastic transducer is used to duplicate the transmitted hologram.4'5 The problem with this system is the refresh rate difficulty associated with the erase and rewrite processes. Acousto-optic modulators are also used for display purposes in holographic systems.6'7 In these systems, the coherent light is modulated by the acousto-optic modulator and acousto-optically processed to produce a 3-D image with only horizontal parallax. Elimination of the ver-tical parallax reduces the display resolution requirements.
In this paper, we propose a new display device that is expected to solve the display resolution problem. In addition, the refresh rate of this device will be more than enough for
3-D moving imagery. The technique is the reproduction of the desired pattern, in our case the hologram, using surface acoustic waves (SAWs) that are generated by an array of electrodes. Therefore, the generated pattern at any point of the display device is affected at all times by all sources.
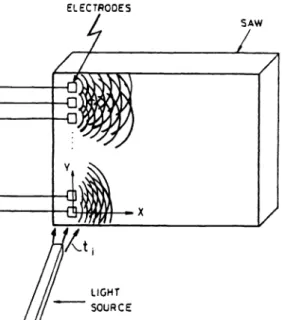
Figure 1 shows the basic display system. The SAW device that is used as the medium of display has an array of a few hundred electrodes attached to it. Generated waves from the electrodes will superpose to form a time-varying surface field pattern on the crystal. The time-varying electrode signals are designed in such a way that at a given instant t1, the time-varying field over the SAW device is exactly the hologram pattern we wish to have. At the instant t,,acoherent light OPTICALENGINEERING I March 1994 I Vol. 33 No. 3 I 835
836 / OPTICAL ENGINEERING / March 1994 / Vol. 33 No. 3
ONURAL, BOZDAGI, and ATALAR
_j2.t 2
\V2k— (___u2)
\UsAw/
SAW LIGHT SOURCEseparated by an infinitesimal distance. First, we assume that the variation along the y axis is continuous, so the applied signal is given by a 2-D function f(t,y). After finding the result for the continuous case, it can be easily discretized. For the sake of mathematical simplicity, we assume that the y axis extends from —oc to +oc
Letthe time-varying field on the crystal surface be Ji(x,y). Therefore, i1(x,y) is the field variation at instant t1.Wewant to find the electrode signalsf(t,y) from UJs(x,y).
The derivation of the relationship between the electrode signals and the surface pattern can be accomplished rather easily through the following steps, starting from a simple plane wave. Consider a propagating sinusoidal plane wave that can be written as exp{j(ot —kTX)J,where k is the wave number vector (k,k)T, xisthe position vector (x,y)T, and T is the transpose operator. The propagation is in the same direction as the vector (kho, k,/w)T. The phase velocity of the SAW is
SAW(k2+k2)1/2 . (1)
Now, let the wave be multiplied by the linear phase com-ponent exp(juy) at the crystal edge, where u is just the spatial frequency variable in the y direction. For a wide range of u, the plane wave continues its propagation after the edge, over the crystal surface, but is refracted at an angle by the linear phase component. Therefore, if the signal
f(t,y) =exp[j(wt+ uy)]
is applied to the electrodes, then there will be a time-varying field over the crystal surface as
t(X,Y) =exp{j(wt—
kx
+ uy)JWe know the wave number in the y direction from the ex-citation as k =— u.So, by using Eq. (1) we can find k as
(2) If fU>IWj/VSAW, the wave will not propagate over the crystal
surface.
At the specific instant of time t,wehave
i(x,y) =
exp[j(ot1—kx
+
uy)J . (3)Now, consider an arbitrary surface pattern 4i(x,y) at t= t,.
We want to find f(t,y), which will yield this pattern. This requires a 2-D transformation. Considering the (x,y) domain as the input domain and the (t,y) domain as the output domain, we want to transform the surface field 4i(x,y) to the electrical signals applied to the electrodes f(t,y). Using the angular spectrum approach, we can easily decompose the arbitrary field pattern 4i,(x,y) into its plane wave components by the 2-D inverse Fourier transform as
(x,y) =
x exp[j(x
+
,y)]
df d, .
(4) Fig. 1 SAW device that is used as the medium of display. Thetray-eling SAWs, which form the desired pattern at t= t,, are generated by a number of electrodes attached on a side of the crystal.
pulse from a laser is shined onto the crystal to reconstruct momentarily the associated 3-D scene. The electrode signals can be found from the hologram using an inversion relation. This inversion relation is derived from the underlying physics and is rather independent of the desired surface wave pattern. Because the wave pattern on the crystal surface does not remain still, the hologram will be available only for a very short time and then it will disappear. Before the application of the electrode signals for the next frame, the SAW pattern will die out by itself. The quality of the 3-D frame, with a few hundred electrodes, is expected to be comparable to con-ventional TV picture quality. The fundamental contribution ofthis paper is the derived mathematical relationship between the desired surface pattern at a given instant and the cone-sponding electrode signals to obtain that pattern. It is also shown that the mentioned electrode signals can be efficiently provided using digital algorithms, once the desired pattern is known. The complete computational algorithm is also pre-sented. Both the mathematical results and their digital im-plementations are checked by computer simulations by gen-erating visual outputs.
In Sec. 2, we explain the inversion relationship, which is the main result of this paper. Section 3 gives the discrete implementation of the inversion relationship that is the basis of the presented simulations, together with the implemen-tation of the hologram recording, reconstruction, and wave propagation processes. Section 4 gives the simulation results. Finally, the proposed 3-D TV system is presented.
2
Inversion RelationshipSupposethat our surface is denoted as the (x,y) plane. We locate electrodes on the y axis. Let a continuous time signal applied to an electrode located aty =Ymbe denoted byfD(t,m).
The analysis can be carried out both for the discrete case, which corresponds to the actual operation with an array of electrodes mounted onto the crystal at discrete points, or for the continuous case by assuming infinitely many electrodes
Here Iti(X'1y)
represents the complex amplitude of the individual plane wave components, and it can be found from the Fourier transform asti(X'y)
= Jft1(XY)
exp[ —j(x +
,y)1
th dy.
(5) Note that fl =— kand = — k
=
u.We have shown pre-viously that to get the plane wave surface field pattern 4i1(x,y) =exp[j(wt1+
1x
+
1y)],
we have to apply f(t,y) =exp[j(ot+ 1y)] to the electrodes. Hence, to get exp[j(flx
+ f1y)J we must apply exp[j(wt +
Iy
—cot,)] to the elec-trodes. Finally, it can be argued that
f(t,y) ='I'(I(flX'f))exp{j[co(t —t,) +
willproduce the plane wave pattern
=
'I',(f1,Y)
exp[j(f1x +where
''t(1x'1y)
isa constant for fixed f and fTl. Therefore, the arbitrary surface field pattern ]i(x,y) of Eq. (4) will be generated by the electrode voltage patternf(t,y) =
ff"t.(flxA)
x exp{j{co(t —t.) +
Iy]} dfl df,
From Eq. (1) we know thatcol =sAwk +
k2)V2 Hence,or, equivalently,
-H
w=
USAW(flX+fI)The sign term in the preceding expression results from the fact that the wave propagates away from the excitation elec-trodes, i.e., always in the positive x direction.
By substituting Eq. (8) in Eq. (6), we get wave pattern
f(t,y) =
f
:i tj(X'y)
exp{i[
-
SAWx
(fl
+
fl(t — t1) + y] }
d,
1r±cI.± r_ / 2
\V2 =___iI I 41TJJ 'L co
\-'sAw J
co exp{j[w(t —t,) + f,yJ} X 2dfldw.
ii 2i2 \ fl2i/2 Y k)SAWRWlU5AW)If we representf(t,y) in terms of its sinusoidal components by using the Fourier transform, we get
f(tY)=JJF(wu) exp[j(cot+uy)I du dw. (10)
As a result, if we compare Eq. (9) and Eq. (10), we get
F (w,u), =
co SAW
sAW(co/sAW) —n1 ½ exp(—jwt1)
x
(11) Therefore, we can always find the unique input signal f(t,y) to get the specified surface field pattern 4i,(x,y) at time ti, and the relationship between the Fourier transforms of these two signals is as given. Even for finite area surface signal ii,(x,y), the corresponding time signal may not be lim-ited in tandy, but may still be concentrated over a section of the (t,y) plane.
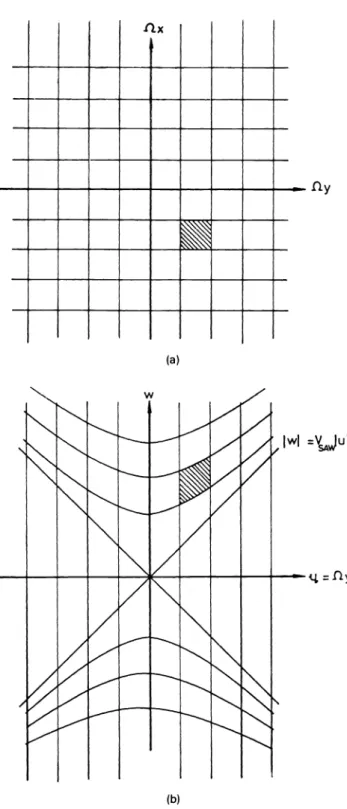
The result as presented by Eq. (1 1) shows how the two Fourier transforms are related. In addition to the amplitude change, one of the coordinates also goes through a transfor-mation. This coordinate transformation will affect the borders of the passband in case of a bandpass signal. The relationship (6) caneasily be found analytically or graphically. Figure 2 de-picts an example: ti(x,y) is a bandpass signal with a rectan-gular passband [Fig. 2(a)], and the corresponding passband of f(t,y) is shown in Fig. 2(b). After the coordinate trans-formation, we see that the band is no longer rectangular.
3
Digital SimulationInthis section, we show simulations of the holography re-cording and reconstruction processes, the inversion relation-(7) shipto find the time signals from the holographic pattern, and propagation of the waves to get the holographic pattern back, in three steps.
A purpose of these simulations is to visually demonstrate the validity of the inversion relation given by Eq. (1 1). This (8) relation,whose complete derivation is presented in Sec. 2,
is the primary contribution of this paper. The approach for this end is to compute the electrode signals corresponding to a given surface pattern using the relation given by Eq. (1 1), and then to generate a surface pattern (field) that propagates from the electrodes excited by these computed signals, by a simulation based on simple propagation principles. If Eq. (1 1) gives the correct electrode signals, then the pattern ob-tamed over the surface as a consequence of these electrode signals must be identical to the original desired pattern: one process is the inverse of the other. In this work, the above-mentioned process is simulated completely in a digital en-vironment. First, the electrode signals are computed from a given discrete surface pattern. Second, the process of getting a surface pattern from given electrode signals is also simu-lated digitally using the propagation principles. The second process is very well known, whereas the first inversion pro-cess is a contribution of this paper. Therefore, generating a (9) replicaof the original pattern visually demonstrates that the inversion relation is correct. Because a complete digital
en-OPTICALENGINEERING I March 1994 I Vol. 33 No. 3 I 837 co =f'sAw(1k+ k2)'/2
L
'SAW(kr'v)
if 10
838 I OPTICAL ENGINEERING 1 March 1 994 I Vol. 33 No. 3
ONURAL, BOZDAGI, and ATALAR
to implementthe digital version of the continuous relation-ship presented by Eq. (1 1) are given in Sec. 3.3. Using the digital algorithm presented in Sec. 3.3, one can start with a given discrete pattern t,D(,) which is the discrete version of the surface wave field pattern at a given instant, and find the discrete electrode signalsf(a,b). The well-known prop-agation process is given in Sec. 3.2. The presented relation is also computed in a digital environment for discrete loca-tions over the surface.
Another purpose of the simulations is to generate visual
fly
samples of the holographic 3-D TV operation. The 3-D TV operation is explained in Sec. 5. In this case, the display device, whose principles are explained in Sec. 2, generates surface patterns that are holograms. The electrode signals are obtained digitally, as explained in Sec. 3.3, using the holo-gram pattern as the desired pattern over the surface. These electrode signals propagate over the surface to create the— desiredhologram at the specified instant. Optical illumination
of this hologram will yield a 3-D frame. To obtain a sample of the resultant frame by simulation, two more simulation steps must be added to the steps described in the previous paragraph: given a pattern in space, its hologram, which will be used as an input to find the electrode signals, must be computed digitally; and given the regenerated hologram over the crystal surface through propagation, the hologram
re-Iwl =V 4)uI$4 constructionprocess must be simulated digitally to compute theviewed 3-D frame. These two additional steps are also digital simulations of actually continuous processes, there-fore, the effects of the discretization process and the digital algorithms should be carefully investigated. This is done in Sec. 3. 1 .However,because of the analytical and computa-tional difficulties of finding the hologram of a truly 3-D ob-ject, 2-D objects that are located in 3-D space are used both
1.1 forthe analysis and computations. This is a common practice
44
= y
in analytical description ofholography (see, for example, Ref. 10,p. 191). Adding the two holography-related steps to the inversion process gives the complete digital simulation chain to obtain simulated frames from the 3-D TV operation. 3.1 Discrete Model for Off-Axis Holography
Mathematicalmodels for continuous off-axis holography can be found in the By using the Fresnel approx-imation and by assuming that the object is made up of van-ishingly thin slices in the z direction, we can write the intensity of the field distribution at a distance z from the object plane, i.e., the hologram, as
L(x,y) =
R
+ Ia(x,y) ** h(x,y)12+ R0x exp[—jkxsin(O)][a(x,y) **h(x,y)1
+ R0 exp[jkx sin(O)][a*(x,y) **ht(x,y)J , (12)
where h(x,y)=(1/jXz) exp[j(ir/Xz)(x2 +y2)],
k=
2ir/X, R0 is the amplitude of the plane wave, 0 is its angle of incidence, and ** isthe 2-D convolution operator. Here a(x,y) is the field just beyond the illuminated object plane.Because the field is represented as a 2-D convolution, it can be modeled as the output of a 2-D linear system, where the system impulse function is h(x,y).
For simulation, a discrete impulse function hZD(n,m) must be determined corresponding to the continuous impulse
func-fix
IllIllilIl
(a)
(b)
Fig. 2 Deformation in the passband as a consequence of the co-ordinate transformation: (a) rectangular passband of a bandpass tji(x,y) and (b) the corresponding passband of f(t,y).
vironmentis used, it is necessary to discuss the effects of conversion from continuous domain to the discrete domain. Furthermore, the nature of the digital algorithms used for the computations must be known, because the algorithms should be implemented with carefully selected parameters to have a faithful simulation of the continuous domain operation. Therefore, complete details ofdigital techniques that are used
/2 3=2iro cos(O)(
—)
\N/
E0 E(t,x,y)= 2'rr[(x—x0)2 + (yyo)2]"4I
[x2+(y_y1)2]'/2xft—
SAWOPTICAL ENGINEERING I March 1994 I Vol. 33 No. 3/839
k
E(t,x,y)=
E002rr[x2+
(y—y1)2]"4 tion h(x,y). In Ref. 12, a detailed analysis is given, so here,only the results are mentioned.
The discrete impulse response hZD(n,m) is given by
Nh-i
Mh-l
h. (n,m) =D
h(Xn,
Ym) if n
2 ' mf 2 elsewhere(13) where Nh and Mh give the discrete size of the filter in di— mensions n and m, respectively.
The input function can also be discretized similarly to yield
aD(n,m) =a(Xn,Ym)
In our implementations, we chose X =Y,i.e. ,N
=
M.For thepurpose of normalization, a new variable a, which is related to the sampling of the optical hologram, is introduced,'2 such that IT IT
N
Xz So,we have hZD(n,m) =exp[JX2(n2
+ m2)] =exP[Ja2(n2 + m2)] -(15) We define another variable 13 for the reference beam, where(19)
3.3 Digital Simulation of Inversion Relationship Thesimulations performed in this section test the inversion relationship and give hints about the possible performance of the proposed system. The inversion relationship given earlier between the source signalf(t,y) and the surface field 'i(x,y) is in the continuous domain. Furthermore, the signals are not restricted to have finite duration over the spatial or temporal domains. However, it is not difficult to extend the analysis to the case where the source array is discrete and finite.
3.3.1 Finite size effects
(14) Suppose thatfT(t,y) is the truncated version off(t,y), i.e.,
fT(t,y) =f(t,y)w(t,y) , (20)
where w(t,y) is a window function: w(t,y) =0
for tj>t or y>y
If
we take the Fourier transform of Eq. (20) and use a rec-tangular window, we getFT(uu)=[F(wu) **
2t5itc2y5inu] (21)(16) 4IT (Ot uy
where u =— k,as usual.
3.3.2 Discrete source effects
Supposethat the continuous input signal f(t,y) is sampled along the space variable y at equal intervals. The resultant signal isf(t,mY) =fD(t,m), which is equivalent to the discrete input case. Here Y is the sampling period. As a consequence of this sampling, we get
1
:
7 2ITr'\FD(w,u) =
F w, u +
—i- . (22)
For sufficiently large t and y and sufficiently small Y, YFD(W,U)=FT(W,U)=F (w,u)
-Inthe simulations given in this section, further
assump-2
2 /2
tions are made for computational purposes: The surface pat-Xf t —[(x—
x0)
+
(
y —Yo) I(18) tern is taken as a discrete/finite area pattern and the electrode
(_
sAw
J'
signalsare assumed to be discrete and finite also in t.
Let us denote the discrete surface wave pattern as
as given by the solution of the 2-D wave equation. JJfJ)(n,m) for n 0
N— 1, m 0
M— 1, and the When we have (k + 1) sources with excitations f(t, i) lo- discrete excitation signal by fD(a,b) for a =0 N' —1, cated along the y axis at (O,y), i =0 k, using super- b =0 M' —1.One can take the discrete Fouriertrans-position we get form (DFT) of 4iIJ)(n,m)toget as
where ci is given by Eq. (14). Now the discrete hologram can be written as
j(n,m) =
R0exp(j13n) + a(n,m) ** hZ(n,m)2 . (17)Similar operations can be done for the reconstruction case. To increase computational efficiency, circular convolutions can be used instead of linear convolutions with proper care. 3.2 Wave Propagation
In this section, we find the SAW pattern from the given
electrode signals. If we have a point source located at (x0,y0) with an excitation f(t), the field on the surface becomes
ONURAL, BOZDAGI, and ATALAR N—IM—1 72it 21T
nk+—ml) I
_____ ''tD(k,1)= i4i(n,m) exp i(\7ç;-M
/
n=O ,n=Owhere k=O,..., N—i, and 1=0 M— 1.
(23)
(lx
If there were no aliasing during the sampling of tJi1(x,y) to get 4i1!(n,m),the elementsof "J'11(k,1) would be proportional
to the samples of the continuous Fourier transform
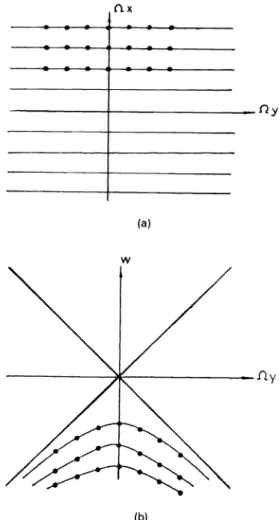
T'tj(Qr'1y) From these samples, which are located on a rec-tangular grid, we can also find the samples of F (w,u) using Eq. (1 1). In this case, however, the locations of the samples of F (w,u) do not form a rectangular grid. The locations are shown in Fig. 3. To use an inverse DFT to get the discrete time signals, uniformly sampled data are required; i.e.,we
have to know FD(d,e) for d=0 N' —1
and e=0
M'-l.
This can be achieved rather easily, because the sampling in the u direction is already uniform. A column of points, corresponding to a constant e (or equivalently to a constant u) can be taken at a time, digitally interpolated by a sufficient amount first, and then resampled to get the samples of F (o,u) at the proper locations to form a rectangular sampling grid. Ofcourse, the interpolation is different for each e. What we do is determine the locations of the desired rectangular samples over the (w,u) domain and then perform an inverse coordinate transformation to find the corresponding locations over the (1,fI,) domain. Because it is quite likely that these locations will not be the same locations as the discrete sam-ples of tlJ)('1),an interpolation between the uniform samples
of "Jf,.(k,l) will give the desired result. The interpolation between the uniform samples is computationally easier than interpolating over the (,u) domain using nonuniformly spaced samples. One can choose different interpolation meth-ods depending on the quality requirements and the available resources. For example, one method is choosing N a few times higher than the necessary value during the initial zero padding, and then using only those elements of P,(k,l) that correspond to the desired rectangular samples of F (w,u). Even though computational requirements of this method are much higher, the interpolation accuracy is better. Therefore, this method is used to get the examples in this paper. Other 2-D interpolation methods can be found in Refs. 13 or 14.
After interpolation and resampling, taking the inverse DFT
ofFD(d,e) for d=0 N' —1,
e=0
M' —1will giveus the discrete time signalsf(a,b), where
N—I M'—l
r I
fD(ab)=j
eO
FD(d,e) expLf(ad+be
fora=0
N'—landb=O
M'—i.Working in the discrete domain and using DFTs imply periodicity as usual. Computed fD(a,b) represents only one period of a 2-D periodic function. The size of the period is N' X M' .BothN' and M' must be large enough to hold almost
all ofthe energy ofthe time-space signal. Otherwise, additive tails from the neighboring periods will intrude into the main period showing as foldovers at the edges. Choosing large N' and M' is equivalent, in a sense, to having the space signal 8401OPTICALENGINEERING I March 1 994 I Vol. 33 No. 3
(b)
Fig. 3 Sample locations (a) before and (b) after the coordinate
transformation.
kJJ(,)
concentrated more at the center, so that the contri-bution of the edge electrodes is rather insignificant. To achieve this, the input space image is zero padded first to have large N and M.4
Simulation ResultsA 2-D 72 pattern is given in Fig. 4(a). The object size is 64 x128 pixels. The brightest level in the images (white) corresponds to 255 and the black corresponds to 0. Figure 4(b) shows the simulated hologram 4.(n,m) ofthis 2-D 72 pat-tern located in a 3-D space. The hologram is obtained by using the discrete model for off-axis holography given in Sec. 3. 1. The value of the distance (the third dimension) parameter a is 1 and the angle parameter 3 is 0.3. The hor-(24) izontal axis is x and the vertical axis is y. Using the com-putational procedure given in Sec. 3.3, the digital form of the electronic signals fD(a,b) that are going to be applied to the electrodes are computed for the hologram in Fig. 4(b). These electrode signals are presented in Fig. 4(c). Here, the horizontal axis is the ''electrode'
'
axis,whereas the vertical axis is the time; intensity represents the amplitude of the electrode signals. Computed time signals are for 256 elec-trodes. Each one of the 256 signals has 512 time points. The electrodes are at x = 0, y =Yk'where k =1 256. In thephysical implementation, the width of the transducer
elec-fly
fly
(a)
Ni
i :
:
iI,
i,'4!;
I/fj:;4: ::
': "h: Ir1t' ' ;
' , S (f)Fig. 4 (a) Two-dimensional pattern, (b) the simulated hologram of the 2-D pattern given in part a, (c) computed time signals, (d) the generated hologram at t= t, after the radiation of the time signals shown in part c, (e) reconstruction from the original hologram in part b, and (f) reconstruction from the pattern in part d. The parameters associated with the simulations are given in the text. (In all figures, the origin is the lower left corner.)
trodes will be of the order of a wavelength, i.e., they act like point sources. So in the simulations, we use the point source radiation, as described in Sec. 3.2 to get the resultant pattern. The excitation of the b'th electrode at instant a is fD(a,b). The computed field from the given excitations is shown in Fig. 4(d) at instant t,.
Here, the desired result is to have Figs. 4(b) and 4(d) exactly equal to each other. Using this new pattern as the hologram (which would be on the surface of the SAW), the original object (which is a 2-D, i.e., flat pattern located in 3-D space, for this simulated figure) can be reconstructed as in usual holography. This will be done optically in the real OPTICAL ENGINEERING I March 1994 1 Vol. 33 No. 3 1 841
(a)
(b)
(c)
ONURAL, BOZDAGI, and ATALAR
system, but here the reconstruction result is also obtained through simulation, as described in Sec. 3. 1. Note that the hologram recording and reconstruction processes are exactly the same. The result is shown in Fig. 4(e). For comparison, the same simulated reconstruction method is applied to the original hologram of Fig. 4(b). The result of this simulation is shown in Fig. 4(f). Here, the measure of success is the similarity of Figs. 4(e) and 4(f). The stripes result from a small angle between the reference and the object beams dur-ing recorddur-ing, and not from the inadequacy of either the proposed method or computational errors. As a consequence of the small angle, the undiffracted constant beam cannot be kept out of the visual field while viewing the reconstructed object, thus causing stripes. Increasing the angle will make them disappear, but in this case, the simulations will be com-putationally more complex because of increased resolution requirements (increased image size) as a result of the high-frequency fringes on the hologram. The degree of similarity of Figs. 4(e) and 4(f) is satisfactory. These figures are ob-tamed through careful simulations of the actual acousto-optical device, and therefore, they strongly imply that the quality of the 3-D frames obtained from the actual system will also be satisfactory.
There are no holograms involved in Fig. 5. These figures are used only to demonstrate the validity of the inversion process, as given by Eq. (11). Figure 5(a) is the original of a 2-D pattern. The pattern given in Fig. 5(b) is the computed
time signal for the electrodes, as explained in Sec. 3.3. If these signals are applied to the electrodes, the pattern shown in Fig. 5(c) is obtained over the crystal at t= t,. Thispicture is obtained using the procedures explained in Sec. 3.2. The degree of similarity between the original and the
recon-structed images is again satisfactory.
5
Proposed 3-D Television SystemA
3-D holographic television system that utilizes the tech-nique described in the previous sections should have a ho-lographic camera that captures the 2-D hologram representing a frame. A processor converts the captured hologram pattern to the electrode signals.A typical hologram pattern consists of interference fringes with variable frequencies. These variations are centered around the ''centerfrequency, '' which depends on the angle between the object beam and the reference beam during the recording of the original hologram. In our case, the hologram is generated as a SAW pattern at time t1.Surfaceripples created by SAW act like a phase grating when laser light is obliquely incident onto the crystal. Therefore, this is a phase hologram. A collimated light pulse with wavelength X at t1 isincident normally onto the crystal. Thus the reflected light from the crystal is exp[j2ir4i(x,y)/X]. To evaluate the per-formance of the SAW device as a phase grating, let us assume a sinusoidal SAW pattern, ii(x,y) =A sin(2irf0x), where A represents the amplitude of the SAW. This results in a
sin-Fig. 5 (a) Original 2-D pattern, (b) computed time signals, and (c) reconstructed object after the ra-diation of the time signals shown in part b. (The parameters are the same as in Fig. 4.)
842IOPTICAL ENGINEERING I March 1 994 I Vol. 33 No. 3
(c)
usoidal phase grating. In this case, the reflected light can be decomposed into the plane waves15 in the angular spectrum representation as
q Jq(21TA/X)i(fx 'if0 I;)
where Jq 5 the Bessel function of the first kind, order q, and L and f, are the angular frequency variables, f =
/2'rr
andf =
1/2rr.
The amplitude of the first diffraction order is of interest, and it is equal to J1(2'rrAIX). When this result is applied to our display device, the SAW amplitude (repre-sented by A) must be sufficiently high to have the first order visible. For a typical SAW transducer input power of 100 mW at 1 GHz, the surface displacement A is of the order of1 nm. Even though the expected diffraction efficiency is quite low, a visible first order is achievable with sufficiently high laser input power. The deflection angle of the first diffraction order is determined by the frequency of the phase grating'6 as sin ' (X'XsAw). For a typical separation angle of 10 deg and laser wavelength of 0.6 m, the center frequency is 290,000 fringes/m corresponding to a 3.4-pm spacing be-tween the fringes. The variation of the fringe frequency around the center frequency depends on the span ofthe ''view angle' 'ofthe hologram. The bandwidth requirement for a satisfactory view angle is easily met by the SAW bandwidth, which easily exceeds 10% of the center frequency.
The crystal that is used as the medium of display is a piezoelectric material, such as LiNbO3. Figure 6 shows the SAW interdigital transducers having finger pairs with bond-ing pads for external electrical coflnection.17'18 The spacbond-ing between the neighboring fingers is determined by the oper-ation frequency and the SAW velocity on the crystal. For LiNbO3, the SAW velocity is 3300 m/s and one wavelength at 970 MHz (the center frequency for the time-varying elec-trode signals for a typical hologram pattern) is 3.4 rim. Finger centers are separated by a half wavelength. The number of fingers should be selected according to the required band-width, which in turn determines the view angle of the 3-D frame. For example, a 10% SAW transducer bandwidth would be more than necessary. There will be no significant distortion in the generated acoustic waves, because the power levels are far from inducing any nonlinear effects. The width of the transducer electrodes must not be more than a few wavelengths to guarantee that the transducers act like point sources.
A continuous 3-D operation is achieved by sending the frames frequently enough, as in conventional television. The maximum frame repetition rate is related to the crystal length and speed of wave propagation over the surface. For example, a 6-cm-long LiNbO3 crystal yields a maximum rate of 55,000 frames/s. This rate is a few orders of magnitude higher than the rate needed to obtain motion pictures.
There is also a relation between the size of the crystal and the time duration of the signal that is applied to generate a surface pattern: the limited size also limits the duration. The inversion relation, as presented by Eq. (1 1), assumes no limits in any of the (x,y) or tcoordinates.The effects of finite size are discussed in Sec. 3.3. The introduction error will reveal itself as a loss in resolution over the surface pattern. Increas-ing the crystal size will also result in an increase in resolution
Fig. 6 Section of the device, where only four of the transducers are shown.
asa consequence of longer duration time signals. However, the typical size of 6 cm is more than enough to get time signals that will yield the desired resolution. The simulation results presented in this paper correspond to much smaller crystal size and still achieve acceptable resolution perfor-mance.
The same principle can also be used for color as well as monochrome 3-D television. For color operation, the holo-gram pattern that is going to be formed on the crystal surface should be the pattern associated with color holography, and the light pulse should be suitable for color operation, such as that obtained from multiple sources.
The duration of the laser pulse should be short enough to ''freeze''the
time-varying surface pattern when it just forms the hologram. The effect of longer pulse than needed will definitely degrade the 3-D frame. However, these effects are unknown. But it is expected that a pulse duration of the order of nanoseconds will be sufficient.
6
ConclusionAnacousto-optical holographic display, which is essentially
a SAW device, is presented. The display can be used for 3-Dholographic television. It can also be used to display computer-generated hologram sequences. It is understood from the simulations that the presented inversion relation and the associated computational procedure give the desired sur-face hologram pattern. The simulated reconstruction from this regenerated hologram also shows that the 3-D image quality is satisfactory.
ONURAL, BOZDAGI, and ATALAR
The horizontal space resolution is determined by the acoustic wavelength and, therefore, can be easily increased to the optical limits. The computations based on the propa-gation speed ofacoustic waves show that the proposed system is expected to solve the sequential write-and-erase problem common to other holographic video displays.
The number of electrodes affect the quality of the holo-gram pattern that is formed on the crystal surface. This, in turn, affects the quality ofthe reconstructed 3-D scene. Better quality is achieved with more electrodes. A few hundreds of electrodes give an acceptable image whose quality is com-parable to that of the ordinary TV picture.
In simulations, we assumed discrete and periodic signals. As a consequence of carefully selected parameters, the sim-ulator is successful. So if a sufficient number of electrodes are used and the information content of the input image is rather concentrated around the center ofthe crystal, we expect that the actual system will give 3-D frames similar to those shown by the simulation results. Furthermore, the simulator can be easily improved to consider some nonideal situations associated with the operation of the physical system. This may result in generation of more appropriate electrode sig-nals, which may compensate for these degrading effects. For example, if the acoustic attenuation in the crystal is known, this information can be added to the derivation steps of Sec. 2togive an inversion relation where the effects of acoustic attenuation are compensated and the resultant surface pattern still has the desired form even if there is attenuation. Simi-larly, the effect of anisotropy in the SAW crystal can be taken into account by modifying the inversion relationship.
References
1 . H.B. Brown, S. C. Noble, and B. V. Markevitch, ''Three-dimensional
television system using holographic techniques,' ' U.S. Patent No. 4,376,950 (March 15, 1983).
2. K. Sato, K. Higuchi, and H. Katsuma, ''Holographictelevision by liquid
crystal device," Proc. SPIE 1667,19—31(1993).
3. R. L. Kirk, ''Electronicallygenerated holography,' 'InternationalPatent
No. WO 84/00070 (Jan. 5, 1984).
4. H. L. Enloe, W. C. Jakes, Jr., and C. B. Rubinstein, ''Realtime three
dimensional television system utilizing wave front reconstruction
tech-niques," U.S. Patent No. 3,541,328 (Nov. 17, 1970).
5. H. L. Enloe, W. C. Jakes, Jr., and C. B. Rubinstein, ''Realtime holo-graphic television system,' 'U.S.Patent No. 3,55 1 594 (Dec. 29, 1970).
6. S. A.Benton, "Experiments in holographic video,' 'Proc.SPIE IS-08,
247—267(1991).
7. P. St. Hilaire, S. A. Benton, M. Lucente, M. L. Jepsen, J. Kollin, H.
Yoshikawa, and J. Underkoffler, ''Electronicdisplay system for
com-putational holography,' 'inPracticaiHolography IV, S. A. Benton, Ed., Proc.SPIE 1212, 1212—1220 (1990).
8. Y. I. Ostrovsky, Holography and Its Applications, Academic Press,
New York (1977).
9. 5. A.Collins, ''Opticalcomputing with optical spatial light modula-tars,' 'inOptical Computing, B. S. Whenett and F. A. P. Tooley, Eds., Proc. 34th Scottish Universities Summer School in Physics, p. 38,
Red-woodBurn Ltd. (1988).
I0. K. lizuka, Engineering Optics, 2nd ed., Springer-Verlag, Berlin (1987).
1 1 . G.Liu and P. D. Scott, ''Phaseretrieval and the digital reconstruction of holograms: comparison of in-line and split-beam holography,' ' in
Proc. 24th Ann. Allerton Conf on Communication, Control, and Com-puting, pp. 204—212 (Oct. 1986).
12. L. Onural and P. D. Scott, "Digital decoding of in-line holograms,"
Opt.Eng. 26(1 1), 1 124—1 132 (1987).
13. P. Sathyanarayana, P. S. Reddy, and M. N. Swamy, "Interpolation of
2-D signals," IEEE Trans. Circ. Syst. 37(5), 623—625 (1990). 14. D. E. Dudgeon and R. M. Mersereau, Multidimensional Signal
Pro-cessing, Chap. 7, pp. 369—370, Prentice-Hall, Englewood Cliffs, N.J. (1984).
844 1OPTICAL ENGINEERING I March 1 994 1 Vol. 33 No. 3
15. J. W. Goodman, introduction to Fourier Optics, pp. 69—70, McGraw
Hill,New York (1968).
16.W. R. Klein and B. D. Cook, "Unified approach to ultrasonic light
diffraction," IEEE Sonics Ultrason. SU-14, 123—134 (1967).
17. G. S. Kino, Acoustic Waves: Devices, imaging, and Analog Signal Processing, Chap. 4, p. 319, Prentice-Hall, Englewood Cliffs, N.J.
(1987).
18. C. K. Campbell, ''Applicationsof surface acoustic and shallow bulk acoustic wave devices," Proc. IEEE 77(10), 1453—1484 (1989).
LeventOnural received BS and MS de-grees in electrical engineering from the Middle East Technical University, Ankara, Turkey, in 1979 and 1981 , respectively, and the PhD degree in electrical and com-puter engineering from the State University of New York at Buffalo in 1985. He was a Fulbright Scholar between 1 981 and 1985. After being a research assistant professor in the Electrical and Computer Engineering
- . Department of the State University of New
York at Buffalo, he joined the Electrical and Electronics Engineering Department ofthe Bilkent University, Ankara, Turkey, in 1987, where he is an associate professor. His present research interests are im-age processing, signal processing, holography, video coding, and texture analysis. He is a member of SPIE and a senior member of
IEEE.
GözdeBozdaireceived her BS degree from the Middle East Technical University, Ankara, Turkey, and her MS degree from Bilkent University, Ankara, Turkey, in 1988 and 1990, respectively, both in electrical and electronics engineering. She is cur-rently a PhD student and a research as-sistant in the Electrical and Electronics De-partment of Bilkent University. Her current research interests include image process-ing, video codprocess-ing, 3-D motion estimation, and holography. She is a student member of IEEE, ACM, and SPIE. AbduUah Atalar received his BS degree from the Middle East Technical University, Ankara, Turkey, in 1974 and MS and PhD degrees from Stanford University, Califor-nia, in 1976 and 1978, respectively, all in electrical engineering. His thesis work was on reflection acoustic microscopy. From 1978 to 1980 he was first a postdoctoral fellow and later an engineering research associate at Stanford University continuing his work on acoustic microscopy. For eight months he was wILn Hewlett Packard Labs, Palo Alto, California, engaged in photoacoustics research. From 1 980 to 1 986 he was on the faculty of the Middle East Technical University as an assistant professor. From 1982 to 1983, on leave from the university, he was with Ernst Leitz Wetzlar, West Germany, where he was involved in the development of the commercial acoustic microscope. In 1 986 he joined the Bilkent University as the chairman of the Electrical and Electronics Engineering Department and served in the founding of the department where he is currently a professor. His current re-search interests include acoustic imaging, linear acoustics, and computer-aided design in electrical engineering. In 1984 he was awarded the H. Tuaç Foundation Award of Tubitak, Turkey, for his contributions to acoustic microscopy. He is a senior member of IEEE.