Proteomic Analysis of Kidney Preservation
Solutions Prior to Renal Transplantation
Abdurrahman Coskun1*, Ahmet Tarik Baykal1, Dilek Kazan2, Muslum Akgoz3, Merve Oztug Senal3, Ibrahim Berber4, Izzet Titiz5, Gokhan Bilsel3, Hakan Kilercik6,Kubra Karaosmanoglu2, Muslum Cicek6, Ilknur Yurtsever7, Cevat Yazıcı8
1 Acibadem University School of Medicine, Department of Medical Biochemistry, Istanbul, Turkey, 2 Marmara University Engineering Faculty, Department of Bioengineering, Istanbul, Turkey, 3 National Metrology Institute, Gebze, Turkey, 4 Acibadem University School of Medicine Department of General Surgery, Istanbul, Turkey, 5 Haydarpasa Numune Research and Training Hospital, Department of General Surgery, Istanbul, Turkey, 6 Yeni Yuzyil University, Gaziosmanpasa Hospital, Department of Anesthesiology, Istanbul, Turkey, 7 Istanbul Medipol University, Regenerative and Restorative Medicine Research Center, Beykoz/Istanbul, Turkey, 8 Erciyes University, School of Medicine, Department of Medical Biochemistry, Kayseri, Turkey
Abstract
One of the main issues in kidney transplantation is the optimal functional preservation of the organ until its transplantation into the appropriate recipient. Despite intensive efforts, the functional preservation period remains limited to hours. During this time, as a result of cellu-lar injury, various proteins, peptides, and other molecules are released by the organ into the preservation medium. In this study, we used proteomic techniques to analyze the protein profiles of preservation solutions in which organs had been preserved prior to their trans-plantation. Samples were obtained from the preservation solutions of 25 deceased donor kidneys scheduled for transplantation. The protein profiles of the solutions were analyzed using 2D gel electrophoresis/MALDI-TOF and LC-MS/MS. We identified and quantified 206 proteins and peptides belonging to 139 different groups. Of these, 111 proteins groups were belonging to kidney tissues. This study used proteomic techniques to analyze the protein profiles of organ preservation solutions. These findings will contribute to the development of improved preservation solutions to effectively protect organs for transplantation.
Introduction
The success of transplantation depends not only on the surgical techniques and immunosup-pressive agents used, but also on efficient preservation of the organ prior to transplantation. Thus, one of the main issues in transplantation is the optimal functional preservation of the organ until it is transplanted into the appropriate patient.
Without preservation, viability of the organ is limited to a period of 30–60 min after its dis-connection from the native circulation [1]. Thereafter, the development of oxygen deficiency, the need for metabolic substrates, and the accumulation of metabolic end products result in progressive organ damage. This is the case in the kidney, in which ischemia and reperfusion
a1111111111 a1111111111 a1111111111 a1111111111 a1111111111 OPEN ACCESS
Citation: Coskun A, Baykal AT, Kazan D, Akgoz M,
Senal MO, Berber I, et al. (2016) Proteomic Analysis of Kidney Preservation Solutions Prior to Renal Transplantation. PLoS ONE 11(12): e0168755. doi:10.1371/journal.pone.0168755
Editor: Niels Olsen Saraiva Caˆmara, Universidade
de Sao Paulo, BRAZIL
Received: March 5, 2016 Accepted: December 6, 2016 Published: December 30, 2016
Copyright:© 2016 Coskun et al. This is an open access article distributed under the terms of the Creative Commons Attribution License, which permits unrestricted use, distribution, and reproduction in any medium, provided the original author and source are credited.
Data Availability Statement: All relevant data are
within the paper and its Supporting Information files.
Funding: This study was financed by The Scientific
and Technological Research Council of Turkey (TUBITAK), project number 110S103,http://www. tubitak.gov.tr/en. The funder had no role in study design, data collection and analysis, decision to publish, or preparation of the manuscript.
Competing Interests: The authors have declared
injury following transplantation are unavoidable [2]. Even during partial nephrectomy in patients with normal preoperative kidney function, warm ischemia causes a significant deteri-oration of kidney function, especially after the first 30 min [3]. To efficiently protect organs prior to transplantation, both hypothermia and pharmacological agents are commonly employed. Hypothermia suppresses the metabolic rate during the preservation period; how-ever, when used alone, it does not confer adequate organ protection. Furthermore, it has seri-ous side effects that promote cell injury and play a key role in delayed graft function [4]. This condition is seen in 20–50% of transplanted cadaver kidneys and is a major risk factor influ-encing both the early and long-term survival of a transplanted organ [4]. Instead, hypothermia is used in combination with pharmacological agents, such as preservation solutions. The latter include the University of Wisconsin, Euro Collins, histidine-tryptophan-ketoglutarate, and Celsior. Yet, despite these and other efforts, the functional preservation period of solid organs is still limited to hours. By contrast, cells such as erythrocytes can be preserved for very long periods of time. Improving the preservation time of solid organs—either by developing new preservation solutions or modifying existing ones—requires a detailed understanding of the pathophysiological changes that occur in the organ during preservation. These changes include cellular injury that leads to the release of enzymes, proteins, and other molecules by the organ into the preservation medium. The proteins and peptides in the preservation solu-tion can be analyzed in detail using proteomic techniques. Therefore, the aim of this study was to use 2D gel electrophoresis/matrix-assisted laser desorption/ionization time-of-flight mass spectrometry (MALDI-TOF) and liquid chromatography-tandem mass spectrometry
(LC-MS/MS) to analyze the proteins and peptides that are passed from the kidneys to the pres-ervation solution during the period of organ prespres-ervation.
Material and Methods
Donor population
Preservation solutions were obtained from those used to preserve 25 deceased donor (14 men and 11 women) kidneys prior to transplantation. We used University of Wisconsin solution to preserve organs prior to transplantation. The median age of donors’ was 48 (range 29–78) years old. All donors were donation after brain death. All kidneys were preserved with static cold storage and the median of cold ischemia time (CIT) was 720 (range 145–1140) minutes. 25 samples were used for two dimensional polyacrylamide gel electrophoresis (2D PAGE) and 18 samples were used for Quadrupole-TOF (Q-TOF) analysis. This study was conducted at the Acibadem University and Marmara University in Istanbul and at the National Metrological Institute, Gebze, Kocaeli, Turkey. The study protocol was approved by the Ethics Committee of Acibadem University and written informed consent from all participants or the next of kin were obtained for the use of the samples in the study.
Materials
The 2D electrophoresis equipment, i.e., isoelectric focusing (PROTEAN IEF) and Sodium dodecyl sulfate—polyacrylamide gel electrophoresis (protean II XI 2-D cell), the immobilized pH gradient (IPG; BioLyte) strips, mineral oil, glycine, ampholytes, and Ready Prep 2D clean-up kit were obtained from Bio-Rad (Hercules, CA, USA). SDS, tris, urea, thiourea, ammonium bicarbonate, 3-[(3-cholamido propyl) dimethylamonio]-1-propanesulfonate (CHAPS), isopro-panol, iodoacetamide, acrylamide, bisacrylamide, the ProteoSilver Plus Silver Stain Kit, glyc-erol, andα-cyanohydroxycinnamic acid were obtained from Sigma-Aldrich (St. Louis, MO, USA). Tetramethylethylenediamine, dithiothreitol (DTT), ethanol, and methanol were from Merck. (Whitehouse Station, NJ, USA). The 2D Quant kit was purchased from GE Healthcare Abbreviations: CHAPS, 3-[(3-cholamido propyl)
dimethylamonio]-1- propanesulfonate; CIT, Cold ischemia time; DTT, Dithiothreitol; HSP, Heat shock protein; IEF, Isoelectric focusing; IPG, Immobilized pH gradient; LC-MS/MS, Liquid chromatography-tandem mass spectrometry; MALDI-TOF, Matrix-assisted laser desorption/ionization time-of-flight; NADPH, Reduced nicotinamide adenine dinucleotide phosphate; Q-TOF, Quadrupole- time-of-flight; TGF, Transforming growth factor; 2D PAGE, Two dimensional polyacrylamide gel electrophoresis.
(Piscataway, NJ, USA). Dimethylated, proteomics grade trypsin from porcine pancreas was obtained from Sigma Aldrich.
Sample preparation
All preservation solution samples were centrifuged for 15 min at 1500g and stored at −80˚C
until analysis. The samples were concentrated and prepared for IEF using the Ready Prep 2D clean-up kit. The resulting pellets were resuspended in buffer containing 7 M urea, 2 M thiourea, 4% CHAPS, and 20 mM Tris-HCl, pH 8.8. After centrifugation of the samples at 14,000g for 15
min at 4˚C, the supernatant was transferred to a clean microcentrifuge tube, and the protein concentration was determined using the 2D Quant kit according to the manufacturer’s protocol.
IEF/SDS PAGE and image analysis
The IEF and 2D PAGE analysis were done according to the manufacturer’s (Bio-Rad) proto-col. The protein samples (150μg) were mixed with 315 μl rehydration solution (7 M urea, 2 M thiourea, 4% CHAPS, 1% DTT, 0.2% ampholyte IPG pH 3–10, 5% glycerol, 10% isopropanol) and then incubated at room temperature for 20 min. They were then centrifuged for 5 min at 14,000g, applied to 18-cm pH 3–10 IPG strips, and passively rehydrated overnight at room
temperature. The proteins were focused using the following steps: 200 V (hold) for 15 min, 1000 V (gradient) for 3 h, 10000 V (hold) for 3 h, for a total of 55,000 V. Following IEF, the IPG strips were incubated first in 10 mL equilibration buffer (50 mM Tris-HCl, pH 8.8, 6 M urea, 30% glycerol, 2% SDS, 1% DTT, 0.002% bromophenol blue) for 15 min and then in alkyl-ation buffer [50 mM Tris-HCl, pH 8.8, 6 M urea, 30% glycerol, 2% SDS, 4.5% (w/v) iodoaceta-mide, 0.002% bromophenol blue] for another 15 min. After incubation, the IPG strips were placed on top of the 12.5% SDS polyacrylamide gels and sealed with 1% agarose solution. The running conditions were 16 mA/gel for 30 min followed by 24 mA/gel for 5.5 h or until the dye ran out of the gel. The gels were subsequently stained using the ProteoSilver Plus Silver Stain Kit and imaged. The images were scanned using the HP Scanjet G4050 photo scanner and then analyzed and compared with the control gel image (human plasma) by gel matching. Protein spots that differed from the control were determined manually.
In-gel protein digestion
The selected protein spots were excised manually from the gels and digested with modified tryp-sin as follows [5]. Gel pieces destained using the ProteoSilver Plus Stain Kit were washed twice with 50% (v:v) aqueous acetonitrile containing 25 mM ammonium bicarbonate, then once with acetonitrile, and dried in a vacuum concentrator for 20 min. After incubation in 10 mM DTT (in 100 mM ammonium bicarbonate) for 30 min at 56˚C and then in 55 mM iodoacetamide solution (in 100 mM ammonium bicarbonate) for 20 min at room temperature in the dark, the proteins were washed with acetonitrile and dried in a vacuum concentrator for 20 min. Proteins in the gel pieces were digested in 30μl trypsin solution (20 μg trypsin/ml in 0.1 mM HCl, 40 mM ammonium bicarbonate, 9% acetonitrile) overnight at 37˚C. The samples were then transferred into clean microcentrifuge tubes and dried to complete dryness in a vacuum concentrator. The peptide mixture was resuspended in 5μl 0.1% trifluoroacetic acid for MALDI-TOF analysis.
MALDI-TOF peptide mass fingerprinting analysis
Samples were prepared according to the manufacturer’s protocol [6]. The sample solution was mixed with the CHHA matrix [α-cyano-4-hydroxycinnamic acid saturated in 50:50 (v/v) ace-tonitrile:trifluoroacetic acid (0.1%) in water] at a 1:1 ratio, deposited onto the ground-steel
MALDI MTP 384 target plate (Bruker Daltonics, Bremen, Germany), and allowed to dry. The samples were analyzed using the Autoflex MALDITOF/TOF instrument (Bruker Daltonics) in positive reflectron mode. The instrument was set at the following acquisition parameters: laser; 70%, frequency: 60, mass range acquisition: 500–3500 Da, number of shots: 500, sample rate: 0.5 GS/S, electronic gain: 100 Mv. The spectra were calibrated using an external calibration standard (peptide calibration standard II; Bruker Daltonics). The data were analyzed using the recalibrated peak list generated by Flex Analysis (v. 2.4). The annotated spectra were transferred to BioTools (v. 3.0), with an interface to the MASCOT database search engine (www.matrixscience.com; Matrix Science, London, UK). The database parameters were as follows: SwissProt 2013_02 data-base; taxonomy:Homo sapiens, enzyme: trypsin, global modifications: carbamido methyl
cyste-ine, mass values: MH+ monoisotopic, maximum missed cleavage sites: 1, peptide charge: 1 H+, mass tolerance MS: 100 ppm. Confidence in the peptide identifications was assessed based on the MASCOT sequence assignment score and visual inspection of the molecular mass and the pI val-ues of the selected spots from the gels.
Q-TOF analysis
In addition to 2D gel electrophoresis/MALDI-TOF, a shotgun proteomic technique was used to obtain the complete protein profile of the preservation solution. Prior to Q-TOF analysis, the solution was subjected to immunodepletion (described below) to remove several of the major proteins that could have masked proteins of interest originally present in the preserva-tion solupreserva-tion at low concentrapreserva-tions.
Immunodepletion
The Human 14 multiple affinity removal system (Agilent) was used to deplete highly abundant proteins from the preservation solution samples. Briefly, a 4.6× 50mm Hu14 column was equili-brated with buffer A at a flow rate of 0.125 ml/min for 10 min, after which 20μl preservation solution sample were mixed with 80μl buffer A and injected onto the column. Isocratic elution of the flow-through fraction with buffer A yielded the protein-depleted preservation solution samples; isocratic elution with buffer B at a flow rate of 1 ml/min yielded the highly bound abundant proteins. All of the samples were lyophilized and dissolved in 200μl 50 mM ammo-nium bicarbonate solution and dialyzed overnight against 50 mM ammoammo-nium bicarbonate.
Trypsin digestion
A filter-aided sample preparation method was used to generate the tryptic peptides [7]. Briefly, 50μg protein solution were incubated at 95˚C for 15 min in Universal protein extraction buffer (Expedeon), washed with 6M urea in a 30-kDa cut-off spin column, alkylated with 10 mM iodoacetamide, and trypsinized overnight (1:100trypsin to protein ratio). The resulting tryptic peptides were diluted to 100μg/μl and transferred to a liquid chromatography vial.
LC-MS/MS analysis and database search
LC-MS/MS analysis and protein identification were performed following our previously pub-lished protocol [8]. Briefly, for each experimental condition, 500 ng tryptic peptides in 5μl of solution were analyzed using a nano LC-MS/MS system [nano ACQUITY ultra performance liq-uid chromatography and SYNAPT high definition mass spectrometer with a nano-lock spray ion source; (Waters)]. The columns were equilibrated with 97% mobile phase A (0.1% formic acid in LC-MS grade water (Merck); the column temperature was set to 45˚C. The peptides were eluted from the trap column (Symmetry C18 5μm, 180-μm i.d. × 20 mm, Waters) by gradient
elution onto an analytical column (BEH C18, 1.7μm, 75-μm i.d. × 250 mm, Waters) at a flow rate of 300 nl/min, with a gradient of 5–40% mobile phase B (0.1 formic acid in hyper grade ace-tonitrile, Merck), over a 90-min period. The MS parameters were set as reported previously [9]. The instrument was run in positive ion V mode, applying the MS and MS/MS functions over 1.5-s intervals with 6-V low-energy and 15- to 40-V high energy collisions. Glu-fibrinopeptide (internal mass calibrant) was infused every 45 s at a flow rate of 300 nl/min. Peptides withm/z
values of 50–1600 were analyzed. Tandem mass data extraction, charge state deconvolution, and deisotoping were performed using the ProteinLynx Global Server v. 2.5 (Waters) and searched using the IDENTITYE algorithm, with a fragment-ion mass tolerance of 0.025 Da and a parent-ion tolerance of 0.0100 Da against the reviewedHomo sapiens protein database from Uniprot.
The databank search query was set to a minimum of 3 fragment ion matches per peptide, a mini-mum of 7 fragment ion matches per protein, a minimini-mum of 1 peptide match per protein, and 1 missed cleavage. The following variable modifications were also set: carbamido methyl-cysteine fixed modification, and acetyl N-TERM, asparagine and glutamine deamidation, and methio-nine oxidation. Progenesis LC-MS software v. 4.0 (Nonlinear Dynamics) was used to calculate the fold expression changes. Normalization across the sample set was based on the total ion intensities. After chromatographic alignment, normalization, and calculation of the peptide abundances and fold expression changes, an Excel file listing the normalized abundances of all the identified proteins was generated [10].
Determination of kidney proteins
The database of the Human Kidney and Urine Proteome Project [11] was used to determine kidney-derived proteins and peptides in the immunodepleted samples.
Statistical analysis
We used Kolmogorov-Smirnov test to evaluate the normality of the data. Correlations between variables were assessed using Spearman correlation analysis. Values of p<0.05 were considered as statistically significant.
Results
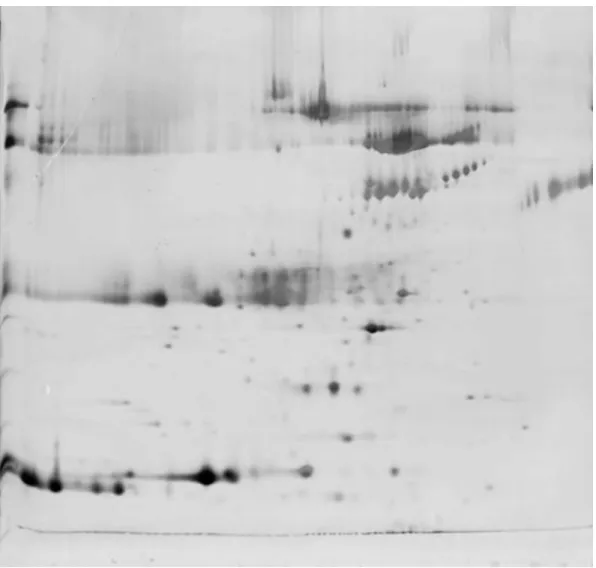
Only a limited number of proteins could be identified using 2D gel electrophoresis (Fig 1), whereas 206 proteins and peptides belonging to 139 different groups were identified and quan-tified using LC-MS/MS, in the preservation solutions of kidneys prior to transplantation (S1 Table). Within 139 protein groups 111 proteins groups belonged to kidney tissues (Table 1). The hematological and biochemical test results of patients’ (n: 18) followed up for one year are given as supplemental data (S2 Table). The median and interquartile range of recipients’ serum BUN and creatinine levels were 8.9 mmol/L (7.3–10.9) and 120.2μmol/L (102.5–156.5) respectively. As shown inTable 2, there were significant correlations between the levels of pro-teins (based on their ion intensities) of preservation solutions and donors’ age (23 propro-teins), CIT (5 proteins), recipients’ serum BUN (12 proteins) and creatinine (7 proteins) levels. There-fore, the levels of these proteins in preservation solution can potentially be used as a reporter of marginality of kidney prior to transplantation. Additionally, the levels of these proteins can be used also to evaluate the viability of organs prior to transplantation.
Functional classification of the identified proteins was done with PANTHER overrepresenta-tion test (http://www.pantherdb.org/). The test was run for the classifications based on pathways, molecular function, biological processes, cellular compartment, and protein class (Table 3). Based on the test the identified proteins exhibit overrepresentation of glycolysis related proteins (p = 9.85E-13) (Table 3A). The top 3 group of the identified proteins have molecular functions
related to structural constituent of cytoskeleton (p = 1.09E-10), serine-type endopeptidase
inhibi-tor activity (p = 7.73E-09), and peptidase inhibitor activity (p = 1.70E-08) (Table 3B). A large number of the identified proteins play a role in biological processes like cellular component organization or biogenesis (p = 4.47E-16) and cellular component morphogenesis (p = 4.57E-14)
(Table 3C). PANTHER GO-Slim database shows that there is a overrepresentation of proteins from cellular compartments of actin cytoskeleton (p = 1.08E-07), and cytoskeleton (p =
6.29E-07) (Table 3D). The major overpresentation with the highest fold enrichment in terms of protein class was found to be histone (p = 1.82E-19), serine protease inhibitor (p = 8.04E-09) and actin
family cytoskeletal protein (p = 1.89E-08) (Table 3E).
Discussion
The contents of a pre-transplantation organ preservation solution provide a “liquid biopsy” of the transplanted organs and therefore carry valuable information about their survival and functionality. We isolated 111 kidney-derived proteins and peptide groups from the pre-trans-plantation preservation solution. Further analysis of the proteins showed that they originated from both extracellular and intracellular regions of the kidney tissue.
Fig 1. Protein spots of kidney preservation solution identified by 2D gel electrophoresis. doi:10.1371/journal.pone.0168755.g001
Table 1. Proteins and peptides belonging to kidney tissues detected from preservation solution using LC-MS/MS (n:18).
Main Proteins Sub Groups Entry Name
(UniProt)
Gene Name Accession Number (UniProt)
Database (G,M) Actin
Actin cytoplasmic 1 ACTB ACTB P60709 G,M
Actin cytoplasmic 2 ACTG ACTG1 P63261 G
Actin alpha cardiac muscle 1 ACTC ACTC1 P68032 G,M
Beta actin like protein 2 ACTBL ACTBL2 Q562R1 M
Putative beta actin like protein 3 ACTBM POTEKP Q9BYX7 M
Actinin Alpha actinin 4 ACTN4 ACTN4 O43707 G,M
Transgelin
Transgelin TAGL TAGLN Q01995 G,M
Transgelin 2 TAGL2 TAGLN2 P37802 G,M
Vitamin D Binding Protein Vitamin D binding protein VTDB, D6RF35
GC P02774 M
Leucine rich alpha 2 glycoprotein Leucine rich alpha 2 glycoprotein A2GL LRG1 P02750 M
Lumican Lumican LUM LUM P51884 G,M
Collagen
Collagen alpha 3 VI chain CO6A3 COL6A3 P12111 G,M
Collagen alpha 2 VI chain CO6A2 COL6A2 P12110 G,M
Collagen alpha 1 VI chain CO6A1 COL6A1 P12109 G,M
Collagen alpha 1 XVIII chain COIA1 COL18A1 P39060 G,M
Vimentin Vimentin VIME VIM P08670 G,M
Heat Shock Protein
Heat shock cognate 71 kDa protein HSP7C HSPA8 P11142 G,M
Heat shock 70 kDa protein 1A and 1B HS71A and HS71B HSPA1A and HSPA1B P0DMV8 and P0DMV9 (old number P08107) G,M
Heat shock protein beta 1 HSPB1 HSPB1 P04792 G,M
Heat shock 70 kDa protein 6 HSP76 HSPA6 P17066 G
Heat shock protein HSP 90 beta HS90B HSP90AB1 P08238 M
60 kDa heat shock protein mithocondrial
CH60 HSPD1 P10809 G,M
Protein 14 3 3
14 3 3 protein zeta delta 1433Z YWHAZ P63104 G,M
14 3 3 protein epsilon 1433E YWHAE P62258 G,M
14 3 3 protein gamma 1433G YWHAG P61981 G,M
14 3 3 protein beta alpha 1433B YWHAB P31946 G,M
14 3 3 protein eta 1433F YWHAH Q04917 G,M
Gelsolin Isoform 2 of Gelsolin GELS GSN P06396 G,M
Cofilin Cofilin 1 COF1 CFL1 P23528 G,M
Vitronectin Vitronectin VTNC VTN P04004 G,M
Tubulin
Tubulin beta chain TBB5 TUBB P07437 G,M
Tubulin alpha 1B chain TBA1B TUBA1B P68363 M
Clusterin Clusterin CLUS CLU P10909 G,M
Annexin
Annexin A5 ANXA5 ANXA5 P08758 G,M
Annexin A1 ANXA1 ANXA1 P04083 G,M
Tropomyosin
Isoform 2 of Tropomyosin beta chain TPM2 TPM2 P07951-2 G,M
Table 1. (Continued)
Main Proteins Sub Groups Entry Name
(UniProt)
Gene Name Accession Number (UniProt)
Database (G,M)
Tropomyosin beta chain TPM2 TPM2 P07951 G,M
Prelamin Prelamin A C LMNA LMNA P02545 G,M
Myosin
Myosin 9 MYH9 MYH9 P35579 G,M
Myosin light polypeptide 6 MYL6 MYL6 P60660 G,M
Isoform 2 of Myosin 11 MYH11 MYH11 P35749-2 G,M
Amyloid P Serum amyloid P component SAMP APCS P02743 G,M
Profilin Profilin 1 PROF1 PFN1 P07737 G,M
Alpha Crystallin Alpha crystallin B chain CRYAB CRYAB P02511 G,M
Cathepsin D Cathepsin D CATD CTSD P07339 G,M
Galectin Galectin 1 LEG1 LGALS1 P09382 G,M
Keratin
Keratin type II cytoskeletal 8 K2C8 KRT8 P05787 M
Keratin type I cytoskeletal 18 K1C18 KRT18 P05783 M
Keratin type I cytoskeletal 19 K1C19 KRT19 P08727 M
Thymosin Thymosin beta 4 TYB4 TMSB4X P62328 M
Filamin Filamin A FLNA FLNA P21333 G,M
Rab GDP Dissociation Inhibitor Rab GDP dissociation inhibitor beta GDIB GDI2 P50395 G,M
Protein DJ Protein DJ 1 PARK7 PARK7 Q99497 G,M
Transforming Growth Factor Transforming growth factor-beta-induced protein ig-h3
BGH3 TGFBI Q15582 G,M
Rho GDP Dissociation Inhibitor Rho GDP Dissociation inhibitor 1 GDIR ARHGDIA P52565 G,M LIM Domains Four and a half LIM domains protein
1
FHL1 FHL1 Q13642 G,M
Calmodulin Calmodulin CALM CALM1 P62158 G
Beta 2 Microglobulin Beta 2 microglobulin B2MG B2M P61769 G
Microfibril Accociated Glycoprotein Microfibril associated glycoprotein 4 MFAP4 MFAP4 P55083 G,M
Vinculin Vinculin VINC VCL P18206 G,M
Basement Membrane Specific Heparan Sulfate Proteoglycan Core Protein
Basement membrane specific heparin sulfate proteoglycan core protein
PGBM HSPG2 P98160 G,M
Lysozyme C Lysozyme C LYSC LYZ P61626 G,M
Mimecan Mimecan MIME OGN P20774 G,M
Serotransferrin Serotransferrin TRFE TF P02787 G,M
Caldesmon Caldesmon CALD1 CALD1 Q05682 G,M
Talin Talin 1 TLN1 TLN1 Q9Y490 G,M
Myomegalin Myomegalin MYOME PDE4DIP Q5VU43 M
Alpha 1 anti-chymotrypsin Alpha 1 anti-chymotrypsin AACT SERPINA3 P01011 G,M
Ceruloplasmin Ceruloplasmin CERU CP P00450 M
Complement
Complement C4 A CO4A C4A P0C0L4 G,M
Complement C4 B CO4B C4B P0C0L5 G,M
Complement factor B CFAB CFB P00751 M
Complement factor I CFAI CFI P05156 M
Complement C3 CO3 C3 P01024 G,M
Complement component C9 CO9 C9 P02748 G,M
Trypsin
Table 1. (Continued)
Main Proteins Sub Groups Entry Name
(UniProt)
Gene Name Accession Number (UniProt)
Database (G,M) Isoform 2 of Inter alpha trypsin
inhibitor heavy chain H4
ITIH4 ITIH4 Q14624 M
Alpha 1 antitrypsin A1AT SERPINA1 P01009 G,M
Inter alpha trypsin inhibitor heavy chain H1
ITIH1 ITIH1 P19827 M
Heomopexin Hemopexin HEMO HPX P02790 M
Enolase Alpha enolase ENOA ENO1 P06733 G,M
Carbonic Anhydrase
Carbonic anhydrase 1 CAH1 CA1 P00915 G,M
Carbonic anhydrase 2 CAH2 CA2 P00918 G,M
Angiotensinogen Angiotensinogen ANGT AGT P01019 G,M
Fatty Acid Binding Protein Adipocyte Fatty acid binding protein adipocyte FABP4 FABP4 P15090 G,M
Alcohol dehydrogenase Alcohol dehydrogenase 1B ADH1B ADH1B P00325 M
Alpha 1B glycoprotein Alpha 1B glycoprotein A1BG A1BG P04217 M
Triosephosphate Isomerase Triosephosphate isomerase TPIS TPI1 P60174 G,M
Glyceraldehyde 3 Phosphate Dehydrogenase
Glyceraldehyde 3 phospate dehydrogenase
G3P GAPDH P04406 G,M
Fructose 1 6 Bisphosphatase Fructose 1 6 bisphosphatase 1 F16P1 FBP1 P09467 G,M
Fructose Bisphosphate Aldolase
Fructose bisphosphate aldolase A ALDOA ALDOA P04075 G,M
Fructose bisphosphate aldolase B ALDOB ALDOB P05062 G,M
Fructose bisphosphate aldolase C ALDOC ALDOC P09972 G,M
Peptidyl Prolyl cis trans Isomerase Peptidyl prolyl cis trans isomerase A PPIA PPIA P62937 G,M Peroxiredoxin
Peroxiredoxin 6 PRDX6 PRDX6 P30041 G,M
Peroxiredoxin 2 PRDX2 PRDX2 P32119 G,M
Peroxiredoxin 1 PRDX1 PRDX1 Q06830 G,M
Phosphatidyl ethanolamine binding protein
Phosphatidyl ethanolamine binding protein
PEBP1 PEBP1 P30086 M
Alpha 2 HS glycoprotein Alpha 2 HS glycoprotein FETUA AHSG P02765 M
Lactate Dehydrogenase
L-lactate dehydrogenase A chain LDHA LDHA P00338 G,M
L-lactate dehydrogenase B chain LDHB LDHB P07195 G,M
Glycerol 3 Phosphate Dehydrogenase Glycerol 3 phosphate dehydrogenase
GPDA GPD1 P21695 G,M
Phosphoglycerate Mutase Phosphoglycerate mutase 1 PGAM1 PGAM1 P18669 G,M
Phosphoglycerate Kinase Phosphoglycerate kinase 1 PGK1 PGK1 P00558 G,M
Glutathione S Transferase
Glutathione S transferase A1 GSTA1 GSTA1 P08263 G
Glutathione S transferase P GSTP1 GSTP1 P09211 G,M
Histone
Histone H2A type 1A H2A1A HIST1H2AA Q96QV6 G
Histone H2A type 1D H2A1D HIST1H2AD P20671 G
Histone H1 4 H14 HIST1H1E P10412 G,M
Histone H3 3 H33 H3F3A P84243 G,M
Histone H4 H4 HIST1H4A P62805 G,M
Histone H2B type 1B H2B1B HIST1H2BB P33778 G
Table 1. (Continued)
Main Proteins Sub Groups Entry Name
(UniProt)
Gene Name Accession Number (UniProt)
Database (G,M)
Antithrombin III Antithrombin III ANT3 SERPINC1 P01008 G,M
Adipose most abundant gene transcript 2 protein
Adipose most abundant gene transcript 2 protein
ADIRF ADIRF Q15847 M
Selenium Binding Protein Selenium binding protein 1 SBP1 SELENBP1 Q13228 G,M
ATP Synthase ATP synthase subunit beta
mitocondrial
ATPB ATP5B P06576 G,M
Aldo Keto Reductase Aldo keto reductase AK1C1 AKR1C1 Q04828 M
Apolipoprotein A
Apolipoprotein A I APOA1 APOA1 P02647 G,M
Apolipoprotein A II APOA2 APOA2 P02652 G
Apolipoprotein A IV APOA4 APOA4 P06727 G,M
Pyruvate Kinase Pyruvat kinase isoenzymes M1 M2 KPYM PKM P14618 G,M
Glucose 6 Phosphate Isomerase Glucose 6 phosphate isomerase G6PI GPI P06744 G,M
LMW of Kininogen Isoform LMW of Kininogen 1 KNG1 KNG1 P01042-2 G,M
Retinal Dehydrogenase Retinal dehydrogenase 1 AL1A1 ALDH1A1 P00352 G,M
Catalase Catalase CATA CAT P04040 G,M
Extracellular Superoxide Dismutase Extracellular superoxide dismutase Cu Zn
SODE SOD3 P08294 G,M
Isocitrate Dehydrogenase Isocitrate dehydrogenase NADP cytoplasmic
IDHC IDH1 O75874 G,M
Acetyl CoA Acetyl Transferase Acetyl CoA acetyl transferase mitocondrial
THIL ACAT1 P24752 G,M
3 Ketoacyl CoA Thiolase 3 ketoacyl CoA thiolase mitocondrial THIM ACAA2 P42765 G,M
Thyroxine binding globulin Thyroxine binding globulin THBG SERPINA7 P05543 M
Phospho Glucomutase Phospho glucomutase 1 PGM1 PGM1 P36871 G,M
Protein S100 A6 Protein S100 A6 S10A6 S100A6 P06703 M
Flavin Reductase Flavin reductase NADPH BLVRB BLVRB P30043 G,M
Elongation Factor Elongation factor 1 alpha 1 EF1A1 EEF1A1 P68104 G,M
Malate Dehydrogenase Malate dehydrogenase cytoplasmic MDHC MDH1 P40925 G,M
Transketolase Transketolase TKT TKT P29401 G,M
Inorganic Pyrophosphatase Inorganic pyrophosphatase IPYR PPA1 Q15181 G,M
Betaine Homocysteine S Methyl Transferase
Betaine homocysteine S Methyl Transferase 1
BHMT1 BHMT Q93088 G,M
Cytosolic Nonspecific Dipeptidase Cytosolic nonspecific dipeptidase CNDP2 CNDP2 Q96KP4 G,M
Aminoacylase Aminoacylase 1 ACY1 ACY1 Q03154 G,M
Fumaryl acetoacetase Fumaryl acetoacetase FAAA FAH P16930 G,M
Aldose Reductase Aldose reductase ALDR AKR1B1 P15121 G,M
Metallothionein 1E Metallothionein 1E MT1E MT1E P04732 M
Hydroxyacyl Coenzyme A Dehydrogenase
Hydroxyacyl coenzyme A dehydrogenase mitocondrial
HCDH HADH Q16836 M
Splicing factor 3B subunit 3 Splicing factor 3B subunit 3 SF3B3 SF3B3 Q15393 M
Adenylyl cyclase associated protein Adenylyl cyclase associated protein CAP1 CAP1 Q01518 G,M
Alpha 2 Macroglobulin alpha 2 macroglobulin A2MG A2M P01023 G,M
Ester Hydrolase Ester hydrolase C11orf54 CK054 C11orf54 Q9H0W9 M
Ferritin Ferritin heavy chain FRIH FTH1 P02794 G
NADP dependent malic enzyme NADP dependent malic enzyme MAOX ME1 P48163 M
6 Phospho Gluconate Dehydrogenase Decarboxylating 6 phospho gluconate dehydrogenase decarboxylating 6PGD PGD P52209 G,M (Continued )
Many of these proteins and peptides were derived from the cytoskeleton and extracellular structures that form the tissue integrity. A group of these proteins showed significant correla-tions with DA, CIT, recipients’ BUN and creatinine levels (Table 2) as summarized below. Therefore, we propose that these proteins might serve as potential biomarkers for renal injury prior to transplantation.
Ischemia triggers a complex series of biochemical reactions that primarily effect the cyto-skeleton [12], including the loss of cellular polarity and cytoskeletal reorganization. Thus, our finding of structural proteins in the kidney preservation solution was probably not a coinci-dence. For example, the expression and redistribution of microtubule cytoskeleton compo-nents, was observed to be induced after renal ischemia–reperfusion injury suggesting the participation of these proteins in an adaptive response to cellular lesions [13]. Likewise, another member of the cellular cytoskeleton, the actin filament network gets disrupted in ischemic kidney leading to the loss of tubule-cell polarity and redistribution of the basolateral membrane [14]. Consequently, the tight junction barrier becomes permeable [15], and cell-cell and cell-cell-substrate adhesions are lost, resulting in the detachment of tubule cell-cells from the basement membrane [12,16]. Alterations in the renal cell cytoskeleton related to ischemia may also induce apoptosis [12]. Indeed, chemically induced apoptosis is frequently preceded by the disorganization of theF-actin cytoskeleton [12,17]. Not surprisingly, the level of profilin, a major actin monomer interacting protein, was also correlated with the donors’ age and recipi-ents’ serum BUN levels. Profilins were previously shown to be up-regulated in mesangial pro-liferative glomerulonephritis [18].
We found a positive significant correlation between perlecan and recipients’ serum BUN and creatinine levels. Perlecan accumulates during glomerular and vascular tissue remodeling that characterizes chronic transplant dysfunction (CTD) in rats [19].
In our study, we found a positive correlation between CIT and talin 1 which is pivotal for the activation of integrins and links them directly to the actin cytoskeleton. These interactions are important for attaching podocytes -specialized actin-rich epithelial cells -to the glomerular basement membrane [20]. Mice lacking talin1 specifically in their podocytes display severe proteinuria, foot process effacement, and kidney failure [20]. All these findings suggest that talin 1 could indeed be a strong candidate to evaluate the viability of the kidney prior to trans-plantation. We found a positive significant correlation between keratin type II cytoskeletal 8 and recipients’ serum creatinine levels (Table 2). Keratin is expressed by renal tubular epithelia cells and it was implicated with damaged tubular epithelial cell [21].
In our study we isolated myosin 6, 9 and 11 in preservation solution and found positive cor-relation with donors’ age. Several members of myosin superfamily are synthesized in
Table 1. (Continued)
Main Proteins Sub Groups Entry Name
(UniProt)
Gene Name Accession Number (UniProt)
Database (G,M)
Plasma protease C1 inhibitor Plasma protease C1 inhibitor ICI SERPING1 P05155 M
Delta aminolevulinic acid dehydratase
Delta aminolevulinic acid dehydratase
HEM2 ALAD P13716 G,M
Cysteine and Glycine Rich Protein Cystein and glycine rich protein 1 CSRP1 CSRP1 P21291 G,M Polymerase I and Transcript Release
Factor
Polymerase I and transcript release factor
PTRF PTRF Q6NZI2 G,M
Carbonyl Reductase Carbonyl reductase NADPH1 CBR1 CBR1 P16152 G,M
Haptoglobulin Haptoglobulin HPT HP P00738 G,M
G: Glomerulus database; M: Medulla database (http://www.hkupp.org/)
Table 2. List of proteins and peptides that were isolated from kidney preservation solution which showed a statistically significant correlation with donors’ age (DA), cold ischemia time (CIT), creatinine (Cr) and blood urea nitrogen (BUN).
Protein and peptide Significant
Correlation
Correlation coefficient
P
Actin cytoplasmic 1 DA 0.551 0.022
Adenylyl cyclase associated protein 1 DA 0.506 0.038
Aldo keto reductase family 1 member C1 DA 0.676 0.030
Aldose reductase DA 0.584 0.014
Alpha 2 macroglobulin DA*, Cr†
, 0.648*,0.512†
0.005*, 0.030†
Aminoacylase 1 DA 0.506 0.038
Antithrombin III DA*, Cr†, BUN‡ 0.506*, 0.533†, 0.610‡ 0.038*, 0.023†,
0.007‡
ATP synthase subunit beta mitochondrial CIT 0.518 0.028
Basement membrane specific heparan sulfate proteoglycan core protein (Perlecan)
Cr†, BUN‡ 0.518†, 0.599‡ 0.028†, 0.009‡
Cathepsin D DA 0.634 0.006
Ceruloplasmin BUN 0.609 0.007
Collagen alpha 1 VI chain DA*, BUN‡ 0.555*, 0.488‡ 0.021*,0.040‡
Complement C2 BUN 0.580 0.012
Cytosolic non specific dipeptidase BUN 0.475 0.046
Isoform 2 of E3 ubiquitin protein ligase RNF135 BUN 0.563 0.011
Fatty acid binding protein adipocyte DA 0.622 0.008
Fructose 1 6 bisphosphatase 1 DA 0.487 0.047
Fumaryl acetoacetase BUN 0.471 0.049
Glyceraldehyde 3 phosphate dehydrogenase DA 0.519 0.033
Heat shock protein HSP 90 beta CIT 0.517 0.028
Heat shock 70 kDa protein 6 DA 0.519 0.033
Hemopexin BUN 0.471 0.049
Histone H2A type 1 A Cr†, BUN‡ 0.656†, 0.496‡ 0.03†, 0.036‡
Hydroxyacyl coenzyme A dehydrogenase mitochondrial CIT 0.487 0.40
Keratin type II cytoskeletal 8 Cr† 0.481 0.043
3 ketoacyl CoA thiolase mitochondrial DA 0.693 0.002
Malate dehydrogenase cytoplasmic DA 0.512 0.036
Microfibril associated glycoprotein 4 DA*, Cr† 0.634*, 0.502† 0.006*, 0.034†
Isoform 2 of Myosin 11 DA 0.564 0.018
Myosin 9 DA 0.497 0.042
Myosin light polypeptide 6 DA 0.638 0.006
Peptidylprolylcis trans isomerase A DA 0.485 0.048
Phosphatidyl ethanolamine binding protein 1 DA 0.502 0.040
Isoform 2 of Polyamine modulated factor 1 Cr 0.483 0.042
Profilin 1 DA*, BUN‡
0.579*, 0.602‡
0.015*, 0.008‡
Retinal dehydrogenase 1 BUN 0.496 0.036
Rho GDP dissociation inhibitor 1 CIT 0.476 0.046
Talin 1 CIT 0.437 0.022
Thyroxine binding globulin DA 0.532 0.028
*, Donors’ age †
, Creatinine ‡
, Blood urea nitrogen (BUN)
Table 3. PANTHER Overrepresentation test (release 20160715) with annotation version 11.1. Classification of identified proteins based on A) Path-ways, B) Molecular Function, C) Biological Process, D) Cellular Component and E) Protein Class.
Homo sapiens (REF) Identified Proteins
A. PANTHER Pathways # # Expected Fold Enrichment P
Glycolysis 22 10 0.18 55.75 9.85E-13
Pentose phosphate pathway 8 3 0.07 45.99 6.84E-03
Fructose galactose metabolism 12 3 0.1 30.66 2.26E-02
Cytoskeletal regulation by Rho GTPase 83 8 0.68 11.82 8.24E-05
Parkinson disease 100 9 0.82 11.04 2.80E-05
Integrin signalling pathway 192 13 1.57 8.3 1.41E-06
B. PANTHER GO-Slim Molecular Function
Antioxidant activity 30 5 0.24 20.44 9.88E-04
Peroxidase activity 27 4 0.22 18.17 1.39E-02
Serine-type endopeptidase inhibitor activity 123 13 1 12.96 7.73E-09
Peptidase inhibitor activity 161 14 1.31 10.66 1.70E-08
Structural constituent of cytoskeleton 594 27 4.84 5.57 1.09E-10
Actin binding 177 8 1.44 5.54 2.05E-02
Peptidase activity 525 18 4.28 4.2 6.54E-05
Oxidoreductase activity 629 21 5.13 4.09 1.01E-05
Structural molecule activity 927 27 7.56 3.57 1.87E-06
Catalytic activity 5090 65 41.5 1.57 7.89E-03
C. PANTHER GO-Slim Biological Process
Glycolysis 34 8 0.28 28.86 1.40E-07
Pentose-phosphate shunt 13 3 0.11 28.3 4.35E-02
Gluconeogenesis 22 4 0.18 22.3 8.73E-03
Tricarboxylic acid cycle 27 4 0.22 18.17 1.92E-02
Chromatin organization 263 20 2.14 9.33 2.16E-11
Cytokinesis 113 7 0.92 7.6 1.10E-02
Monosaccharide metabolic process 120 7 0.98 7.15 1.60E-02
Generation of precursor metabolites and energy 224 12 1.83 6.57 9.74E-05
Muscle contraction 154 8 1.26 6.37 1.08E-02
Cellular component morphogenesis 545 18 4.44 4.05 1.54E-04
Cellular component organization or biogenesis 1724 54 14.06 3.84 4.47E-16
Cellular component organization 1584 49 12.92 3.79 4.57E-14
Organelle organization 752 21 6.13 3.42 2.53E-04
D. PANTHER GO-Slim Cellular Component
Intermediate filament cytoskeleton 71 5 0.58 8.64 1.92E-02
Actin cytoskeleton 240 15 1.96 7.67 1.08E-07
Cytoskeleton 624 22 5.09 4.32 6.29E-07
Extracellular space 530 14 4.32 3.24 7.72E-03
Extracellular region 832 18 6.78 2.65 1.04E-02
Membrane 2083 3 16.98 <0.2 1.32E-03
E. PANTHER Protein Class
Complement component 14 5 0.11 43.8 2.79E-05
Histone 99 20 0.81 24.78 1.82E-19
Peroxidase 23 4 0.19 21.33 8.64E-03
Actin and actin related protein 30 5 0.24 20.44 1.14E-03
Serine protease inhibitor 122 13 0.99 13.07 8.04E-09
Protease inhibitor 241 16 1.97 8.14 4.29E-08
podocytes. They form a network and their interaction with the actin cytoskeleton is crucial for the regulation of podocyte structure and function [22]. Myosins also have tubular functions and it was shown that myosin 9a-deficient mice develop proteinuria [23]. Another protein iso-lated in our work is collagen VI, which is produced by endothelial cells. This protein was sig-nificantly correlated with DA and recipients’ BUN levels. It has been shown that, antibodies recognizing collagenα1(VI)/α5(IV) play a crucial role in the pathogenesis of transplant glo-merulopathy in rats[24]. Also, we isolated microfibril associated glycoprotein 4 from preserva-tion solupreserva-tion and the level of this protein was significantly correlated with DA and recipients’ creatinine level. To the best of our knowledge this glycoprotein has previously not been linked to renal injury.
A second important group of proteins that we isolated from the preservation solution and found positive correlation with donors’ age, CIT, recipients’ BUN and creatinine levels com-prised protective and metabolically active proteins (Table 2). These are also candidate bio-markers of kidney injury and summarized below briefly.
Aminoacylase 1 is a zinc-binding cytoplasmic protein which was shown to have its highest level of activity and expression in the kidney [25]. In renal transplant patients, serum aminoa-cylase-1 level has been used as a biomarker to evaluate the long-term outcome with delayed graft function [26]. Fructose-1,6-bisphosphatase (FBP-1) is one of the key enzymes of gluco-neogenesis in the cytosol and mainly found in proximal renal tubules. Urine FBP-1 [27,28] lev-els were found to be associated with proximal tubular damage. Similarly, alpha 2
macroglobulin [29], aldose reductase [30], antithrombin III [31], ceruloplasmin [32], comple-ments [33], hemopexin [34], histone [35] and adipocyte fatty acid binding protein [36] have all been implicated to associate with renal injury.
Renal cells demand high levels of energy due to their active energy-dependent functions such as reabsorption, secretion and filtration of many substances. Therefore, mitochondrial homeostasis is crucial for normal renal function. In our study we found significant correlation between the CIT and the levels of mitochondrial hydroxyl acyl coenzyme A dehydrogenase and ATP synthase subunit beta which suggests an increase in mitochondrial disruption with CIT. Whitaker et al. have recently shown increased urinary ATP synthase subunit beta in mice with renal injury and concluded that urinary ATP synthase subunit beta may be a novel and sensitive biomarker of renal mitochondrial dysfunction [37].
Other potential biomarkers of renal injury that were identified in our study based on their correlation with donors’ age, CIT, recipients’ serum BUN or creatinine levels are glyceralde-hyde 3-phosphate dehydrogenase, malate dehydrogenase, peptidyl prolyl cis trans isomerase, mitochondrial 3 keto acyl CoA thiolase, adenylyl cyclase associated protein, aldo keto reduc-tase, phosphatidyl ethanolamine binding protein, thyroxine binding globulin, cytosolic Table 3. (Continued)
Homo sapiens (REF) Identified Proteins
A. PANTHER Pathways # # Expected Fold Enrichment P
Lyase 151 8 1.23 6.5 7.88E-03
Actin family cytoskeletal protein 389 20 3.17 6.31 1.89E-08
Chaperone 183 9 1.49 6.03 4.61E-03
Dehydrogenase 253 12 2.06 5.82 2.86E-04
Oxidoreductase 597 22 4.87 4.52 9.60E-07
Cytoskeletal protein 778 27 6.34 4.26 5.23E-08
DNA binding protein 824 22 6.72 3.27 2.38E-04
nonspecific dipeptidase, Isoform 2 of E3 ubiquitin protein ligase RNF135, fumaryl acetoace-tase, isoform 2 of Polyamine modulated factor 1, retinal dehydrogenase 1 and Rho GDP disso-ciation inhibitor 1. Interestingly, these proteins were previously not been associated with renal injury. Therefore, it would be important to validate their potential link to renal disease in an independent experimental workflow.
During hypothermia, the metabolic rate of the kidney is depressed significantly. However, during the preservation period, some metabolic pathways are activated to protect renal tissues. In previous work, we showed that HSP levels are elevated in liver tissues placed in preservation solution prior to transplantation [38]. In the present study, several HSPs (Table 1) were detected in the preservation solution of the pre-transplanted kidney. Furthermore HSP90 beta and HSP70 protein 6 were correlated with CIT and donors’ age respectively (Table 2). HSPs are abundant intracellular proteins with functions including the regulation of protein complex formation, protein trafficking, targeting of misfolded proteins for proteasomal degradation, prevention of unfolded protein aggregation, refolding of denatured proteins, mitochondrial protein folding and assembly, and inhibition of apoptosis [39]. In the kidney, HSPs help main-tain and restore normal cellular function following ischemia-reperfusion injury [40].
Limitations of the study
This study has some limitations that should be noted. During surgery, the blood is washed out of the kidney, and the organ’s vascular system is filled with preservation solution. However, the interstitial edema that occurs during the flushing-out period increases compression of the renal capillaries, which prevents complete removal of blood from the vascular system. We therefore could not confirm that the washing procedure was sufficiently thorough to remove blood from the kidney completely, and the blood may thus have remained in the preservation solution. To avoid artifacts related to the presence of blood and its constituents, the preserva-tion solupreserva-tion samples were subjected to immunodeplepreserva-tion, which removed the most of these components. In future studies of deceased donor kidney transplantation, both immunodeple-tion and the use of a kidney proteomic database as a reference will contribute to avoiding study artifacts.
Conclusion
Taken together, in the present study we have shown that various extracellular proteins are released from the kidney to the preservation solution suggesting that the homeostasis of the extracellular matrix might be deteriorated during the preservation period. The dysregulation of extracellular matrix leads to interstitial fibrosis and cathepsin D may promote this process [41]. Currently, many transplant centers are accepting organs from older donors, even those with co-morbidities, due to the shortage of young healthy donors. Organs harvested from mar-ginal donors are more prone to delayed graft function and therefore its adverse consequences. The proteins that show a positive correlation with donors’ age, CIT, recipients’ serum BUN and creatinine levels can be useful markers to assess the marginality and viability of organs prior to transplantation. Further clinical studies are required to evaluate the use of these pro-teins as potential biomarkers prior to their implementation in clinical practice. Moreover, the development of new preservation solutions which are capable of preserving organs effectively prior to transplantation remains a critical issue in clinical transplantation practice. The protein profile detected in the present study can be used to design new pharmacological agents that stabilize the cytoskeleton of renal cells and maintain the integrity of the kidney’s extracellular tissues. These will improve both organ preservation and transplant success.
Supporting Information
S1 Table. Main Dataset. Proteins and peptides isolated from preservation solution of kidneys prior to transplantation
(XLSX)
S2 Table. Receipents test results (Biochemistry and hematology). Main biochemical and hematological test results of recipients during follow up period.
(XLSX)
Author Contributions
Conceptualization: AC IB IT CY.
Data curation: AC ATB DK MA MOS GB KK IY.
Formal analysis: AC ATB DK MA MOS GB HK KK MC IY. Funding acquisition: AC.
Investigation: AC IB IT HK MC CY. Methodology: AC ATB DK MOS KK IY. Project administration: AC.
Resources: AC. Software: ATB MOS. Supervision: AC ATB.
Validation: AC ATB DK MOS. Visualization: AC ATB HK MC. Writing – original draft: AC ATB MOS. Writing – review & editing: AC ATB.
References
1. Spiegel HU, Palmes D. Organ preservation. Hakim NS, Danovitch G, editor. Transplantation Surgery. London: Springer–Verlag Press; 2001.
2. Chatauret N, Thuillier R, Hauet T. Preservation strategies to reduce ischemic injury in kidney transplan-tation: pharmacological and genetic approaches. Curr Opin Organ Transplant. 2011; 16: 180–7. doi:10. 1097/MOT.0b013e3283446b1dPMID:21415820
3. Desai MM, Gill IS, Ramani AP, Spaliviero M, Rybicki L, Kaouk JH. The impact of warm ischaemia on renal function after laparoscopic partial nephrectomy. BJU Int. 2005; 95: 377–83. doi: 10.1111/j.1464-410X.2005.05304.xPMID:15679798
4. Hauet T, Eugene M. A new approach in organ preservation: potential role of new polymers. Kidney Int. 2008; 74: 998–1003. doi:10.1038/ki.2008.336PMID:18633345
5. http://proteomics.ucdavis.edu/protocols-2/Accessed at February 2016
6. https://www.bruker.com/fileadmin/user_upload/8-PDFDocs/Separations_MassSpectrometry/ InstructionForUse/Bruker_Guide_MALDI_Sample_Preparation_Rev2.pdf
7. Kaga E, Karademir B, Baykal AT, Ozer NK. Identification of differentially expressed proteins in athero-sclerotic aorta and effect of vitamin E. J Proteomics. 2013; 92: 260–73. doi:10.1016/j.jprot.2013.06.015 PMID:23796494
8. Tang Z, Baykal AT, Gao H, Quezada HC, Zhang H, Bereczki E, et al. mTor Is a Signaling Hub in Cell Survival: A Mass-Spectrometry-Based Proteomics Investigation. J Proteome Res. 2014; 13: 2433– 2444. doi:10.1021/pr500192gPMID:24694195
9. Baykal AT, Baykal B, Serhatli M, Adiguzel Z, Tuncer MA, Kacar O. Proteomic evidence for the plasticity of cultured vascular smooth muscle cells. Turkish J Biol. 2013; 37: 414–425.
10. Serhatli M, Baysal K, Acilan C, Tuncer E, Bekpinar S, Baykal AT. Proteomic Study of the Microdis-sected Aortic Media in Human Thoracic Aortic Aneurysms. J Proteome Res. 2014; 13: 5071–5080. doi: 10.1021/pr5006586PMID:25264617
11. http://www.hkupp.org/. Accessed at August 2016.
12. GenescàM, Sola A, Hotter G. Actin cytoskeleton derangement induces apoptosis in renal ischemia/ reperfusion. Apoptosis. 2006; 11: 563–571. doi:10.1007/s10495-006-4937-1PMID:16528472 13. Caron A, Desrosiers RR, Be´liveau R. Kidney ischemia-reperfusion regulates expression and
distribu-tion of tubulin subunits, beta-actin and rho GTPases in proximal tubules. Arch Biochem Biophys. 2004; 431: 31–46. doi:10.1016/j.abb.2004.07.009PMID:15464724
14. Molitoris BA, Dahl R, Geerdes A. Cytoskeleton disruption and apical redistribution of proximal tubule Na (+)-K(+)-ATPase during ischemia. Am J Physiol. 1992; 263: F488–95. Available:http://www.ncbi.nlm. nih.gov/pubmed/1329535PMID:1329535
15. Molitoris BA, Falk SA, Dahl RH. Ischemia-induced loss of epithelial polarity. Role of the tight junction. J Clin Invest. 1989; 84: 1334–1339. doi:10.1172/JCI114302PMID:2551926
16. Goligorsky MS, Lieberthal W, Racusen L, Simon EE. Integrin receptors in renal tubular epithelium: new insights into pathophysiology of acute renal failure. Am J Physiol. 1993; 264: F1–8. Available:http:// www.ncbi.nlm.nih.gov/pubmed/8430820PMID:8430820
17. Kruidering M, van de Water B, Zhan Y, Baelde JJ, Heer E, Mulder GJ, et al. Cisplatin effects on F-actin and matrix proteins precede renal tubular cell detachment and apoptosis in vitro. Cell Death Differ. 1998; 5: 601–14. doi:10.1038/sj.cdd.4400392PMID:10200515
18. Tamura M, Tanaka H, Hirano T, Ueta Y, Higashi K, Hirano H. Enhanced Glomerular Profilin Gene and Protein Expression in Experimental Mesangial Proliferative Glomerulonephritis. Biochem Biophys Res Commun. 1996; 222: 683–687. doi:10.1006/bbrc.1996.0804PMID:8651905
19. Rienstra H, Katta K, Celie JWAM, van Goor H, Navis G, van den Born J, et al. Differential expression of proteoglycans in tissue remodeling and lymphangiogenesis after experimental renal transplantation in rats. PLoS One. 2010; 5: e9095. doi:10.1371/journal.pone.0009095PMID:20140097
20. Tian X, Kim JJ, Monkley SM, Gotoh N, Nandez R, Soda K, et al. Podocyte-associated talin1 is critical for glomerular filtration barrier maintenance. J Clin Invest. 2014; 124: 1098–113. doi:10.1172/JCI69778 PMID:24531545
21. Gro¨ne HJ, Weber K, Gro¨ne E, Helmchen U, Osborn M. Coexpression of keratin and vimentin in dam-aged and regenerating tubular epithelia of the kidney. Am J Pathol. 1987; 129: 1–8. Available:http:// www.ncbi.nlm.nih.gov/pubmed/2444108PMID:2444108
22. Noris M, Remuzzi G. Non-muscle myosins and the podocyte. Clin Kidney J. 2012; 5: 94–101. 23. Thelen S, Abouhamed M, Ciarimboli G, Edemir B, Ba¨hler M. Rho GAP myosin IXa is a regulator of
kid-ney tubule function. Am J Physiol Renal Physiol. 2015; 309: F501–13. doi:10.1152/ajprenal.00220. 2014PMID:26136556
24. Joosten SA, van Dixhoorn MGA, Borrias MC, Benediktsson H, van Veelen PA, van Kooten C, et al. Anti-body response against perlecan and collagen types IV and VI in chronic renal allograft rejection in the rat. Am J Pathol. 2002; 160: 1301–10. doi:10.1016/S0002-9440(10)62557-6PMID:11943715 25. Yamauchi A, Ueda N, Hanafusa S, Yamashita E, Kihara M, Naito S. Tissue distribution of and species
differences in deacetylation of N-acetyl-L-cysteine and immunohistochemical localization of acylase I in the primate kidney. J Pharm Pharmacol. 2002; 54: 205–12. Available:http://www.ncbi.nlm.nih.gov/ pubmed/11848284PMID:11848284
26. Welberry Smith MP, Zougman A, Cairns DA, Wilson M, Wind T, Wood SL, et al. Serum aminoacylase-1 is a novel biomarker with potential prognostic utility for long-term outcome in patients with delayed graft function following renal transplantation. Kidney Int. 2013; 84: 1214–25. doi:10.1038/ki.2013.200PMID: 23739232
27. Pfaller W, Thorwartl U, Nevinny-Stickel M, Krall M, Schober M, Joannidis M, et al. Clinical value of fruc-tose 1,6 bisphosphatase in monitoring renal proximal tubular injury. Kidney Int Suppl. 1994; 47: S68– 75. Available:http://www.ncbi.nlm.nih.gov/pubmed/7532742PMID:7532742
28. Kepka A, Szajda SD, Zwierz K. [Fructose-1,6-bisphosphatase—marker of damage to proximal renal tubules]. Pol Merkur Lekarski. 2008; 24: 125–30. Available:http://www.ncbi.nlm.nih.gov/pubmed/ 18634268PMID:18634268
29. Nanda N, Juthani-Mehta M. Novel biomarkers for the diagnosis of urinary tract infection-a systematic review. Biomark Insights. 2009; 4: 111–21. Available:http://www.ncbi.nlm.nih.gov/pubmed/19707519 PMID:19707519
30. Gottmann U, Brinkkoetter PT, Hoeger S, Gutermann K, Coutinho ZM, Ruf T, et al. Atorvastatin donor pretreatment prevents ischemia/reperfusion injury in renal transplantation in rats: possible role for aldose-reductase inhibition. Transplantation. 2007; 84: 755–62. doi:10.1097/01.tp.0000281410.85659. 48PMID:17893609
31. Wang F, Zhang G, Lu Z, Geurts AM, Usa K, Jacob HJ, et al. Antithrombin III/SerpinC1 insufficiency exacerbates renal ischemia/reperfusion injury. Kidney Int. 2015; 88: 796–803. doi:10.1038/ki.2015.176 PMID:26108065
32. Baron P, Gugliuzza K, Rajaraman S, Thompson JC. Ceruloplasmin and deferoxamine prevent ische-mia-reperfusion damage in kidney transplantation. Ann N Y Acad Sci. 1994; 723: 401–2. Available: http://www.ncbi.nlm.nih.gov/pubmed/8030896PMID:8030896
33. Lefaucheur C. Complement activation in kidney transplantation: from risk stratification to therapeutic strategies. Clin Exp Immunol. 2014; 57–8.
34. Zager RA, Johnson ACM, Becker K. Renal cortical hemopexin accumulation in response to acute kid-ney injury. Am J Physiol Renal Physiol. 2012; 303: F1460–72. doi:10.1152/ajprenal.00426.2012PMID: 22993068
35. Zager RA, Johnson ACM. Renal ischemia-reperfusion injury upregulates histone-modifying enzyme systems and alters histone expression at proinflammatory/profibrotic genes. Am J Physiol Renal Phy-siol. 2009; 296: F1032–41. doi:10.1152/ajprenal.00061.2009PMID:19261745
36. Ebert T, Hopf LM, Wurst U, Bachmann A, Kralisch S, Lo¨ssner U, et al. Circulating adipocyte fatty acid binding protein is increased in chronic and acute renal dysfunction. Nutr Metab Cardiovasc Dis. 2014; 24: 1027–34. doi:10.1016/j.numecd.2014.03.006PMID:24813306
37. Whitaker RM, Korrapati MC, Stallons LJ, Jesinkey SR, Arthur JM, Beeson CC, et al. Urinary ATP Synthase SubunitβIs a Novel Biomarker of Renal Mitochondrial Dysfunction in Acute Kidney Injury. Toxicol Sci. 2015; 145: 108–17. doi:10.1093/toxsci/kfv038PMID:25666834
38. Gunal O, Coskun A, Aslaner A, Yildirim U. Does melatonin alleviate cold preservation injury of the liver? Turkish J Med Sci. 2010; 40: 465–470.
39. Kelly KJ. Heat shock (stress response) proteins and renal ischemia/reperfusion injury. Contrib Nephrol. 2005; 148: 86–106. doi:10.1159/000086054PMID:15912029
40. O’Neill S, Harrison EM, Ross JA, Wigmore SJ, Hughes J. Heat-shock proteins and acute ischaemic kid-ney injury. Nephron Exp Nephrol. 2014; 126: 167–74. doi:10.1159/000363323PMID:24923736 41. Fox C, Cocchiaro P, Oakley F, Howarth R, Callaghan K, Leslie J, et al. Inhibition of lysosomal protease
cathepsin D reduces renal fibrosis in murine chronic kidney disease. Sci Rep. 2016; 6: 20101. doi:10. 1038/srep20101PMID:26831567