T.C.
BAŞKENT ÜNİVERSİTESİ SOSYAL BİLİMLER ENSTİTÜSÜ
İŞLETME ANABİLİM DALI TEZLİ YÜKSEK LİSANS PROGRAMI
MACROECONOMIC FACTORS AND THE MALAWIAN EQUITY
MARKET’S RELATIONSHIP: AN ANALYSIS USING ARBITRAGE
PRICING THEORY
YÜKSEK LİSANS TEZİ
HAZIRLAYAN
OSMAN CHIGONGOLO MPEKETULA
TEZ DANIŞMANI DOÇ.DR. ÖZGE SEZGİN ALP
T.C.
BAŞKENT ÜNİVERSİTESİ SOSYAL BİLİMLER ENSTİTÜSÜ
İŞLETME ANABİLİM DALI
TEZLİ YÜKSEK LİSANS PROGRAMI
MACROECONOMIC FACTORS AND THE MALAWIAN EQUITY
MARKET’S RELATIONSHIP: AN ANALYSIS USING ARBITRAGE
PRICING THEORY
YÜKSEK LİSANS TEZİ
HAZIRLAYAN
OSMAN CHIGONGOLO MPEKETULA
TEZ DANIŞMANI DOÇ.DR. ÖZGE SEZGİN ALP
iv
DEDICATION
I dedicate this piece of work to all my loved ones and friends in Malawi as well as in Turkey for the wondrous support rendered to me during my 3 years stay in Turkey. Surely without them realising this dream would have been more difficult.
v
ACKNOWLEDGEMENT
In first place, I am indebted to Almighty God for providing me with a heathy life, protection and intellect that assisted in making this piece of writing (thesis) a reality.
I also owe sincere gratitude to Associate Professor Özge Sezgin Alp, my supervisor for her helpful comments and suggestions during the course of this thesis. Indeed her guidance deserves a recognition and I pray to God to keep on blessing her. Truly this thesis would not have materialised if it was without her support.
The staff and all my lecturers in the Department of Business Administration particularly the head of finance section Prof. Dr. Güray Küçükkocaoğlu at Başkent University also merit my appreciation for any service rendered to me in one way or the other.
Special thanks should also be extended to Presidency for Turks Abroad and Related Communities (Yurtdışı Türkler ve Akraba Topluluklar Başkanlığı) for the provision of full scholarship which enabled me to purse a Master’s Degree in Business Administration in Turkey in particular at Başkent University. In truth, their financial support deserves an immense recognition as if it was not for it this achievement would have just been a dream. Lastly during my 3 years stay in Turkey, I have made friends and these friends have supported me in some way. Whilst it is not possible to list them all, a couple of them merit a special recognition. Yusuf Mukhtar, Muhammad Fahmi, Abdullah Tinashe Kadirire, Umar Ssenkubuge, Abdul Kareem Farah, Abdul Rasheed Phiri. Actually the time I shared with you people was fantastic and I will never regret it. God bless you all.
vi
ABSTRACT
Capital markets play a central role in the countries’ economy. They act as a medium of channelling finances from surplus economic segments to the deficit ones. When there is growth in the equity markets, the entire economy is anticipated to advance. Moreover, the finance literature is rich in theoretical and empirical studies that support the notion that macroeconomic factors shape returns on capital markets. Thus this study steered by one of the financial theories in the name of Arbitrage Pricing Theory (APT) looked into the role of foreign exchange reserves, inflation and monetary policy rate on Malawi stock prices in the period January 2004-December 2018. The study adopted cointegration analysis, Vector Error Correction Model (VECM) and Granger causality so as to realise its intended purposes. The findings of this study signifies that the three mentioned macroeconomic conditions and Malawian equity prices are linked together in the long-run. Monetary policy rate holds a positive and significant long term interaction with equity returns whilst inflation exhibited a significant and a negative long-run linkage. As for foreign exchange reserve it also interacted with share indices negatively but did not possess any significance. In addition, inflation and foreign exchange reserves did not share any causal link with stock market returns. This is contrary to monetary policy rate which displayed a unidirectional causal link with equity indices running from the equity indices to monetary policy rate. The study’s outcome has two implications (i) investors should not depend on the proclamation of the three macroeconomic factors when it comes to stock market investment making decisions in Malawi. (ii) Policies to extenuate inflation should be devised by Malawian authorities for the development of the stock market.
Keywords: Macroeconomic; market; cointegration; causality; and Malawi
vii
ÖZET
Sermaye piyasaları, ülkelerin ekononmilerinde büyük bir rol oynamaktadır. Fon fazları olan ekonomik birimler ile fon eksiği olan birimler arasında aracılık ederler. Hisse senedi piyasalarında büyüme olduğunda, tüm ekonominin ilerlemesi beklenmektedir. Ayrıca, finans literatürü makroekonomik faktörlerin sermaye piyasalarındaki getirileri şekillendirdiğini destekleyen teorik ve ampirik çalışmalarla yönünden zengindir. Bu nendelerle bu çalışmada Arbitraj Fiyatlaması Teorisi çerçevesinde, Ocak 2004-Aralık 2018 döneminde Malavi hisse fiyatları üzerinde döviz rezervleri, enflasyon ve para politikası faiz oranlarının rolü incelemiştir. Çalışmada, eşbütünleşme analizi, Vektör Hata Düzeltme Modeli ve Granger nedensellik analizleri kullanılmıştır. Çalışmanın sonuçları, söz konusu üç makroekonomik değişkenin ve Malavi hisse fiyatlarının uzun vadede birbirine bağlı olduğunu göstermektedir. Para politikası oranı, hisse senedi getirileri ile pozitif ve önemli bir uzun vadeli etkileşim içerisinde iken enflasyon uzun vadeli negative bir ilişki göztermektedir. Döviz rezervine gelince, hisse senedi ile negative etkileşim göstermesine karşın anlamlı bir ilişki göstermemiştir. Buna ek olarak, enflasyon ve döviz rezervleri borsa getirileri ile anlamlı bir nedensel ilişki göstermemiştir. Hisse senedi endeksi getirisinden para politikası faizine tek yönlü bir nedensel bağlantı bulunmuştur. Çalışmanın sonucunun iki çıkarımı söz konusudur (i) Malawi’de yatırımcılar, borsa yatırım kararları konusunda bu üç makroekonomik faktörün açıklanmasına bağlı kalmamalıdır. (ii) Enflasyonu düşürücü politikaları, Malavi makamları tarafından borsa gelişimi için tasarlanmalıdır.
Anahtar Kelimeler: Makroekonomik; Market; eştümleşme; nedensellik; ve Malavi
viii TABLE OF CONTENTS DEDICATION...iv AKNOWLEDGEMENT...v ABSTRACT...vi ÖZET...vii
TABLE OF CONTENTS ...viii
LIST OF FIGURES ...x
LIST OF TABLES ...xi
ABBREVIATIONS………..………...…....xii
CHAPTER ONE: INTRODUCTION ... 1
1.1 Study background ... 1
1.2 Problem statement and study rationale ... 3
1.3 Objectives of the study ... 4
1.4 Specific objectives of the study ... 4
1.5 Research questions ... 4
1.6 Research hypothesis ... 4
1.7 Study scope ... 5
1.8 Study organisation ... 5
1.9 Limitation of the study ... 6
CHAPTER TWO: LITERATURE REVIEW ... 7
2.0 Introduction ... 7
2.1 Theoretical framework ... 7
2.1.1 Efficient Market Hypothesis (EMH) Theory ... 7
2.1.2 Financial Asset Pricing Theories ... 10
2.2 Empirical Evidence: Context of Developing and Developed Capital Markets ... 15
2.3 Selected Macro-economic Events and Equity Market Linkages ... 21
2.3.1 Inflation ... 21
2.3.2 Foreign Exchange Reserve... 22
2.3.3 Monetary Policy Rate ... 22
ix
2.4.1 Its Background ... 23
2.4.2 Performance of the Market in Other Key Indicators... 25
2.6 Trends in Macro-economic Performance in Malawi ... 30
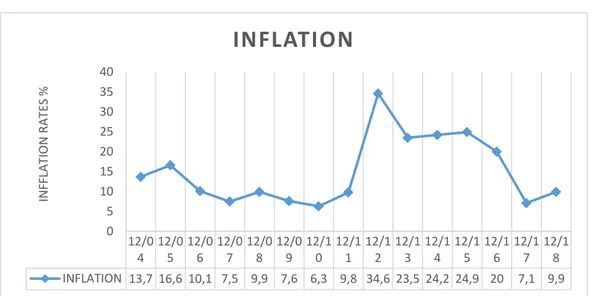
2.6.1 Inflation ... 30
2.6.2 Foreign Exchange Reserves ... 31
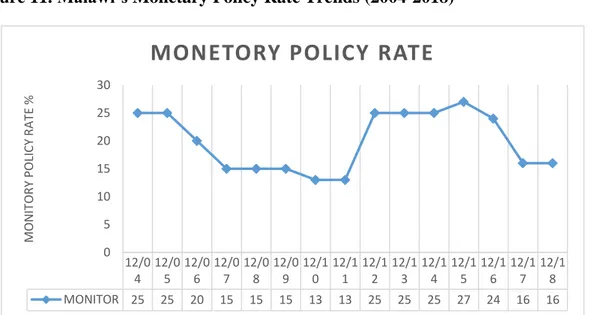
2.6.3 Monetary Policy Rate ... 32
CHAPTER THREE: STUDY METHODOLOGY ... 33
3.0 Introduction ... 33
3.1 Sources of Data ... 33
3.2 Variable Selection ... 33
3.3 Variable Description ... 34
3.3.1 Malawi All Share Index (MASI) ... 34
3.3.2 Inflation ... 34
3.3.3 Foreign Exchange Reserves ... 34
3.3.4 Monetary Policy Rate ... 35
3.4 Methodology ... 35
3.4.1 Model Details ... 35
3.5 Methodology of Analyses ... 36
3.5.1 Unit Root ... 36
3.5.2 Cointegration Test ... 36
3.5.3 Vector Auto Regressive (VAR) ... 38
3.5.4 Vector Error Correction Model VECM ... 418
3.5.5 Casaulity test ... 419
CHAPTER FOUR:RESULTS PRESENTATION AND DISCUSSIONS……….41
4.0 Introduction………..…………...41
4.1 Descriptive Statistics …….………...………..41
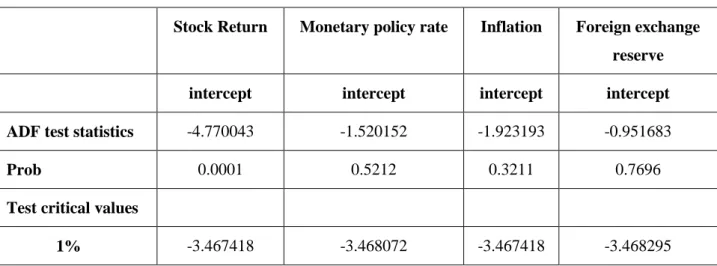
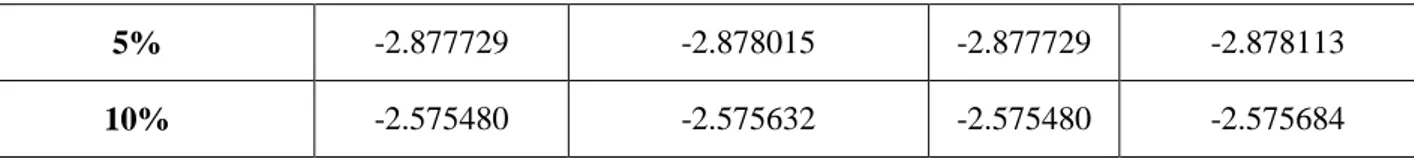
4.2 Unit Root Test Results ... 42
4.3 Variables’ long term correlation ... 43
4.4 Short run relationship test between the variable ... 455
4.5 Causal relationship test among the variables ... 46
4.6 Discussion of results ... 48
CHAPTER FIVE: FINDINGS SUMMARY, CONCLUSION AND RECOMMENDATIONS ... 51
5.0 Introduction ... 51
x
5.2 Conclusion ... 52
5.3 Recommendations ... 53
5.4 Suggestions for further research ... 53
REFERENCES ... 54
xi
LIST OF FIGURES
Figure 1: Association amid three different information sets (EMH theory) Figure 2: Market risk vs expected return (CAPM theory)
Figure 3: Changes in MASI (2004-2018)
Figure 4: MSE’s market capitalisation (2004-2018) Figure 5: MSE’s volume of share traded (2004-2018) Figure 6: MSE’s value of share traded (2004-2018) Figure 7: MSE’s Market depth (2004-2014)
Figure 8: MSE’s number of listed companies (2004-2018) Figure 9: Malawi’s Inflation trends (2004-2018)
Figure10: Malawi’s foreign exchange reserve trends (2004-2018) Figure11: Malawi’s monetary policy rate trends (2004-2018)
xii
LIST OF TABLES Table 1: Malawi capital market indicators
Table 2: Descriptive statistics
Table 3: ADF stationery test results of variables at levels
Table 4: ADF stationary test results of variables at first differences Table 5: Suitable lag length determination
Table 6: Cointegration results (trace test)
Table 7: Cointegration results (Maximum Eigenvalue test) Table 8: Normalized cointegrating coefficients
Table 9: VECM Estimates for Malawi security market table Table 10: Causality link test
xiii
ABBREVIATIONS
AIC: Akaike Information Criterion ADF-Augmented Dickey Fuller APT-Arbitrage Pricing Theory ASE-Amman Stock Exchange CA-Companies Act
CAB-Current Account Balance CAPM-Capital Asset Pricing Model CPI-Consumer Price Index
FDI-Foreign Direct Investment FPE-Final Prediction Error FRF-Federal Reserve Funds FSA-Financial Services Act GDP-Gross Domestic Product EMH-Efficient Market Hypothesis HC-Hannan-Quinn Criterion IPI-Industrial Production Index ISE-Istanbul Stock Exchange
KLCI-Kuala Lumpur Composite Index MASI-Malawi All Share Index
MC-Market Capitalisation MSE-Malawi Stock Exchange M1- Narrow Money Supply M2-Broad Money Supply TBR-Treasury Bill Rate UK: United Kingdom
US-United States of America SA-Securities Act
xiv SIC-Bayesian Criterion of Gideon Schwarz VAR-Vector Auto Regressive
VECM-Vector Error Correction Model WPI-World Price Index
CPS-Credit to Private Sector
1
CHAPTER ONE: INTRODUCTION
1.1 Study Background
Malawi with 18.62 million inhabitants as of 2018 is a landlocked nation in southeast Africa and shares border with countries like Zambia, Mozambique and Tanzania and is amidst the world's poorest countries. Its economy is profoundly reliant on agribusiness and bulk of population lives in country region (National Statistical Office, 2018). As a way of diversifying its economy, the authorities in 1994 felt the need for stimulating private sector growth through establishment of a stock exchange. This stock exchange provided a framework that accorded firms the opportunity to set up capital in addition to offerings Malawians a conducive environment for the participation in wealth creation through investing in stocks and debt securities (Chuka, 2016).
The relevance of capital markets to the economic upbeat of states has been discussed on by enormous authors. Leigh (1997) put it that by linking borrowers and lenders, stock market is very significant in building the neoteric economy. A high performing stock market might contribute to the growth of economy through promoting savings and allowing for a more effective way of resource allotment. Mahmoud, Sara and Khaled (2016) also said that aggressive changes in the price of stocks can harm the country’s economy because a stock is one of the fiscal assets which is very sensitive to the nation’s economic well-being. This is why in finance domain, there has been a lot of debate pertaining to the macro-economic conditions and security markets linkage in the past few decades. Mishkin (2013) also views investment in stock as something of greater importance to any economy and a crucial element as far as making business decisions is concerned. For instance, as part of financing investment spending in companies, determination of the amount of money that can be set up by issuing out new stocks depends on share prices.
The available literature tells us that numerous theories exist explaining real economic activity and equity markets’ connection. These theories include Capital Asset Pricing Model (CAPM) and Arbitrage pricing theory (APT). According to Semmler (2006) they exhibit existing dynamic relations of economic conditions with stock market behaviour. In the last 30 years, empirical studies pertaining to share prices and
macro-2
economic indicators’ nexus have been done. The first studies in this setting are that of Fama (1981, 1990), Geske and Roll (1983), and Chen, Roll, and Ross (1986) who focused on developed countries like United Kingdom (UK), U.S, Japan, and Germany. These studies differed with regard to the hypotheses formulated and the methods utilised. For US as an example, it was observed that share prices was connected to changes in IDI, risk premium, interest rate and among others. Mireku, Sarkodie and Poku (2013) also applying the same methodologies, found the same results for US.
Due to macro-economic variables possessing substantial influence on stock returns, Flannery and Protopapadakis (2002) advised investors to focus on macro-economic indicators whenever examining stocks. However, it should be noted that early studies by King (1966) revealed that macro-economic factors shape stock prices by up to the average of 50%, an indication that the other 50% is assigned to non-economic variables. Whilst investigating factors that determines stock prices Osisanwo and Atanda (2012) also found out that inflation, interest rates, exchange rate, GDP and money supply are some of the equity returns’ key influencers. Thus to investors as well as policy makers, conducting research on how macro-economic fundamentals and share prices relate is of paramount significance. Nkechukwu, Onyeagba and Okoh (2013) put forward that proper information with regards to macro-economic conditions and share indices linkage is very critical as it guarantees that only meaningful policy indicators are utilised in designing intervention policies in areas of high precedence in the economy like stock exchange market. As for the investors, a good understanding of macro-economic indicators’ behaviour towards capital markets aid them in making informed investment decisions (Gyau, 2015).
Despite the existence of extensive studies worldwide on share prices and macro-economic events’ nexus, debate concerning this topic is yet to be resolved. Differences in data, method and tools of analysis, and variables used all shape the results of a study. Accordingly, there is also no consensus with regards to the issue of capital market returns and macroeconomic activities causality (Nkechukwu et al, 2013). These circumstances have been the principal motivation for undertaking this current study as it seeks to exhibit the existing equity returns and macro-economic indicators’ linkage on Malawian economy under the Arbitrage Pricing Theory’s framework.
3 1.2 Problem Statement and Study Rationale
In general, stock markets are of paramount importance as they influence economic growth through liquidity enhancement and provision of assets in form of money for industrialization and economic improvements. In addition, they function as important investment spheres (Forson and Janrattanagul, 2013). Much research has been carried out in the advanced markets like Australia, France, US, Belgium and UK and developing world such as Nigeria, India, Turkey and Russia concerning macro-economic events and share indices nexus.
In the US, using S&P 500 Index and applying APT technique, Hashemzadeh and Taylor (2007) investigated the association and direction of causality amid interest rate, money supply and stock return. Their results indicated that equity returns in the US shares a bi-directional causality with money supply. As for the interest rate the outcome was inconclusive. In the UK too, Günsel and Çukur (2007) also relied on APT and looked into the influences macro-economic fundamentals have on London equity market. In their findings they learnt that macro-economic conditions shape UK’s share prices significantly. On emerging markets font as well, the linkage between Nigerian capital market and macro-economic environments was analysed by Osinubi (1998) and found that growth correlated positively with stock market development indictors.
Despite this, in Malawi very little work has been done to ascertain the relationship that capital markets share with macro-economic activities. According to the literature reviewed so far, only one study has been undertaken on Malawian economy and it focused on only interests rates and exchange rates (Makatchaya, 2014).Yet a further look at the literature it is clear that factors such as level of foreign exchange reserves, monetary policy rate , unemployment, IDI, money supply, levels of taxation, inflation, GDP and many more are expected to determine stock market returns (Sohail and Hussain , 2009; Uwubanmwen and obayagbona , 2012; Jareño and Negrut ,2016;and Gan et al ,2006).
It is for this gap that the present study shall be carried out and will look into the influence that other important macro-economic events namely monetary policy rate, inflation and foreign exchange reserves have on Malawi’s capital market using Arbitrage Pricing theory. The conclusions that this study shall draw, without doubt shall be of service to Malawi macro-economic policy makers, investors and other stakeholders. To the
4
investors it is believed that thorough knowledge of macro-economic variables’ behaviour towards security markets, will be of great benefit to them when it comes to making informed decisions pertaining to capital markets investment. As for the policy makers, they will be capable of coming up with appropriate policy interventions with regards to stock market exchange (Adu, 2012). In addition the study shall enrich the existing body of literature on the macro-economic indicators linkage with share prices especially in an emerging market’s context like Malawi.
1.3 Objectives of the Study
The main study’s purpose is to examine macro-economic variables’ influence on Malawi’s share prices.
1.4 Specific Objectives of the Study
1. To investigate whether Malawi equity market is shaped by the chosen macro-economic indicators.
2. To establish whether Malawi equity market and the chosen macro-economic events share long-term and short-run linkage
3. To establish whether Malawi equity market and the chosen macro-economic environments holds a causal association.
1.5 Research Questions
1. Do the chosen macro-economic events influences equity market in Malawi?
2. Do the Malawi’s equity market share a long-term or short term linkage with the chosen macro-economic environments?
3. If the equity market possess a causal link with macro-economic factors, in what direction does this exist in Malawi?
1.6 Research Hypothesis
Under this research, the following represent 3 main hypotheses that will be tested under the APT framework so that to realise the key study aims and specific objectives:
5
H01: Malawi’s macro-economic environments i.e. foreign exchange reserves, inflation and monetary policy rate statistically do not possess significant influence on equity market.
H02: Malawi equity market do not hold any co-integration relation with macro-economic indicators i.e. monetary policy rate, inflation and foreign exchange reserves
H03: Malawi equity market do not share any bidirectional or unidirectional causality with macro-economic events i.e. foreign exchange reserves, inflation and monetary policy rate.
1.7 Study Scope
This analysis centres on a technique which Economists Ross invented in 1976 called APT and utilises monthly Malawi share indices from 2004-2018.The economic conditions taken into account include inflation, Monitory policy rate and foreign Exchange reserves. Literature review and data accessibility issues contributed to the selection of these variables as well as the focus period (2004-2018). The Malawi all share index represents stock market performance in the study.
1.8 Study Organisation
There are 5 chapters that make up this study. The first chapter is the introduction part constituting the study background, problem statement and study rationale, objectives, research questions guiding the study, study hypothesises, scope of the study, its organisation and limitations. Theoretical and empirical literature review on macro-economic factors and share prices’ nexus and Malawi stock exchange’s background and performance forms the second chapter. Chapter three centres on sources of data, variable selection and description, and methodology used. Study analysis and findings are presented in Chapter four and finally in chapter five concluding words and recommendations are provided.
6 1.9 Limitation of the Study
The APT sees numerous macro-economic events to possess power in explaining stock market returns. In this research however owing to data accessibility challenges, only foreign exchange reserves, inflation and monetary policy rate have been considered. Macro-economic indicators like GDP, balance of trade and many more are also conceived to determine stock market returns. Nevertheless, their exclusion from this study does not render it void in any case.
7
CHAPTER TWO: LITERATURE REVIEW
2.0 Introduction
In both developing and developed countries several studies have been undertaken and through these efforts it has been evidenced that a number of financial and macro-economic conditions affect stock prices. Reviewing literature, both empirical and theoretical is of paramount importance as it helps the researcher to have knowledge on studies already done in the subject of interest and on which theories form the basis of such studies. Moreover, in the current study’s context it will also aid in figuring out the macro-economic forces that are capable of moulding equity returns (Saeed and Akhter, 2012). In this chapter therefore, the literature on the theoretical aspect of the current study has been reviewed. This has been succeeded by an empirical review which revolves around studies undertaken on different parts of the world pertaining to the subject matter and a background overview and performance of Malawi’s capital market. On the other hand, Efficient Market Hypothesis (EMH) theory and asset pricing models of CAPM and APT constitutes the theoretical literature review of this study. The review of these models in addition to providing background framework of the current study it also helped in justifying why the current study favours APT technique over alternatives.
2.1 Theoretical Framework
2.1.1 Efficient Market Hypothesis (EMH) Theory
Efficient Market Hypothesis (EMH) ideas were invented by Fama in 1970 an economist born in America. His chief notion is that when investing in securities, abnormal profits cannot be realised on the grounds that all information which make one obtain such profits is already incorporated in the security’s price, no matter whatever approach an individual may take or rely on .Fama (1970) cognizing that investors have various ways or channels with respect to acquiring information pertaining to share prices graded market efficiency into these three levels contingent on degree of information that the market utilises: weak, semi-strong and strong form
8
Under the weak form of EMH it is argued that investors should not bank on securities’ past information when it comes to investing in equity market. This information includes past security prices, dividends and among others. It is conceived that such elements are already reflected in the equity price hence they cannot be an indicant of stock prices in the future. This theory is in full support of random walk concept as it suggests that changes in security prices happen at random thence one cannot predict them (Sahu, 2015).
In the semi-strong EMH it is conceived that all publically available information is manifested in the equity price. Therefore, no any investor will possess a competitive advantage except when private information from an inside source of the firm comes into play. By public information it entails not only previous asset prices but also everything in relation to firms’ financial and annual reports, people’s anticipation pertaining to macroeconomic conditions’ movements like GDP and money supply, announcements made by companies and among others (Hillier et al, 2010).
On the other hand, it is reasoned in strong form of EMH that the market cannot be conquered by an investor because the price of the shares incorporates all information ranging from historical prices, public as well as private information. Private information may refer to firm’s internal reports and some issues which are yet to be made widely known to the public by the respective business entity (Hillier et al, 2010).
Diagrammatically this theory can be represented as exhibited in figure 1 below and in summary the theory argues that no one can predict capital market returns irrespective of the method employed. It is believed that investors in the capital markets are all beforehand well cognizant of all macroeconomic condition changes in which the influence of these changes are absorbed in the prices of assets or stocks. Thus all the motions with regards to macroeconomic events in their entirety are incorporated in the current share returns to the extent that the person investing will not succeed in reaping abnormal returns via forecasting of future capital market’s prices shift.
While the theory may have some practical and positive implications in the domains of investment decisions, it should be noted however that the finance literature holds uncountable number of evidences which are in discrepant with this reasoning and thus in full support of asset pricing notions that demonstrate that shifts in macroeconomic environments surely moulds returns on equity markets (Sahu, 2015). These include studies
9
by Paul and Mallik (2003), Gan et al (2006), Masuduzzaman (2012), Muthike and Sakwa (2012, Nkechukwu, Onyeagba and Okoh (2013), AL-Majali and Al-Masaf (2014), Ahmed, Islam and Khan (2015), Ali et al (2016), Barakat and Hanafy (2016) and so many others. In addition, the study by Makatchaya (2014) proved that even Malawi’s Capital market is sensitive to shocks from some of the country’s economic indicators like foreign exchange rates. Moreover, as observed by Timmermann and Granger (2004) the theory empirically is mostly tested in its two spheres, the weak and semi-strong form. This is due to the fact that partially it is not easy to appraise it in its strong form.
Figure1. Association Amid Three Different Information Sets (EMH theory)
Source: Hillier et al (2010)
2.1.2 Financial Asset Pricing Theories
Pricing theories attempt to explain the reasons for the differences in financial securities’ anticipated returns. They explicate why anticipated returns are higher in some financial securities and are in low in the others and also why the anticipated returns changes and differ with time. In financial cycles various financial asset pricing theories have been developed each with its own assumptions. CAPM and APT are among the most used financial asset pricing theories (Adu, 2012).
Weak form:all past
prices and returns
Semi-strong:all public
information
Strong form:all information
including public and private
10
2.1.2.1 Capital Asset Pricing Model (CAPM)
Sharpe and Lintner are two scholars who introduced this tool called CAPM in 1964 and 1965 respectively. The idea of this technique was premised on the Harry Markowitz 1959‘s work who introduced the “Mean-Variance Portfolio Optimization Model”. It is a technique which still has relevancy in today’s market as it is widely utilised in various arenas such as figuring out companies’ cost of capital and assessing business portfolios performance. It is an instrument that is also used in forecasting returns or income that investors will get upon investing in certain organisation’s assets (Rossi, 2016).
The CAPM explicates the relationship between assets returns and their risks and it stresses that when an individual is investing in security markets he or she is susceptible to risks which are systematic and non-systematic. These two refer to risks that an investor cannot avoid them irrespective of the market or sector and risks peculiar to individual stocks in which an investor can eliminate them through diversification, increasing portfolios number of stocks or shifting to other markets or economic sectors respectively (Elbannan, 2015; Oseni and Olanrewaju, 2017).
The gist of this model is that in the market place those risks that cannot be diversified away are not rewarded and it is only non-diversified risks that matters in total risk of an investment. ß is used in systematic risk projection and it demonstrates stock’s price sensitiveness to market price. Sensitivities degree is not the same for all securities and it varies from one security to another (Elbannan, 2015). Volatility in some securities is higher than the other. In the context that a rise in the stock markets is encountered, these securities increase in value more quickly compared to the market and every time that the stock market goes down, they rapidly move downward and further. Under CAPM model it is also stipulated that assets’ expected returns do vary owing to differences in ß and larger figures for ß (market sensitivity) in a security signifies more returns in that security ( Anghel and Paschia, 2013).
11 Figure 2. Market Risk vs Expected Return Expected return
Security market line
Systematic risk or beta Source: Sharpe (1964)
The graph above displays the estimated expected return and beta’s relations. What is implied is that in an investment, systematic risk holds a linear association with expected return and this linkage is given by the following equation:
E ) = + (E ( ) - ) ………(1) In which;
E ) is ith investment’s anticipated return, is risk free rate’s return,
is ith security beta value and E ( ) is equity market’s mean return.
The assumptions underneath shape CAPM technique are:
1. Investment in securities is a single period transaction and investors maximise their utility wealth by basing selection of securities on mean and variance of returns,
2. Borrowing or lending of funds occurs at a risk-free interest rate,
3. Investors have indistinguishable personal judgement with respect to securities’ mean, variance and covariance,
12
4. In the financial securities market investors are price takers due to perfect competition,
5. The securities quantity is unchangeable, meaning its fixed and
6. There are no substantial transaction costs and taxes while marketing the securities (Naylor and Tapon, 1982; Elbannan, 2015).
However, several authors such as Hawaldar (2011) and Rossi (2016) criticised the CAPM model as its both assumptions and predictions are unrealistic in the real word. Fama and French (2004) also despite praising the model for offering background knowledge of portfolio theory and asset pricing and its simplicity in its application he warned students against its use on account of its empirical ills. Hawaldar (2011) also asserted that a great deal of empirical studies has been undertaken in which CAPM was not capable of explicating the connection between risk and return. Nevertheless, as Elbannan (2015) put it, the Model still remains one of the most utile and much used theories in ascertaining the anticipated financial security’s return.
2.1.2.1 Arbitrage Pricing Theory (APT)
Osei (2001) attests that even though CAPM holds that uncertainty about the future price of a financial asset should be the only worry to investors in stock market, concerns with regards to other risks that influence the investors’ future ability to utilise goods and services resulted into researchers focusing on the stock returns relationship to economic conditions. As an instance, there was uncertainness with respect to macro-economic environments which besides market risk are all sources of risk such as future labour income, GDP, inflation and interest rates. While cognizing this problem, Merton (1973) broadened the CAPM to multifactor from single factor.
Thence APT is normally viewed as an expansion of CAPM that is from one to a multi-factor tool. APT due to its simplicity in its assumptions and ability to retain its general applicability characters is more favoured than conventional CAPM. In addition, its good performance in empirical sense is a major driving force for its use by empirical researchers in finance arenas (Adu, 2012).
Owing to the fact that the majority of African markets including that of Malawi are developing ones they are not free from both internal and external shocks hence the returns of such markets are more likely to be affected by macro-economic factors. Thus test
13
pertaining to macro-economic indicators and equity market‘s nexus be carried out in the interest of macro-economic policy makers, investors, academia and other stakeholders under the theoretical account of APT (Adu, 2012).
APT is a stock evaluation tool developed in 1976 by the economist Stephen Ross. It stipulates that the present price of an investment is approximately up to total future incomes’ (cash flows) current value to the investment whereby in the event that some economic fundamentals has affected these cash flows and expected financial security’s return, the value or price of that investment will be affected too. Amid the macro-economic factors and share prices, the technique also stressed the availability of a long term linkage (Nkechukwu, Onyeagba and Okoh, 2013).
Asset pricing explicates how financial assets prices are estimated, why those prices increase or decrease, and additionally how the prices are connected to the underlying macro-economic indicators. APT model is a general theory that has emerged to be exceptionally important in the evaluation of share returns. APT technique considers a number of factors and every one of the investors trusts the earnings from the assets invested to be in line with factors structure (Uwubanmwen and Obayagbona, 2012).
APT stresses that a financial asset’s required return is modelled as a diverse macro-economic indicators’ linear affair in which asset’s sensitivity to each of the factor’s movement is represented by ß (beta) specific to that factor. It further contends that financial assets are rightly priced by its deduced rate of return and in the context that divergence in the price exists, it will be brought back to line through arbitrage (Uwubanmwen and Obayagbona, 2012). APT model is expressed as follows:
E ( ) = + + R + R +. ..+ R ………(2) Where,
E ( ) is ith risky asset’s expected returns, is the risk-free rate,
is the sensitivity of the asset to factor n and
14
APT operates also under some fundamental assumptions. As CAPM presumes that investors hold efficient portfolios, APT does not support this idea. It is built on the following three key assumptions:
1. Security returns are defined by systematic factors,
2. Investors can hold a portfolio of assets in which specific risk can be avoided through diversification and
3. In a well-diversified portfolio, no any arbitrage opportunities are present. In the event that they exist, investors will exploit them away (It is in this way the APT theory acquired its title) (Uwubanmwen and Obayagbona, 2012). Fama (1970) put it that, generally, equity returns are moulded by shifts in exchange rate; inflation; GDP; money supply and interest rates. Muthike and Sakwa (2012) also expressed that money supply, political risk, real economic activity, good and services prices, interest rates, exchange rate, unemployment or employment, regional retail sales, export earning, broadband internet penetration, regional stock market indices and bankruptcies are among the variables affecting stock prices.
However, with respect to which factors to consider in the analysis, APT model does not offer any direction and it is contingent on researcher’s choices or desires (Uwubanmwen and Obayagbona, 2012). This characteristic of the model is viewed as both a strength and a weakness. This is owing to the fact that it offers an empirical challenge to a researcher in the context of determining the number of variables to be included in his or her study and in identifying the diverse economic hypothesises that supports the selection of each factor. At the same time the researcher is accorded freedom with regards to choice of macro-economic indicators to be used in his or her study. That is to say, one is able to choose indicators that are special to the economy under scrutiny (Opfer and Bessler, 2004). In addition, in comparison terms APT surpasses CAPM with respect to macro-economic fundamentals and capital market prices’ explanatory power (Groenewold and Fraser, 1997). It is therefore on account of such advantages that to achieve the current study’s objectives the ideas of this theory (APT) shall be embraced over traditional CAPM.
2.2 Empirical Evidence: Context of Developing and Developed Capital Markets
In South Africa, Ali et al (2016) applying APT theory looked into macro-economic conditions and share indices’ long term linkage. Indicators such as exchange rates, IPI,
15
inflation and money supply were taken into account. In their analysis they revealed that IPI is the most Significant indicator that shapes capital market returns in South Africa unlike inflation, money supply and exchange rates. They also found that in the long term, stock index and money supply, IPI, inflation and exchange rate share a cointegration relation.
Uwubanmwen and Obayagbona (2012) also worked on Nigeria’s macro-economic environments’ relations with capital market prices. The factors they took into account included money supply, IPI, exchange rates and oil price. The authors also relied on APT to determine fundamental factors moulding share indices and the VECM model so as to capture the Nigerian’s share indices causal connection with macro-economic environments. With the aid of quarterly data for 1985 to 2009 duration it was noted that oil prices as well as money supply are imperative within the context of share returns stimulation and that an upward change in share prices also led to an improvement in IPI. However, in the short run, Nigeria’s share indices was linked in a negative way with money supply whereas exchange rate whether in short or long term was not a significant factor.
Barakat and Hanafy (2016) also tried to understand macro-economic indicators’ interaction with equity markets in countries like Tunisia and Egypt. With the help of 1998 to 2014 monthly economic data, they found out that economic forces like exchange rate, CPI, money supply as well as interest rate shared a causal link with share indices in the emerging market of Egypt. The situation with Tunisia was not the same as amongst these macro-economic events the CPI element did not exhibit any causal relationship with the equity market. In both nations it was also learnt that co-integration existed with the stock market in all the four economic indicators.
For Turkey, Alp et al (2016) using APT technique also estimated Turkish equity prices for the 2000-2012 duration. The three researchers selected exchange rates, inflation, interest rates, oil prices including GDP and tested their influence on BIST100. Co-integration tests and VECM analysis was undertaken hence their findings suggested that significant macro-economic forces have long-run effect in shaping stock prices and their significance differed depending on sectors.
For US, Jareño and Negrut (2016) also employed some important macro-economic forces like CPI, unemployment levels, GDP, interest rates and IPI and analysed their connection with stock index. In line with previous findings, their study revealed that all the
16
macro-economic environments with the exception of CPI hold a statistically significant correlation with the US equity prices.
Megaravalli and Sampagnaro (2018) also analysed influences of macro-economic conditions such as exchange rates and inflation trends on the capital market’s development of emerging economies in this case China and India and developed ones in the name of Japan. In their study they trusted monthly macro-economic data for the 3 Asian territories that covered January 2008 to November 2016. The results indicated that inflation failed a significant test in the long term and its influences on the share indices of all three states is not positive. This is contrary to exchange rate which in the long term with capital markets forms a non-negative and non-insignificant connection. In addition, amid the preferred macro-economic factors and equity market, the study also found that in the short term statistical significant association did not exist.
Maysami et al (2004) also tried to test Singapore’s equity market index; hotel, finance and property index; and the chosen macro-economic indicators long run linkage. In this study it was shown that property index and country’s share market possess a cointegration relation and this was accompanied by changes in goods prices, interest rates, IPI, money supply and exchange rates.
For Germany and United Kingdom stock markets, Masuduzzaman (2012) also applied co-integration and VECM techniques on CPI, exchange rates, money supply, IPI and interest rates. The results demonstrated that these five economic drivers are co-integrated with the UK and German stock returns. Amid the two countries’ share returns and the chosen economic indicators, a causal relationship was also observed in both short and long term. In this research macro-economic data for two countries from February 1999 to January 2011 were considered.
Gan et al (2006) conducted an analysis on the interactions of the following macro-economic environments: Inflation rate, interest rates (both short and long term), GDP, exchange rates, oil prices and money supply with New Zealand capital market. Employing the Johansen Maximum Likelihood and Granger-causality tests, it was exhibited that interest rate, real GDP and money supply are the main drivers of share price changes in New Zealand and the authors found no evidence with regards to country’s share index being a leader in bringing changes to macro-economic indicators.
17
For both India and Bangladesh, Nisha (2015) made some efforts to analyse macro-economic forces of the two countries and price of shares’ linkage. In her analysis she engaged OLS and VAR techniques so as to achieve her target. Money supply, IPI, exchange rates, gold prices, WPI, interest rates and CPI were the considered macro-economic forces in her study. In the end she found out that in Bangladesh, money supply, IPI, interest rate, exchange rate and gold price are the chief determinants of equity market returns. This is in contrast to interest rate, gold price, money supply and exchange rate with regards to Indian market. As for the world price index, she noted that it owns a big influence on India’s market returns and is insignificant for Bangladesh.
To find out whether CPS, WAIR on Time Deposit, Real GDP and CPI influence the Jordan’s Amman Stock Exchange (ASE) performance, AL-Majali and Al-Masaf (2014) used APT theory with quarterly data from 1992 to 2014, cointegration test, VECM and among others. In this investigation it was revealed that Jordan‘s ASE exhibited a long term equilibrium interaction with key macro-economic fundamentals. Furthermore, a bi-directional correlation in the long term also prevails amid equity returns and CPI, CPS and WAIR on time deposit. Their findings also meant that upward changes in WAIR in the banking sector exert a larger influence on country’s share index compared to other macro-economic forces.
In Malaysia, utilising methodologies such as ADF test, cointegration analysis and VECM, a study by Thaker et al (2009) looked into whether in the long or short term Malaysia’s KLC index and macro-economic forces share causal association. The results showed that market share index and macro-economic conditions such as inflation, nominal effective exchange rate and money supply possess a cointegration relation. The same study provided evidence that these three events got a significant influence on Kuala Lumpur Composite Index
In Pakistan it is also documented that CPI exhibit an influence on share prices but in a negative way, whereas in the long term, forces like money supply, IPI and exchange rates exert a significant and positive influence on equity prices. Monthly data with respect to the country’s macro-economic events for 2002 December to 2008 June was employed in this analysis (Sohail and Hussain, 2009).
Applying Ghana’s monthly macro-economic data for the years 1995 to 2010 and APT technique with VECM tool, Issahaku et al (2013) established macro-economic
18
indicators’ long and short-run nexus with capita market indices in Ghana. As a means of capturing macro-economic forces causal link with share returns, causality tests was also run. Their results demonstrated that inflation, FDI and money supply hold a significant long-term relation with equity prices. Macro-economic variables namely inflation, money supply and interest rates also ensured a significant short-term correlation with equity market. A pattern of causality flowing from inflation as well as exchange rate to equity indices and from equity indices to money supply, FDI and interest rates was also discovered.
Paul and Mallik (2003) also had to investigate the Australia’s banking and finance sectors’ price of shares and economic factors relations. Relying on quarterly macro-economic data for 1980-1999-time period, they conducted cointegration tests and VECM and noted that bank and finance share prices were linked in the long term with macro-economic events in the name of inflation, GDP and interest rate. In Australia according to this study, the three macro-economic fundamentals possess a cointegration relation with the bank and finance stock returns. Interest rate in a negative way determines equity returns in contrast to GDP which exerts a positive effect. And Inflation did not significantly influence capital market indices.
In Thailand, Forson and Janrattanagul (2013) employed monthly data from January 1990- December 2009 to study Thai stock Index (SETI)’s linkage with economic fundamentals like money supply, interest rate, IPI and the CPI. In their analysis they discovered that macro-economic events and prices on the capital market co-integrates and exhibit signs of a significant equilibrium long term linkage. Money supply demonstrated a strong and positive correlation in the long run. This is in contrast to CPI and the IPI index which showed an inverse relation with the nation’s stock market returns.
Manike (2006) also evaluated how Sri Lanka’s capital market interacted in the short term with economic indicators. This author relied on the country’s 1991-2002 data in monthly form and took into account events like interest rates, M2 and inflation in his study. Assigning regression Model at a multiple scale he learnt that macroeconomic conditions indeed moulded the country’s equity business. Inflation trends and shifts in interest rates correlated negatively with equity indices and this was invariance with M2 which increased as returns also increased in this market and vice versa
19
For Stockholm SE in Sweden, Talla (2013) assessed how this capital market behaved with respect to macroeconomic indicators’ change. In his research the author trusted CPI, exchange rates, M2 and interest rates. With data on monthly frequency for the years 1993 to 2012 he applied all relevant econometric models and exhibited that inflation significantly linked with equity indices but in an inverse way. Direction of this relationship conformed to that of interest rate only that interest rate lacked significance. As for M2 it positively interacted with share returns however it did not also possess any significance. On the other hand, causality results only established that inflation could be predicted by equity returns in Sweden and the reserve did not apply.
By running a VAR technique involving 6 variables, Abugri (2008) studied the nexus between capital markets and macroeconomic trends of four states in Latin America. The author revolved around interest rates, IPI, M2 and exchange rates with regards to economic indicators. After a carefully analysis of his results it was noted that the adopted economic conditions indeed shaped equity indices in all those four nations.
In Thailand again, the inter-link between economy and variables like oil prices, IPI, exchange rates and M2 was researched on. Following a meaningful analysis, it was exhibited that M2 boosts economy through moulding returns on capital market in a positive way. This was at odds with other variables (IPI, exchange rates and oil prices) as they displayed a negative reaction towards share indices (Brahmasrene and Jiranyakul, 2007)
Making use of 1984-1993 monthly data in Singapore the macroeconomic events and equity market growth’s link was also checked. Exchange rates, M2, foreign exchange reserve and M1 were the preferred economic forces. The outcome of this effort revealed that in the long-term both M2 and M1 including foreign exchange reserves interact with equity prices. This contradicted with exchange rate which lacked any influence on the same market (Mukherjee and Yu, 1997).
Another study was also undertaken in Nigeria. Nine macroeconomic forces were preferred and their relations with average equity price of 17 stock markets in the country was tested using 1986-2007 economic data. In this analysis it was evidenced that in the long term economic conditions and average equity return’s linkage was ensured. However, in the same study no causality link was registered from the equity prices to the study’s nine
20
economic indicators and it was only interest rates which was found fit to predict capital market returns (Asaolu and Ognumuyiwa, 2011).
The interactions of GDP, interest rate, CAB and exchange rate with Turkey’s Istanbul SE has also been analysed while utilising data which has been arranged on quarterly grounds in the 1991-2006 period. Relying on cointegration analysis too, it was exhibited that the above mentioned economic environments shared a long-term linkage with equity returns. GDP, CAB and exchange rate were seen to granger cause ISE contrary to interest rate which was granger caused by ISE (Acikalin et al , 2008).
Mutuku (2015) also looked at four economic events’s interaction with Kenya’s capital market. Making use of cointegration and VECM techniques he discovered that the nation’s equity market and the macroeconomic indicators ensured a long term linkage and on quarterly bases about 3.8 % of diversions from this connection are rectified. Inflation also shaped the returns on this market negatively.
In Japan too Asai and Shiba (1995) studied how variables like interest rate, IPI and inflation linked together with Japanese equity indices. In this attempt 1995’s Toda and Yamamoto VARs was considered and it was established that the above cited indicators possessed predictive powers on country’s capital market returns and the opposite was inconclusive.
In Tanzania Epaphra and Salema (2018) studied the role of TBR ,inflation ,M2 and exchange rates on Dares Salaam SE in the period 2012-2016.In their analysis, they witnessed that TBR on the contrary to exchange rates and M2, inversely correlated with equity returns. Whereas inflation on the share market was without impact at all.
Linck and Decourt (2018) also tested how inflation, GDP and interest linked together with Brazil’s capital market returns .Employing Data for 2000-2010 years they illustrated that equity indices in Brazil are moulded by GDP and interest rates. In addition, inflation did not interact with share returns significantly
In another study that relied on 1986-2016 data in South Korea, it was learnt that M2 and interest rates possessed no short term link with equity prices and while inflation together with IPI negatively correlated with Korea’s capital market in the short term, interest rate linked positively with it. Cointegration analysis as well as VECM were considered in this test (Lee, and Brahmasrene, 2018).
21
As far as Malawi is concerned, Makatchaya (2014) utilising data ranging from January 2002 to June 2014 inquired how the country’s share index and the macro-economic fundamentals interacted. In his study two macro-macro-economic fundamentals namely exchange rate and interest rates were preferred. OLS regression framework and a GARCH (1, 1) model were also adopted in the analysis. In this investigation the conclusion drawn was that Malawi’s share prices are also shaped by changes in exchange rates as well as the country’s interest rates. These two economic forces also influence both the market average prices and its volatility on the Malawi equity market.
It should be noted however that the study by Makatchaya (2013) focused only on the above two mentioned macro-economic forces. Moreover, to the researcher’s knowledge this should be the only study so far that has been undertaken on the subject matter in Malawi. Therefore, suggesting the need for another study on the same theme but with a concentration on new variables like monetary policy rate, foreign exchange reserves and inflation hence the purpose of this study.
2.3 Selected Macro-economic Events and Equity Market Linkages
2.3.1 Inflation
Inflation rate symbolises a general increment in country’s goods and services’ prices in financial theory. It exists when the cost of items goes up, a situation where people are paying more cash for the same goods and services they used to buy before. Studies large in number have been undertaken on inflation and equity market’s nexus and ultimately on share prices. However despite the availability of such efforts, equity prices and inflation’s inter-relationship continue not to be clear as conflicting results have been noted (Ahmed, Islam and Khan, 2015).
The leading study in this context is that of Fama (1981) whose work displayed that equity returns and inflation do correlate but in a negative way. He put forward that increments in inflation may drive a market taking a downswing and this may urge companies to sell their stocks at a reduced price. Contrary to this, Choudhry (1999) reported that in territories like Chile, Argentina, Mexico and Venezuela where inflation is conceived to be in large figures, inflation shares a positive link with capital market returns. Authors like Wongbampo and Sharma (2002) also looked into inflation and share indices’ link in Malaysia, Philippines, Indonesia, Thailand and Singapore. In this analysis they
22
evidenced a negative correlation of this indicator with share indices in all the five Asian nations and these outcomes conformed to that of Fama (1981).
2.3.2 Foreign Exchange Reserve
They are assets in foreign amounts that are managed by the country’s central bank and may be made up of deposits, banknotes, bonds, treasury bills and other governmental securities which are very essential for any state as it assist in discharging external debts and or for controlling domestic currencies’ value through involvement in market exchange activities (International Monitory Fund, 2000). Despite foreign exchange reserves being expected to determine share prices, in the literature it has received little care. Many studies on the economic forces and equity market’s association have focused on variables like exchange rate, IPI, CPI ,interest rates, GDP among others (Paul and Mallik ,2003; Masuduzzaman , 2012; Forson and Janrattanagul , 2013).
A study by Ray (2013) is amongst the few studies which concentrated particularly on the foreign exchange reserves’ link with share indices. He relied on India’s financial data for the 1990-2011 years and analysed capita market performance and foreign exchange reserves relations for India’s. His conclusion was that this variable positively influences stock market capitalization. Furthermore, unidirectional causality among the variables was determined and the pattern being to share indices from foreign exchange reserves.
2.3.3 Monetary Policy Rate
Christos and Kontonikas (2008) put it that monetary policy changes is likely to shape share prices both direct and indirectly. The direct effect is exerted by changing the discount rate which participants in the market use. He further said that with stiffer monetary policies the pace at which companies’ future cash flows are capitalised increase which results into a fall in stock prices. This notion is supported by the following two assumptions: Firstly, the interest rates of the market are in general tied to the discount factors which market players utilise. Secondly, the central bank is capable of determining interest rates in the market. On the other hand, the indirect influence on companies’ stock values is observed by changing anticipated future cash flows. When monetary policy is changed for the better, the overall economic activity’s degree is anticipated to rise and the stock price moves in a positive way.
23
A handful number of researchers have also conducted some investigation on monetary policy rate and capital market relations. Thorbecke (1995) utilising a VAR system that accommodated monthly inflation, share returns, FRF rate and output growth examined how equity prices and monetary policy rate inter linked in the US. The results indicated that monetary policy shifts which is evaluated by innovations in the federal funds rate, to a great extent affected smaller capitalisation stocks. In Ghana Gyau (2015) also looked into monetary policy rate’s correlation with share indices. In his study however he found monetary policy rate possessing a positive link with equity market but was insignificant. It was also observed that the two factors inter link in long-term.
From this empirical review it can be seen that capital market returns and economic indicators’ relation is still very unclear and lacks consensus among academicians and researchers. The reason being that equity markets react differently to shifts in macroeconomic conditions. In other words, an economic variable can have an influence on one market whether positive or negative but might lack the same impact on another market just as demonstrated in the case of inflation which shapes some markets positively and others negatively.
On Malawi economy it is also evident from the same literature that the attempt was made to understand how macroeconomic events mould the country’s share indices. However, this initiative as previously said only utilized two indicators in the name of interest rates and exchange rates. An implication that the inclusion of inflation, monetary policy rate and foreign exchange reserves variables in the current study will make a difference in terms of enriching literature concerning macroeconomic events’ connection with capital markets in the context of a developing market like Malawi. Put it differently, the current literature has failed to justify the impact of above listed factors on Malawi’s economic condition hence this study intends to fill such gap.
2.4 Malawi Stock Exchange
2.4.1 Its Background
Malawi capital market commenced its activities in 1994. Prior to selling of equities the institution was engaged as a secondary market for the country’s government securities in the name of Local Registered Stock and Treasury notes. It is in 1996 when the company started securities trading and NICO an insurance body was the first firm to hold
24
membership in the company. The main duties of the institution are: connecting companies and investors; offering a good marketing environment for sellers and purchasers of listed equities; monitoring the buying and selling of securities; overseeing the behaviour of listed institutions and delivering announcements on behalf of member organizations. Malawi’s equity market is authorized under 2010’s FSA and works under 2013’s CA and 2010’s SA (Malawi Stock Exchange, 2018)
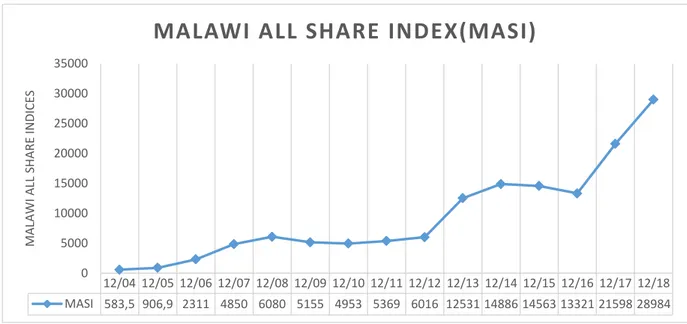
Unlike in other countries, where there exists more than one stock market, MSE is the only country’s share market in Malawi and is situated in the city of Blantyre and currently there are only 13 companies listed from industries like banking, telecommunication, insurance, real estate, food & beverages, hotels restaurant & leisure, industrial conglomerates and diversified financials. The MASI (Malawi stock exchange index) has increased in value from 100 in November 1996 to 31956.43 as at August 2018. Market capitalization as in month of August 2018 stood at 1,416,446.92 Million in Malawi kwacha (Malawi currency) and 1,951.96 million in United States Dollar. At December 2012 the MASI index was 6060.0 and this turned to 12531.04 in December 2013 (as shown in the graph below) translating into 108.31% increase. Such gain was looked upon as one of the best performance in the globe with respect to equity in that year (Malawi Stock Exchange, 2018).
Figure 3. Changes in MASI (2004-2018)
Source: MSE (2018)
However, after 22 years in operation Malawi capital market is still the smallest in the SADC area comprising of 14 Member Countries: Seychelles, South Africa, Tanzania,
12/04 12/05 12/06 12/07 12/08 12/09 12/10 12/11 12/12 12/13 12/14 12/15 12/16 12/17 12/18 MASI 583,5 906,9 2311 4850 6080 5155 4953 5369 6016 12531 14886 14563 13321 21598 28984 0 5000 10000 15000 20000 25000 30000 35000 M A LA WI A LL S HA RE IN D ICE S
25
Botswana, Mozambique, Congo, Swaziland, Mauritius, Namibia, Zambia, Zimbabwe, Lesotho and Malawi. For instance, its market capitalization as at 23 November 2018 stood at $1, 606.7 million, compared with $5,282.2 million for Lusaka Stock Exchange in Zambia, $17,081.7 million for Zimbabwe stock exchange in Zimbabwe and $ 8,604.3 million for Darussalam stock exchange in Tanzania. And its 13 listed companies are fated against 24 for Lusaka SE, 28 for Darussalam SE, and 64 for Zimbabwe SE (Darussalam SE, 2018; Malawi SE, 2018; Zimbabwe SE, 2018).
2.4.2 Performance of the Market in Other Key Indicators
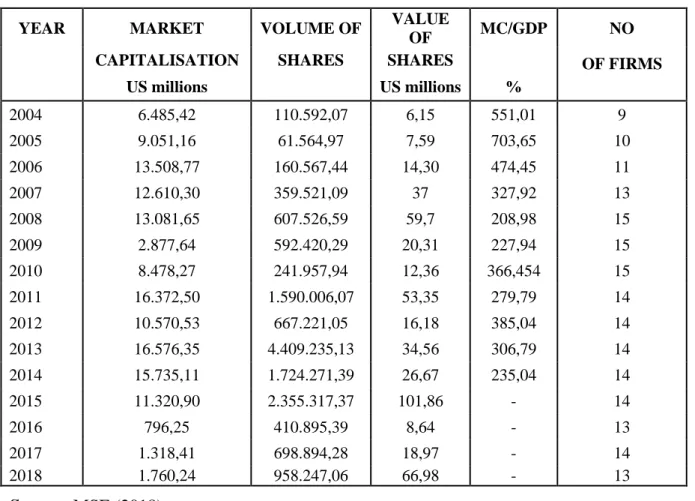
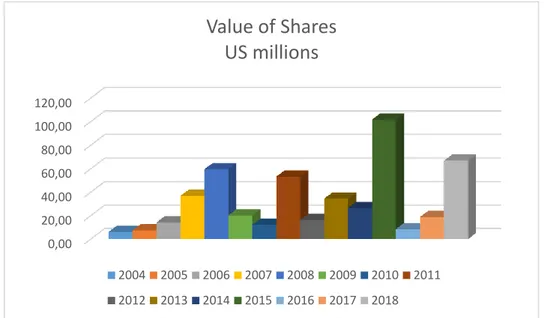
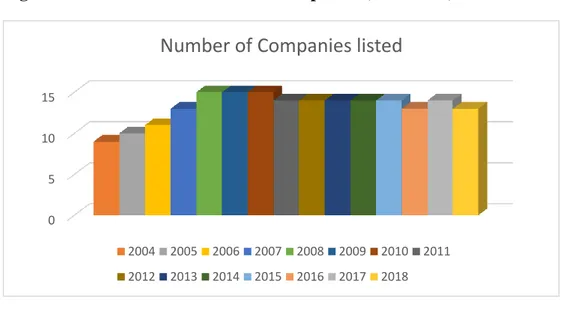
Table 1 underneath shows how the country’s equity market has performed from 2004-2018 using indicators like market capitalisation, value of shares traded, number of listed companies, Volume of shares and market depth ratio which has been represented by MC/GDP in the table and simply it is a division of market capitalisation figures by country’s GDP values.
Table 1. Malawi Capital Market Indicators (2004-2018) YEAR MARKET VOLUME OF VALUE
OF MC/GDP NO CAPITALISATION SHARES SHARES OF FIRMS US millions US millions % 2004 6.485,42 110.592,07 6,15 551,01 9 2005 9.051,16 61.564,97 7,59 703,65 10 2006 13.508,77 160.567,44 14,30 474,45 11 2007 12.610,30 359.521,09 37 327,92 13 2008 13.081,65 607.526,59 59,7 208,98 15 2009 2.877,64 592.420,29 20,31 227,94 15 2010 8.478,27 241.957,94 12,36 366,454 15 2011 16.372,50 1.590.006,07 53,35 279,79 14 2012 10.570,53 667.221,05 16,18 385,04 14 2013 16.576,35 4.409.235,13 34,56 306,79 14 2014 15.735,11 1.724.271,39 26,67 235,04 14 2015 11.320,90 2.355.317,37 101,86 - 14 2016 796,25 410.895,39 8,64 - 13 2017 1.318,41 698.894,28 18,97 - 14 2018 1.760,24 958.247,06 66,98 - 13 Source: MSE (2018)
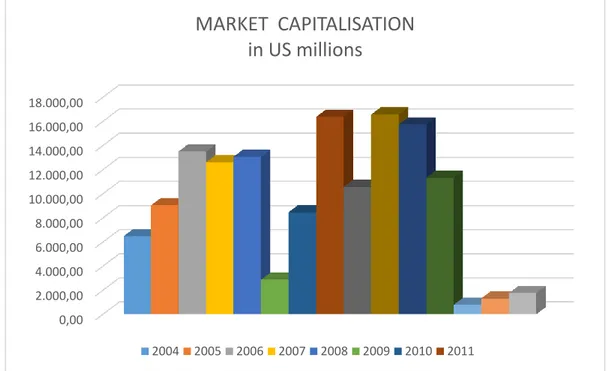
26 2.4.2.1 Market Capitalisation
As noted in the figure 5 below market capitalisation for MSE since 2004 has experienced a lot of changes. The notable changes occurred in 2016 where market capitalisation in US dollars to a great extent declined to 796.2480 million from 11,320.9008 million as of 2015.Reports indicate that the deregistering of one of foreign owned company was the contributing factor. Moreover, the 796.2480 million of 2016 was the smallest figure of market capitalisation the equity market has registered since 2004. In 2017 and 2018 however the value improved to 1318.41 and 1760.24 US million respectively although these figures are still not even near the 2004’s 6,485.417 US million. In addition, the year 2013 registered the highest market capitalisation of 16.576,35 million in US dollars and it is the only year in which the highest number of shares were traded as far as the history of the stock exchange is concerned.
Figure 4. MSE’s Market Capitalisation (2004-2018)
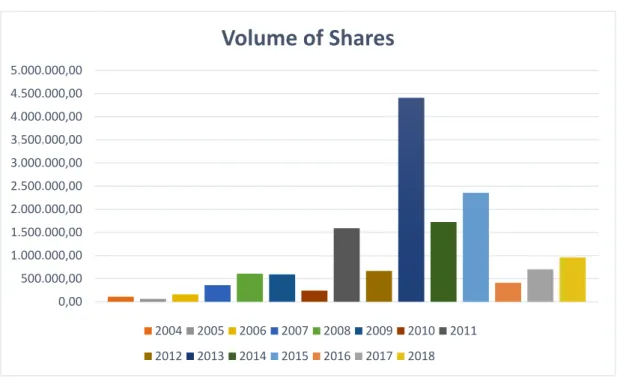
Source: MSE (2018) 2.4.2.2 Volume of Shares
With regards to volume of shares, a look at the next graph also reveals that within the period of 2004-2018, it is the year 2005 where the lowest number of shares of 61,564 were transacted on the Malawi equity market. On the other hand, the years 2011,2013,2014
0,00 2.000,00 4.000,00 6.000,00 8.000,00 10.000,00 12.000,00 14.000,00 16.000,00 18.000,00