PDF ISSN: 1528-2635
ACADEMY OF ACCOUNTING AND
FINANCIAL STUDIES JOURNAL
Editor
Mahmut Yardimcioglu
Karamanoglu Mehmetbey University
The Academy of Accounting and Financial Studies Journal is owned and published by the DreamCatchers Group, LLC. Editorial content is under the control of the Allied Academies, Inc., a non-profit association of scholars, whose purpose is to support and encourage research and the sharing and exchange of ideas and insights throughout the world.
Neither the DreamCatchers Group or Allied Academies is responsible for the content of the individual manuscripts. Any omissions or errors are the sole responsibility of the authors. The Editorial Board is responsible for the selection of manuscripts for publication from among those submitted for consideration. The Publishers accept final manuscripts in digital form and make adjustments solely for the purposes of pagination and organization.
The Academy of Accounting and Financial Studies Journal is owned and published by the DreamCatchers Group, LLC, PO Box 1708, Arden, NC 28704. Those interested in subscribing to the Journal, advertising in the Journal, submitting manuscripts to the Journal, or otherwise communicating with the Journal, should contact the Executive Director at [email protected].
Academy of Accounting and Financial Studies Journal Accounting Editorial Review Board Members
Agu Ananaba
Atlanta Metropolitan College Atlanta, Georgia
Richard Fern
Eastern Kentucky University Richmond, Kentucky Manoj Anand
Indian Institute of Management Pigdamber, Rau, India
Peter Frischmann Idaho State University Pocatello, Idaho Ali Azad
United Arab Emirates University United Arab Emirates
Farrell Gean
Pepperdine University Malibu, California D'Arcy Becker
University of Wisconsin - Eau Claire Eau Claire, Wisconsin
Luis Gillman Aerospeed
Johannesburg, South Africa Jan Bell
California State University, Northridge Northridge, California
Richard B. Griffin
The University of Tennessee at Martin Martin, Tennessee
Linda Bressler
University of Houston-Downtown Houston, Texas
Marek Gruszczynski Warsaw School of Economics Warsaw, Poland
Jim Bush
Middle Tennessee State University Murfreesboro, Tennessee
Morsheda Hassan
Grambling State University Grambling, Louisiana Douglass Cagwin
Lander University
Greenwood, South Carolina
Richard T. Henage Utah Valley State College Orem, Utah
Richard A.L. Caldarola Troy State University Atlanta, Georgia
Rodger Holland
Georgia College & State University Milledgeville, Georgia
Eugene Calvasina
Southern University and A & M College Baton Rouge, Louisiana
Kathy Hsu
University of Louisiana at Lafayette Lafayette, Louisiana
Darla F. Chisholm
Sam Houston State University Huntsville, Texas
Shaio Yan Huang Feng Chia University China
Askar Choudhury Illinois State University Normal, Illinois
Robyn Hulsart
Ohio Dominican University Columbus, Ohio
Natalie Tatiana Churyk Northern Illinois University DeKalb, Illinois
Evelyn C. Hume Longwood University Farmville, Virginia Prakash Dheeriya
California State University-Dominguez Hills Dominguez Hills, California
Terrance Jalbert
University of Hawaii at Hilo Hilo, Hawaii
Rafik Z. Elias
California State University, Los Angeles Los Angeles, California
Marianne James
California State University, Los Angeles Los Angeles, California
Academy of Accounting and Financial Studies Journal Accounting Editorial Review Board Members
Jongdae Jin
University of Maryland-Eastern Shore Princess Anne, Maryland
Ida Robinson-Backmon University of Baltimore Baltimore, Maryland Ravi Kamath
Cleveland State University Cleveland, Ohio
P.N. Saksena
Indiana University South Bend South Bend, Indiana
Marla Kraut University of Idaho Moscow, Idaho
Martha Sale
Sam Houston State University Huntsville, Texas
Jayesh Kumar
Xavier Institute of Management Bhubaneswar, India
Milind Sathye University of Canberra Canberra, Australia Brian Lee
Indiana University Kokomo Kokomo, Indiana
Junaid M.Shaikh
Curtin University of Technology Malaysia
Harold Little
Western Kentucky University Bowling Green, Kentucky
Ron Stunda
Birmingham-Southern College Birmingham, Alabama C. Angela Letourneau
Winthrop University Rock Hill, South Carolina
Darshan Wadhwa
University of Houston-Downtown Houston, Texas
Treba Marsh
Stephen F. Austin State University Nacogdoches, Texas
Dan Ward
University of Louisiana at Lafayette Lafayette, Louisiana
Richard Mason
University of Nevada, Reno Reno, Nevada
Suzanne Pinac Ward
University of Louisiana at Lafayette Lafayette, Louisiana
Richard Mautz
North Carolina A&T State University Greensboro, North Carolina
Michael Watters
Henderson State University Arkadelphia, Arkansas Rasheed Mblakpo
Lagos State University Lagos, Nigeria
Clark M. Wheatley
Florida International University Miami, Florida
Nancy Meade
Seattle Pacific University Seattle, Washington
Barry H. Williams King’s College
Wilkes-Barre, Pennsylvania Thomas Pressly
Indiana University of Pennsylvania Indiana, Pennsylvania
Carl N. Wright Virginia State University Petersburg, Virginia Hema Rao
SUNY-Oswego Oswego, New York
Academy of Accounting and Financial Studies Journal Finance Editorial Review Board Members Confidence W. Amadi
Florida A&M University Tallahassee, Florida
Ravi Kamath
Cleveland State University Cleveland, Ohio Roger J. Best
Central Missouri State University Warrensburg, Missouri
Jayesh Kumar
Indira Gandhi Institute of Development Research India
Donald J. Brown
Sam Houston State University Huntsville, Texas
William Laing Anderson College Anderson, South Carolina Richard A.L. Caldarola
Troy State University Atlanta, Georgia
Helen Lange Macquarie University North Ryde, Australia Darla F. Chisholm
Sam Houston State University Huntsville, Texas
Malek Lashgari University of Hartford West Hartford, Connetticut Askar Choudhury
Illinois State University Normal, Illinois
Patricia Lobingier George Mason University Fairfax, Virginia Prakash Dheeriya
California State University-Dominguez Hills Dominguez Hills, California
Ming-Ming Lai Multimedia University Malaysia Martine Duchatelet Barry University Miami, Florida Steve Moss
Georgia Southern University Statesboro, Georgia Stephen T. Evans
Southern Utah University Cedar City, Utah
Christopher Ngassam Virginia State University Petersburg, Virginia William Forbes
University of Glasgow Glasgow, Scotland
Bin Peng
Nanjing University of Science and Technology Nanjing, P.R.China
Robert Graber
University of Arkansas - Monticello Monticello, Arkansas
Hema Rao SUNY-Oswego Oswego, New York John D. Groesbeck
Southern Utah University Cedar City, Utah
Milind Sathye University of Canberra Canberra, Australia Marek Gruszczynski
Warsaw School of Economics Warsaw, Poland
Daniel L. Tompkins Niagara University Niagara, New York Mahmoud Haj
Grambling State University Grambling, Louisiana
Randall Valentine University of Montevallo Pelham, Alabama Mohammed Ashraful Haque
Texas A&M University-Texarkana Texarkana, Texas
Marsha Weber
Minnesota State University Moorhead Moorhead, Minnesota
Terrance Jalbert
University of Hawaii at Hilo Hilo, Hawaii
ACADEMY OF ACCOUNTING AND
FINANCIAL STUDIES JOURNAL
CONTENTS
Accounting Editorial Review Board Members . . . iii
Finance Editorial Review Board Members . . . v
LETTER FROM THE EDITORS . . . viii
LETTER FROM ALLIED ACADEMIES . . . ix
FEMALES AND FINANCIAL EXPERTS: BOARD DIVERSITY IN THE ERA OF THE SEC’S AUDIT COMMITTEE REQUIREMENTS . . . 1
Thomas E. Wilson, Jr., University of Louisiana at Lafayette TRANSPARENCY IN FINANCIAL REPORTING: A LOOK AT RULES-BASED VERSUS PRINCIPLES-BASED STANDARDS . . . 11
Thomas J. Phillips, Jr., Louisiana Tech University Andrea Drake, Louisiana Tech University Michael S. Luehlfing, Louisiana Tech University MUTUAL FUND PERFORMANCE PERSISTENCE: STILL TRUE? . . . 29
Rich Fortin, New Mexico State University Stuart Michelson, Stetson University FACTORS ASSOCIATED IN HOUSING MARKET DYNAMICS: AN EXPLORATORY LONGITUDINAL ANALYSIS . . . 43 Askar Choudhury, Illinois State University
HAS THE ADOPTION OF SFAS 158 CAUSED FIRMS TO UNDERESTIMATE PENSION LIABILITY? A PRELIMINARY STUDY OF THE FINANCIAL
REPORTING IMPACT OF SFAS 158 . . . 55 Robert Houmes, Jacksonville University
Bob Boylan, Jacksonville University
WHY DO ANALYSTS ISSUE LONG-TERM EARNINGS
GROWTH FORECASTS? AN EMPIRICAL ANALYSIS . . . 67 Huabing (Barbara) Wang, West Texas A&M University
MINORITY STOCKHOLDER INFORMATION RELEVANCE: WEALTH EFFECTS
AND/OR MONITORING? . . . 87 Zane L. Swanson, University of Central Oklahoma
CODE COMPREHENSION AND AGGRESSIVENESS AMONG CORPORATE TAX EXECUTIVES:
THE IMPACT OF CERTIFICATION AND LICENSURE . . . 103 M. Catherine Cleaveland, Mercer University
Kathryn K. Epps, Kennesaw State University Cassie F. Bradley, Dalton State College STOCK SPLITS AND WHEN-ISSUED TRADING:
A TEST OF THE SIGNALING THEORY . . . 119 Kevin L. Kemerer, Barry University
LETTER FROM THE EDITORS
Welcome to the Academy of Accounting and Financial Studies Journal. The editorial content of this journal is under the control of the Allied Academies, Inc., a non profit association of scholars whose purpose is to encourage and support the advancement and exchange of knowledge, understanding and teaching throughout the world. The mission of the AAFSJ is to publish theoretical and empirical research which can advance the literatures of accountancy and finance.
Dr. Mahmut Yardimcioglu, Karamanoglu Mehmetbey University, is the Editor. The mission is to make the AAFSJ better known and more widely read.
As has been the case with the previous issues of the AAFSJ, the articles contained in this volume have been double blind refereed. The acceptance rate for manuscripts in this issue, 25%, conforms to our editorial policies.
The Editor works to foster a supportive, mentoring effort on the part of the referees which will result in encouraging and supporting writers. He will continue to welcome different viewpoints because in differences we find learning; in differences we develop understanding; in differences we gain knowledge and in differences we develop the discipline into a more comprehensive, less esoteric, and dynamic metier.
Information about the Allied Academies, the AAFSJ, and our other journals is published on our web site. In addition, we keep the web site updated with the latest activities of the organization. Please visit our site and know that we welcome hearing from you at any time.
Mahmut Yardimcioglu, Karamanoglu Mehmetbey University
LETTER FROM ALLIED ACADEMIES
It is with the greatest sadness that we inform you of the death of Dr. Denise Woodbury in May, 2010. She has been a tremendous force in the Allied Academies organization and she has been a true friend of the Carlands for many years. She has been a member since 1997 and has served us in many ways. She will be truly missed; yet she leaves a wonderful legacy of caring and hope for all who knew her.
The Carlands have set up a scholarship for Denise through the Carland Foundation for Learning at their website at www.CarlandFoundation.org You are welcome to make a contribution in her memory at that site or to send a check to Carland Foundation for Learning to PO Box 914, Skyland, NC 28776.
Denise will be missed and long remembered by all.
Jim and JoAnn Carland Trey and Shelby Carland Jason Carland
FEMALES AND FINANCIAL EXPERTS:
BOARD DIVERSITY IN THE ERA OF THE SEC’S
AUDIT COMMITTEE REQUIREMENTS
Thomas E. Wilson, Jr., University of Louisiana at Lafayette
ABSTRACTAlthough gains have been made in recent years, women are still underrepresented on corporate boards of directors. Recently, however, the SEC has issued rules requiring public firms to disclose the “financial experts” serving on their audit committees. This study examines whether the skills and abilities necessary for service as a financial expert have affect the push for gender diversity in the boardroom. Analysis of a sample of S&P 500 and Russell Microcap firms shows that female participation corporate governance has increased since 2003, but that the growth is attributable to smaller firms. Increases in women representation among large firms appears to have slowed dramatically. Few women were named as audit committee financial experts immediately after implementation of the SEC requirement. By 2009, however, the number and percentage of women financial experts had increased significantly, reaching levels comparable to those for corporate boards as a whole. This study finds that gender diversity is not directly hampered by the specialized skills and experiences required of a financial expert.
INTRODUCTION
The lack of gender diversity in the upper management and boardrooms of U.S. corporations has been often observed (e.g., Bilimoria & Piderit, 1994; Campbell & Minguez-Vera, 2008). Daily and Dalton (2003) memorably summarize the issue:
Advocates of the status quo defend the relative lack of diversity on corporate boards as a function of too few women having the requisite qualities and experiences. Careful consideration of these criteria, however, reveals that male board members often fail to meet these criteria as well. Placing unduly restrictive criteria on the search for female board members becomes a self-fulfilling prophecy, a hunt for the mythical unicorn.
Unlike the unicorn, the female director does exist, although she is a relatively rare species.
Recently a greater premium was placed on director “qualities and experiences” by the Sarbanes-Oxley Act of 2002 (SOX). In addition to more familiar sections of the Act dealing with issues such as internal control, Section 407 of SOX required the Securities and Exchange Commission (SEC) to implement a rule requiring firms to disclose whether their audit committees included at least one “financial expert.” Although there was no explicit requirement that firms have such an expert, any public company lacking one would be required to explain the reasons why.
This paper examines the issue of board gender diversity in the wake of the SEC’s implementation of the financial expert requirement. Has the requirement hampered corporate efforts to increase the role of women on boards and on audit committees? How are smaller firms, where females traditionally are even more underrepresented, responding to the requirements?
The remainder of the paper is divided into five sections. The first section summarizes the representation of women on boards of directors and corporate audit committees. The second section details the SEC’s requirements regarding financial experts. The study’s methodology is discussed in the third section, followed by the presentation of the results. The paper closes with a summary and discussion of the findings.
GENDER DIVERSITY IN THE BOARDROOM
The relative absence of women on corporate boards of directors has been well documented. The nonprofit organization Catalyst conducts an annual survey of the share of S&P 500 corporate board seats held by women. Their 2008 survey found that 15.2% of all directorships were held by females, a slight increase over the 14.8% found in 2007. The number of S&P 500 firms without a single female director actually increased from 2007 (59 firms) to 2008 (66 firms).
This focus on larger firms in the United States is typical of most literature in the area. For example, Daily, Certo and Dalton (1999) used Fortune 500 firms to examine trends in the number of women directors over a ten year period. Williams (2004) employed a sample of Fortune 500 firms to assess the impact of women directors on corporate philanthropy. Peterson and Philpot’s (2007) examination of female director expertise and committee memberships also made use of data from Fortune 500 firms. A study released by the Corporate Women Directors International (2008) employed Fortune 500 firms to assess the interaction between women Chief Executive Officers and female representation on the board of directors.
Williams (2005) was one of the few studies to explicitly include smaller firms in an examination of director characteristics. She employed both S&P 500 firms and a sample of smaller companies in her examination of professional background and demographic traits, including gender, among audit committee financial experts. She found that, immediately after the effective date of the SEC requirement, S&P 500 firms had significantly more female experts than did smaller firms.
SEC FINANCIAL EXPERT REQUIREMENTS
The SEC’s response to the SOX requirement is contained in Item 401(h)(2) of Regulation S-K. An audit committee expert is defined as an individual who has:
‚ an understanding of generally accepted accounting principles and of financial statements;
‚ an ability to assess the general application of such principles in connection with the accounting for estimates, accruals, and reserves;
‚ experience in preparing, auditing, analyzing, or evaluating financial statements that present a breadth and level of complexity of accounting issues that are generally comparable to the breadth and complexity of issues that can reasonably be expected to be raised by the company’s financial statements, or experience actively supervising one or more persons engaged in such activities;
‚ an understanding of internal controls and procedures for financial reporting; ‚ an understanding of audit committee functions.
The SEC provided guidance as to how individuals could meet these requirements in Item 401(h)(3) of Regulation S-K. A person could become a financial expert by having:
‚ education and experience as a principal financial officer, principal accounting officer, controller, public accountant, or auditor, or experience in one or more positions that involve the performance of similar functions;
‚ experience actively supervising a principal financial officer, principal accounting officer, controller, public accountant, auditor, or person performing similar functions;
‚ experience overseeing or assessing the performance of companies or public accountants with respect to the preparation, auditing, or evaluation of financial statements; or
‚ other relevant experience.
Disclosures regarding financial experts were required for public company annual reports for fiscal years ending on or after July 2003.
METHODOLOGY
A random sample of 100 firms was drawn from firms comprising the S&P 500 as of May 2009. To provide a basis for comparison to this sample of the largest firms in the United States, another random sample of 100 firms was drawn from firms comprising the Russell Microcap Index as of May 2009. The Russell Microcap Index consists of 2,000 of the smallest publicly held companies in the United States.
Proxy statements from the SEC’s EDGAR database were examined for each sample firm. Three proxy statements were analyzed for each firm: the last statement issued before the effective date of the SEC’s financial expert disclosure requirement, the first statement issued after that effective date, and the most recent statement issued as of May 2009. Most firms in the sample had calendar year financial statements, thus the proxy statements examined were generally issued in the Spring of 2003, 2004, and 2009. For convenience, the period immediately preceding the SEC requirement is hereafter referred to as 2003, the period immediately after the effective date of the requirement is hereafter referred to as 2004, and the most recent period is hereafter referred to as 2009.
For each firm, information about the size of the board of directors and audit committee was collected, as well as the number of females serving on each. The number and gender of identified financial experts was recorded, as was information about individuals added to boards and audit committees in the years after the effective date of the SEC’s requirements.
Information about male and female directors was also used to compute the Blau Index for each firm. Commonly used as a heterogeneity measure in diversity research, the Blau Index provides a measure of the evenness of the distribution of board members among gender categories (Campbell & Minguez-Vera, 2007). The index is computed as 1-Σpi2
, where pi is the percentage of
board members of each gender. The Index will be 0 for a board of directors or audit committee comprised of all men or all women. Equal numbers of men and women will result in an Index of 0.5. Because of the large number of sample firms with only one named financial expert, the Blau Index is not employed in the analysis of financial expert gender diversity.
RESULTS
Table 1 presents data regarding the number of females serving on corporate boards, on audit committees, and as financial experts for the periods examined. As the Table makes clear, the female presence on boards has increased in recent years, with the number of firms having no female directors declining from 84 in 2003 to 68 in 2004. The percentage of female directors has also increased - from 9.78% to 10.34% to 12.34%. Although the increase in the 2004 over 2003 was small, the increase from 2004 to 2009 was statistically significant. Analysis of the Blau Index reveals a similar pattern. Board diversity increased from 2003 to 2004, and again from 2004 to 2009, with the latter increase being statistically significant.
Table 1
2003 All Firms Large Firms Small Firms Significance
Mean Median Mean Median Mean Median t-test
Board of Director Size 9.05 10.44 7.66 8.405
Females on Board 0.89 1.41 0.36 9.262
% Female 0.089 0.1334 0.0447 7.447
Audit Committee Size 3.73 4.21 3.25 7.474
Females on Audit Committee 0.4 0.7 0.09 8.322
% Female 0.0939 0.1602 0.0275 7.608
2004 All Firms Large Firms Small Firms Significance
Mean Median Mean Median Mean Median t-test
Board of Director Size 9.09 10.47 7.71 8.559
Females on Board 0.94 1.51 0.37 9.645
% Female 0.095 0.142 0.048 7.906
Audit Committee Size 3.82 4.23 3.42 6.109
Females on Audit Committee 0.4 0.69 0.11 7.26
% Female 0.0927 0.1544 0.031 6.69
2009 All Firms Large Firms Small Firms Significance
Mean Median Mean Median Mean Median t-test
Board of Director Size 9.32 11.02 7.62 10.82
Females on Board 1.15 1.77 0.53 8.754
% Female 0.1115 0.1579 0.065 6.288
Audit Committee Size 3.91 4.45 3.36 8.044
Females on Audit Committee 0.47 0.73 0.22 6.028
% Female 0.1084 0.1528 0.064 4.495
The requirements of financial literacy and financial expertise may have affected the growth among women serving on audit committees among sample firms. Although the number of firms without female audit committee members decreased in each year examined, females as a percentage of total audit committee members actually declined slightly from 2003 to 2004. Although this percentage grew to 12.16% in 2009 and was comparable to the overall board rate of 12.34%, the increase from 2004 was not statistically significant. The results for the Blau Index for audit committees yield similar findings.
Immediately after the implementation of the requirements regarding audit committee financial experts, sample firms identified 323 experts, of which 20 (6.19%) were female. In 2009,
the percentage of female experts had grown to 10.83%, a statistically significant increase, and a level roughly comparable to the percentages for audit committees and for boards as a whole.
Table 1 provides evidence that female representation on corporate boards of directors is increasing. However, on the committee charged with oversight of reliable financial reporting, increases in female membership are not significant at traditional levels. Given this finding, it is somewhat surprising that among designated audit committee financial experts, perhaps the board position with the most rigorous requirements, the percentage of women has been increasing significantly.
As noted earlier, S&P 500 companies have larger boards of directors and larger audit committees than do smaller firms, creating more opportunities for females to serve as directors. Table 2 compares the S&P 500 firms in the sample to those drawn from the Russell Microcap Index.
Table 2
2004 All Firms Large Firms Small Firms
Mean Median Mean Median Mean Median t-test Significance
Experts 1.61 1.93 1.3 4.553 Female Experts 0.1 0.16 0.04 2.872 % Female 0.0487 0.0673 0.03 1.502 0.135 2009 Experts 1.98 2.56 1.41 7.404 Female Experts 0.22 0.33 0.1 3.569 % Female 0.0905 0.1293 0.0517 2.581 0.011
The differences between large and small firms in the sample are striking. In all years examined, more Microcap firms lacked any female directors than did S&P 500 firms. For all years, the S&P firms had significantly higher percentages of female directors and audit committee members than their Microcap counterparts. Blau Indices for all years were significantly different as well.
Table 3 provides information about trends in women directors, audit committee members, and financial experts for both S&P 500 companies and Microcap firms. Although females are comparatively underrepresented on the boards of smaller firms, their presence has been increasing over time, as Panel B of Table 3 demonstrates. The percentage of female directors serving on Microcap boards and on audit committees was significantly higher in 2009 than in 2004. Board of director and audit committee Blau Indices for Microcaps were also significantly higher in 2009. The percentage of females named as financial experts more than doubled from 2004 to 2009.
Table 3
All Firms Large Firms Small Firms
2004 Mean Median Mean Median Mean Median t-test Significance
New Directors 0.95 0.95 0.94 0.055 ns
New Females 0.12 0.19 0.05 2.457 0.015
% Female 0.1296 0.1872 0.069 2.139 0.035
New Audit Committee 0.33 0.26 0.4 -1.475 0.142
New Females 0.04 0.06 0.01 1.693 0.092
% Female 0.0918 0.1842 0.0333 1.77 0.089
New Experts 0.18 0.13 0.24 -1.74 0.083
New Females 0.02 0.03 0 1.75 0.082
% Female 0.0625 0.2222 0 1.835 0.104
All Firms Large Firms Small Firms
2009 Mean Median Mean Median Mean Median t-test Significance
New Directors 3.43 4.15 2.72 4.838
New Females 0.49 0.64 0.34 3.267
% Female 0.1368 0.1568 0.1141 1.573 0.118
New Audit Committee 1.36 1.61 1.11 3.522
New Females 0.24 0.32 0.16 2.48 0.014
% Female 0.1806 0.2093 0.1484 1.179 ns
New Experts 0.73 0.95 0.5 3.901
New Females 0.11 0.15 0.08 1.481 0.14
% Female 0.1739 0.1819 0.1628 0.268 ns
Panel A of Table 3 presents the results for S&P 500 firms and paints a somewhat different picture. Although the percentage of female directors has increased over the years, that increase is not statistically significant. The 2004 Blau Index for S&P 500 firms was significantly higher than in 2003, but did not increase appreciably from 2004 to 2009. The percentage of females serving on audit committees actually decreased from 2003 to 2009. Only in the case of females named as financial expert did the 2009 results significantly exceed 2004 levels.
Taken together, Table 3 provides evidence that most of the growth in female participation in corporate governance in recent years can be traced to smaller firms. Although the level of female representation is significantly less than for S&P 500 firms, Microcaps have greatly increased their percentage of female directors and audit committee members. Growth among the larger firms,
however, has essentially stagnated. Only among female experts have there been significant increases among both segments of the sample.
One reason for the relative lack of growth in female directors among S&P 500 firms may be that those firms have lower director turnover and thus fewer opportunities to add females to their boards. To investigate the extent to which differing director turnover rates affect the results, an analysis of the new directors among sample firms was conducted. For 2004, a new director is anyone not serving on the firm’s board in 2003. For 2009, a new director is anyone not serving on the firm’s board in 2004. A similar approach was followed to identify new audit committee members and new financial experts, although existing board members newly assigned to audit committee service were not classified as “new”.
Table 4 presents the results for new board and committee members. As the Table makes clear, in 2004, females made up approximately 20% of newly named board members, audit committee members, and financial experts of S&P 500 firms. All of these rates were significantly greater than for the smaller firms in the sample.
Table 4
All Firms Large Firms Small Firms
Mean t-test sig Mean t-test sig Mean t-test sig
Females on Board 03 0.88 1.41 0.36 Females on Board 04 0.94 -1.647 0.101 1.51 -1.787 0.077 0.37 -0.276 ns Females on Board 09 1.15 -3.095 0.002 1.77 -2.118 0.037 0.53 -2.753 0.007 % of Females on BOD 03 0.089 0.1334 0.0447 % of Females on BOD 04 0.095 -1.921 0.056 0.142 -2.111 0.037 0.048 -0.706 ns % of Females on BOD 09 0.1115 -2.249 0.026 0.1579 -1.252 0.214 0.065 -2.315 0.023 Females on AC 03 0.4 0.7 0.09 Females on AC 04 0.4 -0.179 ns 0.69 0.199 ns 0.11 -0.815 ns Females on AC 09 0.48 -1.615 0.108 0.73 -0.483 ns 0.22 -2.595 0.011 % of Females on AC 03 0.0939 0.1602 0.0275 % of Females on AC 04 0.0927 0.184 ns 0.1544 0.563 ns 0.031 -0.472 ns % of Females on AC 09 0.1084 -1.422 0.157 0.1528 0.086 ns 0.064 -2.712 0.008 Female Experts 04 0.1 0.16 0.04 Female Experts 09 0.22 -3.612 0.33 -2.985 0.1 -2.16 0.033 % of Female Experts 04 0.0487 0.0673 0.03 % of Female Experts 09 0.0905 -2.482 0.014 0.1293 -2.209 0.029 0.0517 -1.165 ns
In 2009, however, the percentage of newly named females dropped across the board for the S&P 500 firms, while the Microcap sample segment greatly increased the percentage females among
newcomers to their boards. By 2009, there was no significant difference between the sample groups in the proportion of females among newly named directors.
SUMMARY AND CONCLUSIONS
This study provides evidence about the representation of women on corporate boards if directors in the wake of the SEC requirements regarding audit committee financial experts. Analysis of a sample drawn from both the largest and smallest publicly held firms in the United States yielded several findings of interest.
First is the observation that the percentages of director positions held by women has been increasing steadily over time. There are more women serving on boards and more firms have at least one female director. Women directors possess the “qualities and experiences” required to serve on audit committees, as the proportion of female audit committee members is comparable to that of directors as a whole. However, increases in the level of audit committee participation by women over time are not statistically significant.
Significant differences were observed between the S&P 500 and Microcap firms in the sample. In all years examined, larger firms had significantly higher levels of women on their boards, audit committees, and serving as financial experts than did their smaller counterparts. However, the gap appears to be narrowing as among S&P 500 firms, increases in the percentage of women directors over time are not statistically significant, while growth in female audit committee membership seems to have essentially halted. By contrast, Microcap firms are significantly increasing the gender diversity of their boards of directors and audit committees.
Immediately following implementation of the SEC rules, few women directors were named by the firms as audit committee financial experts. This underrepresentation led researchers such as Williams (2005) to call for examination of the “paucity of female experts.” However by 2009, the number of female financial experts had grown dramatically, with the percentage of female experts approaching the overall percentage of female directors.
The evidence indicates that the specialized knowledge and skills required of audit committee financial experts do not act as a bar to women. Women financial experts are greatly outnumbered by men, but, to echo Daily and Dalton (2004), as a species they do not appear appreciably rarer than other varieties of female director.
REFERENCES
Bilimoria, D. & S.K. Piderit (1994). Board committee membership: Effects of sex-based bias. Academy of Management Journal, 37(6), 1453-1477.
Campbell, K.& A. Minguez-Vera (2008). Gender diversity in the boardroom and firm financial performance. Journal of Business Ethics, 83, 435-451.
Catalyst (2008). 2008 Catalyst census of women board directors of the Fortune 500. Retrieved June 27, 2009 from http://www.catalyst.org/file/242/08_census_wbd_jan.pdf.
Corporate Women Directors International (2008). 2008 CWDI report: Impact of women CEOs on women’s access to c o r p o r a t e b o a r d s e a t s a n d t h e c - s u i t e . R e t r i e v e d J u n e 2 9 , 2 0 0 9 f r o m http://www.globewomen.org/CWDI/2008%20CWDI/2008_cwdi_report%20-%20Key%20Findings.html. Daily, C. M., S.T. Certo & D.R. Dalton (1999). A decade of corporate women: Some progress in the boardroom, none
in the executive suite. Strategic Management Journal, 20: 93-99.
Daily, C.M. & D.R. Dalton (2003). Women in the boardroom: A business imperative. Journal of Business Strategy, 24(6), 8-9.
Peterson, C.A. & J. Philpot (2007). Women’s roles on U.S. Fortune 500 boards: Director expertise and committee memberships. Journal of Business Ethics, 72:177-196.
Securities and Exchange Commission (2003). Final rule: Standards related to listed company audit committees. SEC Release Nos. 33-8330 and 34-47654. Washington, D.C.
Williams, R.J. (2003). Women on corporate boards of directors and their influence on corporate philanthropy. Journal of Business Ethics, 42, 1-10.
TRANSPARENCY IN FINANCIAL REPORTING:
A LOOK AT RULES-BASED VERSUS
PRINCIPLES-BASED STANDARDS
Thomas J. Phillips, Jr., Louisiana Tech University
Andrea Drake, Louisiana Tech University
Michael S. Luehlfing, Louisiana Tech University
ABSTRACT
The presentation of pro forma or “as if” data allows managers greater flexibility in reporting and, if done in the spirit of truthful reporting, the ability to more clearly present their firm’s performance. It parallels the idea of a principles-based standard, wherein managers are given the responsibility and flexibility to report an event in a manner that reflects its true effect on firm value. In general, IFRS is considered to be more principles-based than U.S. GAAP, which is perceived to be more rules-based. Thus, the shift to IFRS will offer new challenges to U.S. financial reporting in that more flexibility and responsibility will be imparted to management. Previously, this flexibility was only allowed under a pro forma reporting format. We discuss the shift from rules-based to principles-rules-based accounting standards from a theoretical viewpoint, considering recent corporate trends and how this change could be either positive or negative. Additionally, we report the results of a study of student subjects where we address their perceptions regarding whether rules-based versus principles-based accounting standards would be preferable to different external stakeholders.
INTRODUCTION
Transparency in financial reporting has always been considered positive from the standpoint of financial statement users, but not necessarily something for which management has striven. Rather, corporate managers often envision a major part of their role as “marketing” the company, particularly in regard to raising capital and maintaining equity growth. Management can even seem obsessed with painting the company in “a good light.”
Such an obsession by management has many times led to unwarranted surprises for external users of financial statements. This is especially problematic when companies report high-dollar earnings and substantial market share growth one moment only to file for bankruptcy in the next moment. No doubt, dubious information reported by management immediately preceding such bankruptcies were anything but transparent to financial statement users.
To gain insights into such lapses in transparency, we first discuss a seemingly innocent but often deceptive practice – pro-forma reporting. Thereafter, we provide some thoughts regarding financial reporting under U.S. Generally Accepted Accounting Principles (GAAP) as well as International Financial Reporting Standards (IFRS). Next, we draw parallels between the coming adoption of IFRS and past pro forma reporting controversies. Lastly, we follow our theoretical discussions with a study of student subjects where we address their perceptions regarding whether rules-based versus principles-based accounting standards would be preferable to different external stakeholders.
PRO FORMA REPORTING
Pro forma reporting has historically been considered a means to facilitate the comparison of “apples with apples” or a means to “right a wrong” with respect to the disclosure of transactions and events which, without special treatment, might mislead investors and other stakeholders. Derived from a Latin phrase with the connotation “as if,” pro forma information has traditionally been associated with reporting infrequent events such as a change in accounting principle, a change in normal operations or change in the entity (e.g., when one company acquires another company). In such instances, pro forma information assists financial statement users by illustrating the financial position, results of operations, and/or cash flows had certain transactions or events not occurred, occurred earlier, or occurred differently. Financial analysts and other financial statement users desire maximum “visibility” in order to estimate future company earnings.
At best, pro forma information cuts through some of the fog and haziness caused by one-time transactions and events, such as the expansion of a new product line or the elimination of a weak segment. At worst, pro forma reporting misleads financial statement users through somewhat dubious one-time charges or credits related to events that have not occurred and may never occur. For example, one company reported pro forma amounts including a large gain on sale of a subsidiary, while excluding an even larger expense for the amortization of purchased intangibles and other items such as research and development charges. Similarly, another company reported a multi-billion dollar pro forma net income (after selectively excluding various charges), while the actual net loss for the year exceeded one billion.
In certain situations the desire to undertake aggressive pro forma practices may appear justifiable to some degree. For example, managers argue that there are deficiencies in GAAP such as unrecorded assets like certain patents, trademarks, copyrights, trade secrets, and human resources. Additionally, managers also bemoan the silence of GAAP regarding non-financial factors such as product development efficiency, customer satisfaction, market share, and many other similar measures. Admittedly, while some companies may have legitimate arguments regarding such deficiencies, others simply want to trim bad numbers from their financial statements. Such a selective slicing and dicing of negative amounts may “numerically” meet Wall Street expectations, but it does not meet the “spirit” of Wall Street expectations and, as a consequence, results in a loss
of credibility. Of course, inappropriate pro forma practices may merely represent the manifestation of management’s frustration with slumping stock prices–and disappearing bonuses. In response to these and other concerns, the Financial Accounting Standards Board (FASB) became involved in a project that encompasses issues relating to the appropriateness of pro forma practices within the broader context of financial performance measures.
FASB’s PROJECT ON REPORTING FINANCIAL PERFORMANCE
Several years ago, FASB became engaged in a project entitled Reporting Information About the Financial Performance of Business Enterprises: Focusing on the Form and Content of Financial Statements (FASB, 2001). Understandably, the issue of reporting on financial performance is of major significance and is much broader than simply an examination of pro forma reporting abuses found in some earnings releases. FASB’s project attempted to offer standard definitions for some commonly used terms. For example, Senior FASB Project Manager Ronald J. Bossio, CPA indicates that with respect to the “EBITDA” (earnings before interest, taxes, depreciation, and amortization) calculation, a manufacturing firm may or may not include depreciation in its production costs (and thus, cost of goods sold). Additionally, he indicates that a common definition sponsored by FASB would make it difficult for companies to use their own variation.
Generally speaking, FASB’s project was undertaken to respond to the following threats to financial statement transparency:
‚ No common definitions of the elements of financial performance and inconsistent practices regarding the presentation of financial performance,
‚ Increased pro forma reporting and other evidence suggesting that the use of and reliance on net income as an indicator of performance is decreasing, and
‚ No consensus or common definitions for the key financial measures or indicators of financial performance that financial statements or financial reporting should provide.
Table 1 specifies the major questions asked by FASB concerning financial statement transparency. The primary focus of these questions concerned what financial measures are being used by investors, creditors, analysts and others. Additionally, the FASB also considered whether changes to existing standards are needed to require the display of line items to support the presentation of new financial measures. Further, the FASB attempted coordination with the International Accounting Standards Board (IASB) and the UK’s Accounting Standards Board (ASB), seeing a great benefit of sharing information given that the IASB and the ASB added a
similar focus to their agendas. Hence, FASB asked their staff to use IASB and ASB papers as a basis of FASB discussions.
Table 1: Key Issues Concerning Financial Statement Transparency
1 What are the key financial measures (or indicators) that investors, creditors, and others use to assess and compare the performance of different enterprises in making rational investment decisions?
2 Are changes to existing standards needed to require the classification and display of specified line items, including their summarization and display of new financial measures in financial statements? For example, if EBITDA were identified as a key performance indicator, should companies be required to present EBITDA as a separate line item that is calculated in a consistent manner? If specified items of operating cash flow inflows or outflows were identified as key performance indicators, should companies be required to use the direct method of reporting operating cash flows?
3 Is it possible and desirable to distinguish between the effects of core (operating) and noncore (nonoperating) activities? If so, how should companies present core and noncore activities? For example, would such a classification scheme require new standards for the disaggregation of the components of net periodic pension expense or to allocate or classify items such as income tax expenses (benefits), holding gains and losses on financial instruments, restructuring charges, asset impairments, and extraordinary and unusual items. 4 Are there key measures of components of earnings that have complementary key measures of cash flows,
and, if so, should consistent classification schemes be required for income statements and statements of cash flows?
5 If a financial instrument is recognized and measured at fair value, to what extent is the amount of interest or other items of income or expense contributing to the total change in fair value of the instrument a major factor in evaluating financial performance? Should companies separately display certain or all of the components of the change in value in an income statement?
6 Do alternative means of presenting a measure of comprehensive income affect a user’s understanding of that measure and the weight given to that measure?
Source: Reporting Information about The Financial Performance of Business Enterprises: Focusing on the Form and Content of Financial Statements (FASB, 2001)
FASB’s research initially centered on interviewing investors, creditors, and their advisors to obtain opinions concerning key financial measures. Preliminary findings from the interview process were as follows:
‚ Users have a strong interest in greater disclosure of information with predictive value.
‚ There is no widespread dissatisfaction with or demand for sweeping change in financial statement display; that is, there is no need to scrap any particular financial statement, add new financial statements, or make other extreme changes in display.
‚ Key financial measures include the following, which are not necessarily well-defined terms or notions: (a) “operating” free cash flow or free cash flow, (b) return on invested capital, and (c) “adjusted,” “normalized,” or “operating” earnings. ‚ Net income is an important measure that often is used as a starting point for analysis
but generally is not the most important measure used in assessing the performance of an enterprise or in assessing its prospects relative to other enterprises in its industry.
‚ There is little demand for or opposition to the presentation of comprehensive income in a single statement provided that the individual items of comprehensive income are transparent -- that is, their amounts are clearly labeled and disclosed.
‚ Many, if not most, users prefer a statement of cash flows that reports operating cash flows under the direct method -- that is, clearly discloses amounts for items such as cash paid to suppliers and employees and cash collected from customers.
‚ Users also have a strong interest in greater disclosure about the major components of an enterprise’s capital expenditures that might provide forward-looking information about an enterprise’s plans and prospects (for example, amounts of cash outflows for purchases of productive assets to maintain existing capacity and to expand capacity).
While the FASB expressed a specific concern regarding the increased use of alternative, non-GAAP measures of performance such as EBITDA, the Board had a broader concern in that financial statement users seemed willing to follow management’s lead and focus on these somewhat ill-defined, non-GAAP measures. Given that this highly-summarized and selective form of reporting permeated the financial marketplace, FASB wanted to ensure the future relevance of financial reporting by taking an open-minded, closer look at GAAP. Subsequently, FASB joined with the IASB in order to facilitate the convergence of standards; their efforts became a broader project currently called “Financial Statement Presentation—Joint Project of the IASB and FASB” (FASB, 2009).
DISCLOSING NON-GAAP MEASURES
Whether included in the supplemental information accompanying the financial statements or included in the pro forma amounts announced in press releases, non-GAAP measures may enhance as well as impair financial statement transparency. Unfortunately, history suggests the latter rather than the former. As early as 1973, the SEC highlighted problems associated with presentations
of non-GAAP measures in Accounting Series Release (ASR) No. 142 Cautionary Advice Regarding
the Use of "Pro Forma" Financial Information (SEC, 1973). At that time, the Commission warned
about potential confusion when using non-GAAP measures stating:
. . . If accounting net income computed in conformity with generally accepted accounting principles is not an accurate reflection of economic performance for a company or industry, it is not an appropriate solution to have each company independently decide what the best measure of its performance should be and present that figure to its shareholders as Truth.
More recently, the SEC provided staff recommendations in the Division of Corporation Finance: Frequently Requested Accounting and Financial Reporting Interpretations and Guidance (SEC 2001) that addressed pro forma reporting. Even so, pro forma abuses continued to surface and additional attention on financial reporting was necessary.
Fortunately, the Sarbanes-Oxley Act of 2002 was signed into law with provisions that specifically address pro forma reporting. Section 401 (b) of the Act directed the SEC to adopt rules requiring public disclosure (e.g., earnings releases) such that it does not contain material untrue statements of fact or omit statements that are necessary to avoid misleading the public through non-GAAP financial measures. Additionally, under Section 401(b), publicly held companies were required to not only reconcile any non-GAAP financial measures with the comparable GAAP financial measures, but to disclose the reconciliation in the press release.
Empowered by Section 401 (b) of Sarbanes-Oxley, the SEC adopted new disclosure requirements under Regulation G and made amendments to Item 10 of Regulation S-B and Item 10 of Regulation S-K. Regulation G requires companies making public disclosures or releases of non-GAAP financial measures to include:
‚ a presentation of the most directly comparable GAAP financial measure; and ‚ a reconciliation of the disclosed non-GAAP financial measure to the most directly
comparable GAAP financial measure.
Amendments to Item 10 of Regulations S-B and S-K apply to financial measures in filings with the SEC, and under an additional amendment to Form 8-K, public releases became part of the required SEC filings. Companies are required to file such information on Form 8-K within two days of the earnings release or similar public disclosure. Hence, the amendments to Regulations S-B and S-K apply to the earnings releases of public companies and restrict how non-GAAP pro forma amounts are presented. These amendments require registrants using non-GAAP measures to provide:
‚ a presentation, with equal or greater prominence, of the most directly comparable financial measure calculated and presented in accordance with GAAP;
‚ a reconciliation . . . which shall be quantitative for historical non-GAAP measures presented, and quantitative, to the extent available without unreasonable efforts, for forward-looking information, or the differences between the non-GAAP financial measure disclosed or released with the most directly comparable financial measure or measures calculated and presented in accordance with GAAP;
‚ a statement disclosing the reasons why the registrant’s management believes that presentation of the non-GAAP financial measure provides useful information to investors regarding the registrant’s financial condition and results of operations; and
‚ to the extent material, a statement disclosing the additional purposes, if any, for which the registrant’s management uses the non-GAAP financial measure that are not otherwise disclosed.
According to the SEC, these amendments prohibited:
‚ excluding charges or liabilities that required, or will require, cash settlement, or would have required cash settlement absent an ability to settle in another manner, from non-GAAP liquidity measures, other than the measures EBIT and EBITDA; ‚ adjusting a non-GAAP performance measure to eliminate or smooth items identified
as non-recurring, infrequent or unusual, when (1) the nature of the charge or gain is such that it is reasonably likely to recur within two years, or (2) there was a similar charge or gain within the prior two years;
‚ presenting non-GAAP financial measures on the face of the registrant’s financial statements prepared in accordance with GAAP or in the accompanying notes; ‚ presenting non-GAAP financial measures on the face of any pro forma financial
information required to be disclosed by Article 11 of Regulation S-X; and
‚ using titles or descriptions or non-GAAP financial measures that are the same as, or confusingly similar to, titles or descriptions used for GAAP financial measures.
In addition to the Sarbanes-Oxley (Section 401(b)) requirements and the resulting SEC regulations (Regulation G and Item 10 of Regulations S-B and S-K), the Financial Executives International (www.fei.org) and the National Investor Relations Institute (www.niri.org) provide guidance regarding pro forma reporting. Each organization maintains that GAAP information provides a “critical framework” for pro forma results. They also stress the need for reconciliation between pro forma and GAAP results (as required by Regulation G). Further guidance regarding pro forma reporting is found in Standard & Poor’s whitepaper, “Measures of Corporate Earnings” (www.standardandpoors.com). The whitepaper discusses S&P’s measure of operating earnings, deemed “core earnings.”
Quality, transparent reporting should be the goal of all companies and is certainly essential for financial reporting to regain and maintain credibility. Still, the financial marketplace continues to use key financial performance data that are yet to be standardized. Some have voiced legitimate concerns that not every company has the same reporting needs and that a certain amount of flexibility is needed. Nonetheless, as seen from the market’s reaction to questionable accounting practices, caution is essential. Until some consensus is reached regarding key performance indicators and these measures gain approval, SEC requirements have limited the manner in which companies disclose non-GAAP performance measures in pro forma reporting. It is prudent for companies to refrain from too much selective reporting–especially what former Chief SEC Accountant Lynn Turner refers to as “EBS” reporting (“Everything but Bad Stuff”).
RULES-BASED VERSUS PRINCIPLES-BASED ACCOUNTING STANDARDS: PAST IS PROLOGUE?
Problems faced earlier regarding pro forma reporting may have been largely resolved, but the sentiment of managers has not really changed, as seen when we look at the more recent past. The statement that there is “nothing new under the sun” could not be more appropriate than when considering today’s economic crisis, corporate practices such as questionable revenue recognition, and how the convergence of standards-setting will impact financial reporting, perhaps setting the stage for a new approach to the same old fog and haziness that leaves little trace of transparency. Questions now focus on FASB versus IASB standards. While each Board has issued its share of rules-based standards, it is generally agreed that FASB’s previous standards are more aptly described as “rules-based” and IASB’s standards tend to be closer to “principles-based.” At first blush, the complexities of rules-based standards make principles-based standards seem quite attractive especially in situations where rules-based standards force companies with unusual circumstances to do a poor job of reporting true economic substance. On the other hand, given the flexibility inherent in principles-based standards, such standards may provide opportunities for some managers to reduce financial statement transparency.
One concern with recent changes is what sometimes seems to be a failure to consider the historical development of previous standards. For example, provisions under recently enacted SFAS
No. 154, Accounting Changes and Error Corrections (FASB, 2005) routes the cumulative effect of changes in accounting principles through the statement of retained earnings. While it is true that the cumulative effect of a change does not really affect this year’s earnings, the reason that Accounting Principles Board (APB) Opinion No. 20 Accounting Changes (APB, 1971) forced companies to place the cumulative effect of changes on the face of the income statement in the year of change was to “red flag” the change in a manner that it would not go unnoticed (or to keep the cumulative effect from “escaping” the income statement). Prior to APB No. 20, some companies had a habit of slipping changes in accounting principles onto the statement of retained earnings as a prior period adjustment, thereby, never actually showing the effect of the change on income. Such changes usually occurred at a time when the change was financially beneficial to the company’s earnings (see May and Schneider, 1988) Now, under SFAS No. 154, the prior period adjustment is referred to as a retrospective application, but the effect is essentially the same. While previously released financial statements must now be restated under the SFAS No. 154, under APB No. 20 this was considered a poor way to disclose a consistency violation except in special cases. Thus the standard-setting process concerning accounting changes has gone full circle. Perhaps more importantly, is this situation an isolated instance or a foreshadowing of things to come?
While SFAS No. 154 will undoubtedly have some benefits, one must question whether this is an overall improvement. Will companies today not take advantage of a situation that was previously considered a problem? What current guarantees will ensure that companies do not use the new standard as an open avenue to managing earnings? One needs only to look back at recent revenue recognition abuses (e.g. channel stuffing) to understand the lack of integrity of some corporate managers. Abuse of the general principle of revenue recognition led FASB to make rules that would disallow certain practices. This, in turn, led to additional rules to close new loopholes. In other words, a rules-based system is sometimes a natural progression from a principles-based system, particularly when there is a lack of integrity among those responsible for the financial statement transparency of a company, To gain insights into this matter, we conduct a study of student subjects where we address their perceptions regarding whether rules-based versus principles-based accounting standards would be preferable to different external stakeholders.
HYPOTHESES
There are several reasons to believe that corporate managers would prefer principles-based standards over rules-based standards. First, if managers in good faith want to report what they believe to be the financial consequences of longer term transactions or activities, a principles-based standard would allow them the flexibility to do so. Second, if managers believe there are benefits to smoothing earnings or meeting analyst forecasts, the flexibility of principles-based standards will, again, allow them to more easily accomplish these goals. Thirdly, if management compensation is linked to meeting various goals, principles-based standards would seem to facilitate the attainment of these goals – whether in the best interest of the firm or not. Given these arguments, we predict
that those familiar with the accounting environment would believe that managers would prefer principles-based standards over rules-based standards.
Hypothesis 1: Corporate managers will be perceived to prefer principles-based standards over rules-principles-based standards.
Investors and potential investors, with the goal of making economically rational resource allocations, would ideally prefer the information contained within a firm’s financial statements to be without error or bias, and to facilitate comparisons with other firms. Their interest is in trying to predict the future value of a current or potential equity investment in order to maximize their return on their equity investments. Rules-based standards constrict management’s choices of how to report certain activities, thereby potentially hampering an investor’s efforts to value a firm if the rules preclude the firm from reporting the “true” effect of a given activity. However, a principles-based system, while allowing for the flexibility to report “truthfully” an event that a rules-based system might have “misreported,” also allows for earnings manipulation that might not be “truthful” (i.e. the management of earnings strictly to increase compensation). Significantly, a rules-based system ensures (more often than not) that two firms will report a given event in the same way, allowing for easier comparability. Given this and the potential downside associated with the flexibility of a principles-based system, we predict that investors will be perceived to prefer rules-based systems.
Hypothesis 2: Investors will be perceived to prefer rules-based standards over principles-based standards.
Creditors are necessarily interested in assessing a firm’s ability to repay debt obligations with a fixed rate or amount of interest. There is no residual interest in the long-term value of the firm, other than in determining its ability to pay long-term debt. Given that creditors have a more limited need to assess the value of a firm (i.e., its ability to make fixed principal and interest payments versus trying to determine the potential for investment income) we predict that rules-based standards would be perceived to be their preference.
Hypothesis 3: Creditors will be perceived to prefer rules-based standards over principles-based standards.
Accounting students who have progressed to the junior level and above are likely to be aware of the need for GAAP to satisfy the information needs of various stakeholders (i.e., financial statement users). Through course work, job/internship experience, and familiarity with the convergence between U.S. GAAP and IFRS, they have also been exposed to the conflicting views of various stakeholders with respect to rules-based and principles-based standards. In this knowledge environment, we believe accounting students will be aware of the need for a wide variety of
standards that may include both rules-based and principles-based standards. Thus, we believe students will be neutral with respect to whether they personally believe rules-based or principles-based standards to be preferable. In addition, they are likely to believe that an eventual comprehensive set of standards will contain both types.
Hypothesis 4: Upper level accounting students will be neutral with respect to whether they perceive rules-based or principles-based standards to be preferable.
Hypothesis 5: Upper level accounting students will agree that a mix of rules-based and principles-based standards are likely.
RESEARCH METHOD
To obtain evidence concerning the above hypotheses, we asked student subjects to read two examples of current accounting standards combined with short explanatory notes as shown in the Appendix. One example was based on Accounting Research Bulletin (ARB) No. 43, Restatement and Revision of Accounting Research Bulletins (Committee on Accounting Procedure, 1953) that contains the general guidance for when it is appropriate to recognize revenue. Also contained in the example is reference to SFAS No. 48, Recognition of Revenue when Right of Return Exists (FASB, 1981). Thus, the scenario provides both the general principle of when it is appropriate to recognize revenue and specific “rules” to apply in a situation where correct reporting under only a “principle” may be difficult to determine (i.e., if the right of return exists).
The second example is based on SFAS No. 2, Research and Development (FASB, 1973). This scenario basically explains the rule for recording all research and development (R&D) costs as expenses, but raises the issue of a principles-based standard that would allow for value-creating R&D to be recorded as an asset and non-value creating R&D to be expensed.
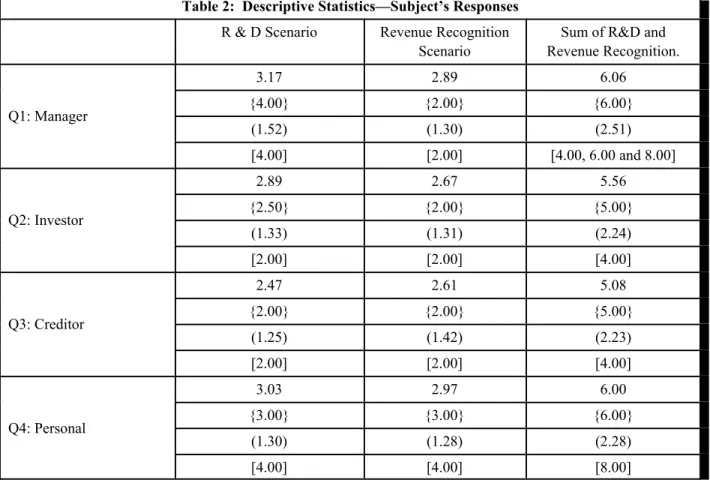
After reading each example, subjects were asked to respond to the five questions shown in Panel C of the Appendix. Three of the items asked them to take the perspective of a corporate manager, investor and creditor (respectively) and then rate the degree to which they believed rule-based versus principles-rule-based standards were preferable. Another item asked them for their personal belief on which type of standard is better. The final item asked them whether they agreed or disagreed with the idea that standards need to be a mixture of rules-based and principles-based standards. Descriptive statistics related to these questions is shown in Table 2.
Thirty-six upper-division and master’s level students were recruited to participate in the study. The age of participants ranged from 20 to 29 years of age with an average of 22.5 years. Sixty-six percent were males; 34 percent females. The majority were Undergraduate Accounting and Masters of Accounting students, with the remaining subjects primarily in the Masters of Business Administration program but with backgrounds in accounting.
Approximately half of the subjects were given the R&D example first, while the other half was given the revenue recognition example first to control for and analyze possible order effects. Overall, subjects answered the five questions consistently, regardless of the order of the scenarios. As shown in Table 3, there was a significant positive correlation between the answers given for each perspective (i.e., manager, inventor, or creditor) under the two scenarios. For example, the correlation between subject responses from the manager perspective across the two scenarios was significant (Pearson correlation = .571; p-value < .001, two-tailed). In addition, independent samples t-tests revealed no significant differences in mean responses for any question based on which order they saw the scenarios. Thus, we find no evidence of any “order” effects. In general, we also find that the type of scenario did not affect subjects’ responses. The exception was the response related to a manager’s perspective, described in the next paragraph. Overall, their beliefs of whether rules-based or principles-rules-based standards did not depend on the context, but there were differences with respect to the perspective (i.e., manager, creditor, or investor) subjects were asked to take. Given the highly significant correlation between subject answers to each respective question across the two scenarios, we summed their responses as shown in the fourth column of Table 2 labeled “Sum of R&D and Revenue Recognition.”
Table 2: Descriptive Statistics—Subject’s Responses
R & D Scenario Revenue Recognition Scenario
Sum of R&D and Revenue Recognition. Q1: Manager 3.17 2.89 6.06 {4.00} {2.00} {6.00} (1.52) (1.30) (2.51) [4.00] [2.00] [4.00, 6.00 and 8.00] Q2: Investor 2.89 2.67 5.56 {2.50} {2.00} {5.00} (1.33) (1.31) (2.24) [2.00] [2.00] [4.00] Q3: Creditor 2.47 2.61 5.08 {2.00} {2.00} {5.00} (1.25) (1.42) (2.23) [2.00] [2.00] [4.00] Q4: Personal 3.03 2.97 6.00 {3.00} {3.00} {6.00} (1.30) (1.28) (2.28) [4.00] [4.00] [8.00]
Table 2: Descriptive Statistics—Subject’s Responses
R & D Scenario Revenue Recognition Scenario
Sum of R&D and Revenue Recognition. Q5: Mixed 3.81 3.83 7.64 {4.00} {4.00} {8.00} (.95) (1.03) (1.73) [4.00] [4.00] [8.00]
NOTE: All cells contain mean, {median}, (standard deviation) and [mode]. N = 36 in all cells. The range for all individual responses (except Q5: R & D scenario) was 1 – 5. The range for Q5: R & D was 2 – 5. The range for all summed responses (except Q5) was 2 – 10. The range for Q5 (summed) was 4 – 10. Q1-Q5 refer to questions 1 – 5 shown in Panel C of the Appendix.
Table 3: Question Correlations Across Scenarios
Q1: R&D Q2: R&D Q3: R&D Q4: R&D Q5: R&D Q1: Revenue Recognition .571** (<.001) Q2: Revenue Recognition .029 .439** (.868) (.007) Q3: Revenue Recognition -.128 .083 .395* (.457) (.632) (.017) Q4: Revenue Recognition .577** .099 .276 .570** (<.001) (.564) (.103) (<.001) Q5: Revenue Recognition .329* .258 .240 .175 .521** (.050) (.128) (.158) (.308) (.001)
Cells contain Pearson correlation, (p-value, two-tailed); N= 36 ** Correlation is significant at the .01 level
* Correlation is significant at the .05 level
Q1-Q5 refer to questions 1 – 5 shown in Panel C of the Appendix.
The mean summed response to the question of whether rules-based or principles-based standards would be more appropriate from a manager’s perspective was 6.06, with a range of 2 to 10. Higher numbers indicate a preference for principles-based; lower numbers, rules-based. Our