Since January 2020 Elsevier has created a COVID-19 resource centre with
free information in English and Mandarin on the novel coronavirus
COVID-19. The COVID-19 resource centre is hosted on Elsevier Connect, the
company's public news and information website.
Elsevier hereby grants permission to make all its COVID-19-related
research that is available on the COVID-19 resource centre - including this
research content - immediately available in PubMed Central and other
publicly funded repositories, such as the WHO COVID database with rights
for unrestricted research re-use and analyses in any form or by any means
with acknowledgement of the original source. These permissions are
granted for free by Elsevier for as long as the COVID-19 resource centre
Contents lists available atScienceDirect
Medical Hypotheses
journal homepage:www.elsevier.com/locate/mehy
COVIDiagnosis-Net: Deep Bayes-SqueezeNet based diagnosis of the
coronavirus disease 2019 (COVID-19) from X-ray images
Ferhat Ucar
a,⁎, Deniz Korkmaz
baFirat University, Faculty of Technology, Department of Electrical and Electronics Engineering, Elazig 23119, Turkey
bMalatya Turgut Ozal University, Faculty of Engineering and Natural Sciences, Department of Electrical Engineering, Malatya 44210, Turkey
A R T I C L E I N F O Keywords:
Coronavirus Disease 2019 SARS-CoV-2
Rapid Diagnosis of COVID-19 Deep Learning
Bayesian Optimization
A B S T R A C T
The Coronavirus Disease 2019 (COVID-19) outbreak has a tremendous impact on global health and the daily life of people still living in more than two hundred countries. The crucial action to gain the force in thefight of COVID-19 is to have powerful monitoring of the site forming infected patients. Most of the initial tests rely on detecting the genetic material of the coronavirus, and they have a poor detection rate with the time-consuming operation. In the ongoing process, radiological imaging is also preferred where chest X-rays are highlighted in the diagnosis. Early studies express the patients with an abnormality in chest X-rays pointing to the presence of the COVID-19. On this motivation, there are several studies cover the deep learning-based solutions to detect the COVID-19 using chest X-rays. A part of the existing studies use non-public datasets, others perform on com-plicated Artificial Intelligent (AI) structures. In our study, we demonstrate an AI-based structure to outperform the existing studies. The SqueezeNet that comes forward with its light network design is tuned for the COVID-19 diagnosis with Bayesian optimization additive. Fine-tuned hyperparameters and augmented dataset make the proposed network perform much better than existing network designs and to obtain a higher COVID-19 diag-nosis accuracy.
Introduction
Coronavirus outbreak continues to surprise the world. To date, over one million people across the two hundred countries have been infected according to the last updates of the World Health Organization (WHO). Approximately sixty thousand confirmed deaths among the cases are reported[1]. Humanity had not faced a pandemic through the history that spreads rapidly all over the earth. If a defined brand new virus is able to spread from person to person while infecting the contacts easily with a sustained and efficient way, then it is called a pandemic. The novel coronavirus (2019-nCoV) fulfills all those definitions strongly. At the end of the year 2019, Wuhan city of China cradled thefirst case of the novel coronavirus. Now from Europe to America, its deadly effects threaten the whole world. The WHO named the 2019-nCoV epidemic disease on February 11, 2020 as Coronavirus Disease 2019 (COVID-19). 2019-nCoV is a new member of the Severe Acute Respiratory Syndrome coronavirus family (SARS-CoV) and labeled as SARS-CoV-2[2].
With its spike surface for binding to receptors (seeFig. 1), SARS-CoV-2 presents the COVID-19 with the symptoms of fever, sore throat and following pneumonia with severe acute respiratory distress. [3]. For all that, the respiratory symptoms are not in a specific form. There
are so many isolated cases i.e. the existence of the COVID-19 may not appear at thefirst clinical symptoms[4]. The rapid spreading nature of the coronavirus and the serious respiratory effects to humans make the diagnosis of the COVID-19 an urgent situation[5]. Today, health spe-cialists use the Reverse Transcription Polymerase Chain Reaction (RT-PCR) test for the detection of the nucleic acid forms stem from the SARS-CoV-2. In the process, the respiratory specimens (such as or-opharyngeal swabs or nasor-opharyngeal sampling) are collected and the very important issue when doing this is the receipt place of the speci-mens. The operation is categorically open to malfunctions by the expert mistakes[6]. Besides the operation procedure, the PCR test is a time-consuming process. Because a patient has to be isolated in non-suitable circumstances for hours until getting the test results. In addition, these types of tests have a low detection rate of between 30 and 50%. Hence, most of the times they need to be repeated to make a confirmation[7]. To be able to procure an atmosphere where the patients could get quick treatment and care is a crucial task in thefight of the COVID-19. Because of the fast-spreading essence of the pandemic, patients apply to the health center in batches. At this point, the need for rapid diagnosis methods is a very important issue. For monitoring the SARS-CoV-2 in-fections to diagnose, there is another option of visualization using the
https://doi.org/10.1016/j.mehy.2020.109761
Received 11 April 2020; Accepted 21 April 2020
⁎Corresponding author.
E-mail address:fucar@firat.edu.tr(F. Ucar).
0306-9877/ © 2020 Elsevier Ltd. All rights reserved.
radiological images, for instance, chest X-rays or Computed Tomography (CT). Former studies prove that COVID-19 causes ab-normalities that are visible in the chest X-rays and CT images, in the form of ground-glass opacities. With a strong suggestion, a diagnostic with radiological images could be afirst step in monitoring the COVID-19 [9]. Although the radiological images based diagnostic is a faster way and also it has some advances over the PCR testing in terms of the detection rate in earlier stages of the COVID-19, the backbone of the system is the need of experts in comprehending the images. In-trinsically, Artificial Intelligence (AI) based diagnostic options can en-courage the experts to gain a rapid and accurate explication over the X-ray images on the way of the detection of the COVID-19[10].
For this motivation, there are several studies in the literature in-cluding the analysis conducted on AI-based diagnostic of the COVID-19 with the help of the radiological images[11-15]. In[15], the authors propose a transfer learning model that processes a dataset including the CT images of the COVID-19 infected patients. They obtain a test accu-racy of 79.3%. The study[14]indicates a three-class model that can distinguish the COVID-19, Influenza-A viral-based pneumonia, and healthy cases. The segmentation-based study reaches the 86.7% accu-racy value with the CT images dataset. In[13], the authors propose a rapid AI development cycle using a deep learning-based CT image analysis. Heretofore, the mentioned studies in the literature use non-public datasets through developing a deep learning-based diagnostic of the COVID-19. The studies[11]and[12]provides public datasets in-cluding the COVID-19 X-ray images of infected patients. In[11], the authors propose a combined public dataset besides a deep learning model called COVID-Net for the detection of COVID-19. COVID-Net architecture relies on a tailored Convolutional Neural Network (CNN) model which uses the chest X-rays as inputs. The authors reach a test accuracy of 92.4% with restricted COVID-19 class images. In our study, we use the same dataset of the[11]to be able to outperform the ex-isting COVID-Net accuracy in detecting the COVID-19. In addition, there are several more studies that we can consider in COVID-19 de-tection using chest X-rays[16-19]. With a detailed pre-processed da-taset, our study captures the flag with a specially designed deep learning model.
The usage of deep learning models in medical image processing and analysis is a challenging topic in the AIfield[10,20]. In[21], the au-thors propose a CNN model for pneumonia detection. The auau-thors of the study[22]propose a vessel extraction from the fundus images. In[23], an expert system is proposed for brain tumor detection in high-re-solution brain magnetic resonance images. To this end, in our study, we use a specially designed deep learning model called SqueezeNet first proposed in[24]. The proposed deep learning model for the diagnostic of the COVID-19 is based on SqueezeNet architecture, as because it has a smaller structure, compared to the well-known pre-trained network designs[25,26].
In this study, we introduce a COVID-19 detection AI model, COVIDiagnosis-Net, based on deep SqueezeNet with Bayes optimiza-tion. With a view to obtain a higher accuracy rate, the hyper-parameter optimization of the deep learning models is a crucial task[27]. The backbone of the proposed model i.e. the dataset is a public dataset that is detailed in[11]. Differently from the study[11], we perform a multi-scale augmentation process to overcome the imbalance problem of the proposed public dataset. Since the focus is on COVID-19 diagnosis, we perform a detailed offline augmentation process for the limited number of COVID-19 infected chest X-rays of the patients. With the help of the offline well-defined augmentation process and Bayes-SqueezeNet, our proposed diagnostic model for COVID-19 outperforms the COVID-Net [11]while reaching a test accuracy of0.983. In building our model, we first perform a detailed augmentation. After obtaining the augmented dataset, the data split is generated on the shuffled database to form the train, validation and test datasets. We manage the training process of the deep SqueezeNet while performing a Bayes optimization with the validation phase at the same time. Through the training, the best model is determined and thefinal network design is tested with the separate test dataset package. On through those developments, the proposed deep Bayes– SqueezeNet obtains a higher detection rate in the diag-nosis of the COVID-19 using the chest X-ray images.
Herein, we can describe the contributions of our proposed model as listed below:
1) Presents a novel model for the rapid diagnostic of the COVID-19 based on deep Bayes-SqueezeNet called COVIDiagnosis-Net, 2) Overcomes the imbalance problem of the public dataset, a
multi-scale offline augmentation is performed,
3) Proposes an easy to implement deep learning network for embedded and mobile systems that could aid the health experts for a stable diagnosis of the COVID-19 in the control of the current epidemic. The composition of the rest of the article is as follows: Section 2 describes the materials and methods with details of the proposed deep Bayes-SqueezeNet along with the model components i.e. SqueezeNet architecture, Bayesian optimization, and dataset description. Section 3 presents the explanation of what we design in experiments with eva-luation criteria,findings, and a comparison sub-section to draw the big picture of where our study stands among the other state-of-the-art methods. Finally, Section 4 briefs a conclusion of the study.
Materials and methods
CNN models achieve human-like accuracies in image classification problems due to their self-learning abilities and superior classification results on multi-class problems. A convolution network occurs from a chain of a convolution layer (Conv) with a rectified linear unit (ReLu) Fig. 1. Three-dimensional medical image representing the shape of the coronavirus[8].
activation functions, pooling layers (Pool) and batch normalization operation. CNNs are coordinated versions of multilayer perceptrons and each neuron in a layer is related to all neurons in the next layer. Layers convolute inputs with kernels andfilters of the convolutions increase across the whole visualfield. These processes compose more complex patterns using smaller and simpler patterns depending on the hier-archical patterns. Therefore, the hierhier-archical network structure pro-vides high-level feature maps, reduced computation complexity and improved generalization ability[22,28,29]. Considering these types of characteristics, Bayesian optimization based deep SqueezeNet archi-tecture for diagnostic of COVID-19 disease from X-ray images is pro-posed in this paper.
The main purpose of our framework is to provide distinctive visual properties as well as a rapid diagnostic system able to classify those properties on new COVID-19 X-ray images. This method may also be helpful for clinicians because it may be quickly decided which treat-ment plan to use depending on the type of infection. The following sections describe the proposed method, deep SqueezeNet architecture, Bayesian optimization, dataset description and offline augmentation techniques in detail.
Proposed method: Deep Bayes-SqueezeNet based COVIDiagnosis-Net The overall architecture of the deep Bayes-SqueezeNet based rapid diagnostic system is presented inFig. 2. The proposed system is com-posed of three main stages as offline augmentation of the raw dataset, training of the Bayesian optimization-based SqueezeNet model and decision-making of the network with the testing phase. The proposed method classifies the three-class X-ray images labeled as Normal (no infection), Pneumonia (bacterial or none-COVID viral infection) and Covid (COVID-19 viral infection).
In thefirst stage, the offline augmentation method is utilized to the raw input x-ray images due to their uneven sample distributions. This method is preferred for smaller classes with fewer sample numbers in order to increase the size of the classes by a transformation factor. After
the augmentation, the augmented dataset is divided into three subsets as train, validation and test sets. Train and validation sets are set as the input of the training and optimization stage. The test set is used for the testing input. In the training and optimization stage, the SqueezeNet convolution network is utilized and it uses the squeeze and expands layers of thefire modules to construct a smaller and more effective CNN architecture. SqueezeNet is a trained CNN model and it is pre-trained on the ILSVRC-12 challenge ImageNet dataset [30,31]. This supporting dataset is completely different from X-ray images and the SqueezeNet model needs to befine-tuned to classify the COVIDx classes. In order to obtain the best decision-making model, the CNN network is optimized with the Bayesian-based method, which is a sequential de-sign strategy, during training. A validation error is used to update the optimization process. Finally, the best SqueezeNet model is obtained and used for the decision-making process with the test set. The obtained best network model classifies the infection classes and classification performances are determined.
SqueezeNet architecture
SqueezeNet is a convolution network that executes better perfor-mance than AlexNet with 50x fewer parameters[23,24,30]. SqueezeNet consists offifteen layers with five different layers as two convolution layers, three max pooling layers, eightfire layers, one global average pooling layer, and one output layer softmax. The architecture of the network is given inFig. 3.
As shown inFig. 3, K × K notation represents the receptivefield size of thefilters, s denotes the stride size and l is the feature map length, respectively. The input of the network has 227 × 227 dimensions with RGB channels. The input images are generalized by convolution and max pooling is applied. Convolution layer convolutes between the weights and small regions in the input volumes, with 3 × 3 kernels. Each convolution layer performs an element-wise activation function as the positive part of its argument. SqueezeNet utilizes from the fire layers, which constructed of squeeze and expansion phases, between
COVID-19 Normal Pneumonia
COVIDx Dataset Offline Augmentation
Obtained Best Model
Update Process Model Hyper Parameters Bayesian Optimization U pda te Augmented Dataset
Decision-Making of the Proposed Bayes-SqueezeNet
V alid atio n Er ro r Deep-SqueezeNet Trainig and Optimization
Testing Train Set Validation Set Test Set Conv + ReLu Max Pool Fire Softmax
the convolution layers. The output tensor scale and input of thefire are consistent. The squeeze phase uses the filter of size 1 × 1, whereas expansion uses thefilters of size 1 × 1 and 3 × 3. Firstly, the input tensor H × W × C passes through the squeeze and the number of convolution is equal to C/4 of the number of input tensor channels. After thefirst phase, the data passes through the expansions and depth of the data is expanded to C/2 of the output tensor depth. Both squeeze and expansion phases are connected to the ReLu units. The squeeze operation compresses the depth, and expansion increases the depth by keeping the same feature size. Finally, expansion outputs are stacked in the depth dimension of input tensor with concatenate operation.Fig. 4 summarizes thefire layer and sub-operations. Assuming FM and C de-fine the feature maps and channels, the output layer f{y} of the squeeze operation with the kernel w can be expressed as[32]:
∑ ∑
= = = f y{ } w x fm FM c C cf cfm 1 1 1 1 (1) Here, f y{ }∈N andw∈C× ×1 FM2. The squeeze outputs can be defined as a weighted combination of the feature maps of the different tensors. In the network, max pool layers execute a down-sampling op-eration along the spatial dimensions and global average pool convert the feature maps of the classes into one value. At the end of the net-work, softmax activation function gives the multiclass probability dis-tributions.Table 1presents the detailed layer configuration of the SqueezeNet architecture. The motivation for designing the SqueezeNet architecture in COVID-19 diagnosis is that the network provides three main
advantages[23,24]: 1) The network is more efficient because it has fewer parameters, 2) Applications developed for this network are easy to move and require less communication, 3) It has a model size of less than 5 MB and it is easy to implement to embedded systems. Bayesian optimization
Hyperparameters have a key role in both machine learning and deep learning algorithms inasmuch as those parameters are tightly managing the acts of the training algorithms and they affect the performance of the models significantly. Therefore, the optimization of hyperpara-meters is a crucial task, especially when it comes to deep learning in medical image processing. In general, there exist two ways of hy-perparameters optimization called manual and automatic searching. The manual searching as the name suggests looks for the hyperpara-meters by hand. Hence, manual searching requires expertise. Unfortunately, when dealing with big data and so many model para-meters for tuning, even expertise may be insufficient[27,33]. To handle the difficulties of manually searching, automatic searching alternatives take place in the literature. Grid search and random search algorithms can be considered in this topic. Nevertheless, there are still problems remaining in both methods such as the curse of dimensionality, and unavailability of the highly efficient performance with the time-con-suming operations[27,34].
Tuning of hyperparameters is such an optimization problem that the objective function of it is latent and unknown, in other words, it is a black-box function. As its name suggests, stemming from the Bayesian theorem, the Bayesian optimization is an efficient algorithm dealing with such kind of optimization problem[27,35]. Bayesian optimization relies on a typical kind of approximation. Dealing with an unknown function requires an approximation with the help of some known samples i.e. prior knowledge. It is like the concept of the posteriori probability. Here, the food of the algorithm is observations generated by the model evaluations in which the outputs of the online learning. This means that, in Bayesian optimization, we need a training process. During the training, the model will trace a function that we only have its knowledge from the learned data. In the center of the Bayesian optimization algorithm, the main purpose is to obtain the related hy-perparameters that make learning outline maximum[36]. In mathe-matical expression, we can consider a global maximization or mini-mization problem of the black box (unknown) function f ,
= ♢
∈ x arg max ( )f x
x X (2)
Here,X stands for a searching space ofx . Caused by the nature of the Bayes’ theorem[35], Bayesian optimization calculates the poster-iori probabilityP D L( | )of a modelDwith the aid of the learned data L. Posteriori probability is proportional to the likelihood P L D( | ) of ob-servations L and the multiplication of the prior probabilityP D( ): Output Depth N Conv + ReLu K×K í s K×K í s Fire K×K í s Max Pool K×K×l
Global Avpool Softmax
K×K Stage 1
64
3×3
í
2
128
1×1
í
1
3×3
í
1
3×3
í
2
3×3
í
2
3×3
1
3×3
í
2
3×3
1
3
1×1
í
1
1×1×3
3
1×1
6 e g a t S 5 e g a t S 4 e g a t S 3 e g a t S 2 e g a t S227×227 I
m
age
128
1×1
í
1
3×3
í
1
256
1×1
í
1
3×3
í
1
3
×
3
í
1
256
1×1
í
1
3×3
í
1
384
1×1
í
1
3×3
í
1
3
×
3
í
1
384
1×1
í
1
3×3
í
1
512
1×1
í
1
3×3
í
1
512
1×1
í
1
3×3
í
1
Fig. 3. Details on the designed SqueezeNet architecture.
Concatenate
Conv 1×1, C/2
Input Tensor
H×W×C
Conv 1×1, C/4
Conv 3×3, C/2
Squeeze
Phase
Expansion
Phase
H×W×C
∝
P D L( | ) P L D P D( | ) ( ) (3)
Eq.(3)reflects the main behavior of the Bayesian optimization[27]. In brief, Bayesian optimization searches for the best model amid many of them. At this point, one can recall the cross– validation method. However, it is very hard tofind the best model in many samples of pre-listed hundreds of alternatives. Thus, Bayesian optimization accelerates the operation by reducing the computational cost, and we do not need expertise to guess the outputs though[37]. The algorithm combines the prior distribution of the f x( )function with the samples of the prior knowledge to obtain the posteriors. Those posteriors calculate the value which describes the maximization point of the f x( ). Herein, the cri-terion of the maximization process is the expression called acquisition function. We introduce a pseudo-code format of Bayesian optimization via Algorithm 1 table. In the algorithm,N1:i−1={ ,xn yn n}i−=11reflects the training dataset, which includes −i 1 observations of the f function.
In theflow, we can clarify the two basic parts of the algorithm: 1) it updates the posterior distribution and 2) it maximizes the acquisition function. Bayesian optimization process continues repeatedly until the defined maximum iteration value is reached. Alternatively, it can also be quitted when it catches a threshold value, which is the difference between the actual value and the obtained optimal value[27,36].
Algorithm 1: Bayesian optimization
1: for =i 1, 2,⋯,do
2: Search xivia optimizing the acquisition function υ,
= −
xi argmax ( |ν x N )
x i
1: 1
3: Evaluate the objective function:yi=f x( )i
4: Augment dataN1:i={N1:i−1, ( ,x yi i)}
Update the model
5: end for
In the proposed deep Bayes-SqueezeNet model, the most important hyperparameter of the deep network design called “initial learning rate” is optimized beside the L2-regularization and the momentum values. We also provide a validation dataset to be able to track the
validation error (object function) in the online training. (Pleasefind the experiment details of the Bayesian optimization in Section 3.)
Dataset description
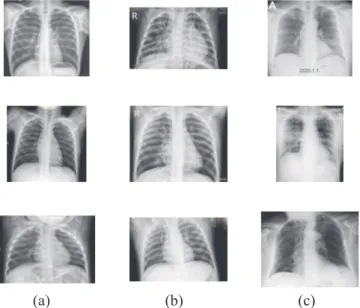
As declared before, the general detection method for COVID-19 disease is the RT-PCR testing that identifies SARS-CoV-2 RNA from sputum or nasopharyngeal swab. However, RT-PCR testing has a long time complex process and it is very troublesome[6]. Another detection method is chest radiography imaging due to the abnormalities in chest X-ray images of patients infected with COVID-19[2,11]. Therefore, we have selected a distinctive and public dataset including chest X-ray images to respond to the need for a rapid disease diagnosis system[11]. In order to compose a special COVID-19 dataset, two different publicly available datasets were combined as COVID chest X-ray dataset[12] and Kaggle chest X-ray pneumonia dataset[38]. The obtained COVIDx dataset[11]consists of a total of 5949 posteroanterior chest radio-graphy images for 2839 patient cases. The dataset includes 1583 normal, 4290 pneumonia and 76 COVID-19 infection cases. In the pneumonia samples, diseases were caused by none-COVID-19 viral and bacterial effects. Considering the number of cases, there are a total of 1203 uninfected normal patients, 1591 pneumonia cases with none-COVID-19 and 45 none-COVID-19 patient cases. The dataset includes three classes andFig. 5shows a batch of images that are randomly selected from class samples. The images are transformed to RGB with 8-bit depth and have variable pixel-based resolution values.
The main purpose of the selection of COVIDx dataset is that it is public available, so it is accessible for researchers and to be extensible. Therefore, further studies based on this database may be more helpful in the diagnosis and treatment of COVID-19 cases.
Table 1
Detailed layer configuration of the designed network.
Layer Type Kernel Size Stride Padding Output Size
Input – – – – 227 × 227 × 3
Conv1 {Conv + ReLu} 3 × 3 2 0 113 × 113 × 64
Pool1 Max Pool 3 × 3 2 0 56 × 56 × 64
Fire2 {Squeeze + ReLu-Expand + ReLu-Concat} {Expand + ReLu}//2 1 × 1 3 × 3 1 1 0 1 56 × 56 × 16 56 × 56 × 64 56 × 56 × 128 Fire3 {Squeeze + ReLu-Expand + ReLu-Concat}
{Expand + ReLu}//2 1 × 1 3 × 3 1 1 0 1 56 × 56 × 16 56 × 56 × 64 56 × 56 × 128
Pool3 Max Pool 3 × 3 2 0 28 × 28 × 128
Fire4 {Squeeze + ReLu-Expand + ReLu-Concat} {Expand + ReLu}//2 1 × 1 3 × 3 1 1 0 1 28 × 28 × 32 28 × 28 × 128 28 × 28 × 256 Fire5 {Squeeze + ReLu-Expand + ReLu-Concat}
{Expand + ReLu}//2 1 × 1 3 × 3 1 1 0 1 28 × 28 × 32 56 × 56 × 128 56 × 56 × 256
Pool5 Max Pool 3 × 3 2 0 14 × 14 × 256
Fire6 {Squeeze + ReLu-Expand + ReLu-Concat} {Expand + ReLu}//2 1 × 1 3 × 3 1 1 0 1 14 × 14 × 48 14 × 14 × 192 14 × 14 × 384 Fire7 {Squeeze + ReLu-Expand + ReLu-Concat}
{Expand + ReLu}//2 1 × 1 3 × 3 1 1 0 1 14 × 14 × 48 14 × 14 × 192 14 × 14 × 384 Fire8 {Squeeze + ReLu-Expand + ReLu-Concat}
{Expand + ReLu}//2 1 × 1 3 × 3 1 1 0 1 14 × 14 × 64 14 × 14 × 256 14 × 14 × 512 Fire9 {Squeeze + ReLu-Expand + ReLu-Concat}
{Expand + ReLu}//2 1 × 1 3 × 3 1 1 0 1 14 × 14 × 64 14 × 14 × 256 14 × 14 × 512
Conv10 {Conv + ReLu} 1 × 1 1 0 14 × 14 × 3
Pool10 Global Average Pool – – – 1 × 1 × 3
Offline augmentation
In the classification process of both classical machine learning and deep learning algorithms, the imbalance ratio of the class distribution of the dataset has a huge impact on the performances of the models. In the study[39], the authors conduct systematic research on how im-balance data affects the classification performance of CNN. The findings of the study point out a detrimental effect of the imbalanced class distribution on classification performance. In our dataset, there are very few COVID-19 class images compared to the other classes. To overcome this unfavorable situation, we perform a detailed offline augmentation over the COVID-19 class images in our dataset. Firstly, we obtain the mirrored version of the original images byflipping each image. Then, the listed augmentation technics are applied to both original and flipped images.
1) Noise: Adding Gaussian noise to images, 2) Shear: Shearing the images in affine form,
3) Brightness decrease: Decreasing the brightness of the images by subtracting 30 from every pixel,
4) Brightness increase: Increasing the brightness of the images by adding 30 to every pixel.
AsFig. 6describes, we obtain twelve different images from a single image with the aid of the augmentation techniques and their combi-nations. The same operations depicted inFig. 6are also implemented to the flipped images, which are the mirrored versions of the original images. At the end of the day, we gain twenty-four different images for a single image. Thus, the number of images in the COVID-19 class is augmented offline in the pre-processing of the dataset resulting in an acceptable amount.Fig. 7shows a sample image both in original and flipped (mirrored) version.
Experiments
In this section, the experimental setup and the evaluation of the proposed deep Bayes-SqueezeNet based rapid diagnosis system are presented. The impact of the proposed method on its accuracy and evaluation metrics are discussed with the computational efficiency. All the experiments are performed in MATLAB environment running on a workstation with 2.1 GHz dual Intel Xeon E5, Quadro M4000 8 GB GPU and 32 GB RAM memory. The remainder of the section includes the
definitions of the evaluation metrics, findings of the experimental re-sults and comparison of the state-of-the-art methods, respectively. Evaluation metrics
In order to evaluate the quantitative performance of the proposed method, such evaluation metrics Accuracy (Acc), Correctness (COR), Completeness (COM), Specificity (SPE), F1 score and Matthew Correlation Coefficient (MCC) are statistically computed from the confusion matrix. Acc measures the classification performance, COR gives the rate of the truly classified X-ray images among the classes while COM defines the truly detected negative images. SPE represents the correctly classified the rate of opposite disease classes. F1 is a harmonic average and gives the combination of COR and COM. MCC measures the quality of the classification performance. According to the confusion matrix, the selected evaluation metrics are defined as:
= + + + + N N N N N N Acc TP TN TP FP TN FN (4) = + N N N COR TP TP FP (5) = + N N N COM TP TP FN (6) = + N N N SPE TN TN FP (7) = × × + F1 2 COR COM COM COR (8) = × − × + × + × + × + N N N N N N N N N N N N MCC ( ) ( ) ( ) ( ) ( ) ( ) TP TN FP FN TP FP TP FN TN FP TN FN (9) Here, NTP,NTN,NFP,NFN define the number of correctly classified diseases, number of correctly classified opposite classes, number of incorrectly classified diseases and number of the misclassified diseases, respectively. The classification procedure proves and determines the robustness, effectiveness and generalization ability of the proposed method using the aforementioned evaluation metrics.
Experimental results
In the experimental setup,firstly we perform an offline augmenta-tion to the raw COVIDx dataset. After the pre-processing, the aug-mented dataset is divided into three packages as training, validation and testing sets. The triple split of the dataset packages is formed as 80% for training, 10% for validation and 10% for testing. Training and validation datasets are designed for the Bayesian optimization-based online learning structure. As because of the Bayesian contribution of our model, it needs a validation result to minimize the objective func-tion error. After the Bayesian optimizafunc-tion-based online training pro-cess, we reach the best network model to implement the testing phase. With a separate test dataset, the obtained best model is evaluated. All the input images are resized to 227 × 227 pixel size and transformed to RGB with 8-bit depth. In the meantime, all the dataset packages are shuffled to overcome the negative effect of the overfitting. Thus, we reach a robust decision-making performance for the classification of the infected patient cases. In the training process, mini-batch size is given as 32 and all images are normalized with the mean subtracting opera-tion.
Table 2shows the class distribution of the raw and augmented da-taset. In the pre-processing, we achieve 1536 images after the aug-mentation of COVID-19 class. Since other classes have sufficient images each, we perform the augmentation to just Covid class. We also provide a balanced datasetfixing the all class image numbers to 1536 samples to gain a robust training performance of the model. Briefly, our offline
(a)
(b)
(c)
Fig. 5. Randomly selected COVIDx X-ray samples: (a) Normal, (b) Pneumonia, (c) COVID-19.
augmentation model enhances the Covid class approximately 20 times. In our proposed model, we improve the existing dataset by increasing the Covid class images.
Proposed deep Bayes-SqueezeNet includes the Bayesian optimiza-tion in the training stage with validaoptimiza-tion process. The objective funcoptimiza-tion of the optimization process is given in Fig. 8. It can be seen that function evaluation ends with 35 iterations because of the model sa-turation. At the end of the 10th iteration, the minimum observed ob-jective is achieved to construct the best model.
The optimized parameters i.e. initial learning rate (InitialLearnRate), momentum, and L2 Regularization are listed in Table 3along with iterations, model result, run time and observed -estimation values of the objective function. During the optimization process, it is clearly seen that after catchingfive different best models, Bayesian optimization points out the model of the 10th iteration as selected “best model”. After the training process, the obtained best model parameters are used in the proposed deep Bayes-SqueezeNet network and highlighted inTable 3.
In order to evaluate the effectiveness of our augmentation im-provement, wefirst present the raw dataset results. Here, our aim is to prove the negative effect of the imbalance distributions in the raw dataset over the performance. It should be noted that we tune the SqueezeNet with the best model parameters for a regular training process. The re-training and testing processes are performed with the train and test packages of the related dataset, please seeTable 2.Fig. 9
Noise
Shear
Shear + noise
Brightness
decrease
Noise
Shear
Shear + noise
Brightness
increase
Noise
Shear
Shear + noise
Original image
Fig. 6. Offline augmentation: A demonstration on original image.
Flipped
Original
Fig. 7. Original image and itsflipped version.
Table 2
COVIDx Dataset class distributions.
Raw Dataset Augmented Dataset
No Class Label Train Validation Test Train Validation Test
1 Covid 66 – 10 1229 154 153
2 Normal 1349 – 234 1229 154 153
3 Pneumonia 3895 – 395 1229 154 153
0 5 10 15 20 25 30 35
Function evaluations
0.01 0.02 0.03 0.04 0.05 0.06 0.07Min objective
Min objective vs. Number of function evaluations
Min observed objective Estimated min objective
Fig. 8. Bayesian optimization - objective function tracking.
Table 3
Bayesian optimization iteration results with model parameters.
Iter Result Objective Run Time (s) Observed Estimation InitialLearn Rate Momentum L2Regularization
1 Best 0.032468 2272.7 0.032468 0.032468 0.0012837 0.87056 1.81E-06 2 Accept 0.66667 2262 0.032468 0.065569 0.025992 0.83518 0.0037856 3 Accept 0.66667 2277.4 0.032468 0.032531 0.017693 0.80247 8.26E-06 4 Best 0.028139 2258.6 0.028139 0.028157 0.0001101 0.81225 0.00045464 5 Best 0.025974 2266.2 0.025974 0.025902 0.00040989 0.88376 6.65E-06 6 Best 0.02381 2274.5 0.02381 0.023529 0.00076553 0.83936 0.0035748 7 Accept 0.028139 2269.2 0.02381 0.023379 0.00019459 0.84492 0.00036228 8 Accept 0.030303 2273.2 0.02381 0.025605 0.0009296 0.87648 1.70E-06 9 Accept 0.030303 2277.9 0.02381 0.02698 0.00056948 0.81638 1.16E-05 10 Best 0.019481 2277.6 0.019481 0.021372 0.00029383 0.88203 0.00022577 11 Accept 0.036797 2275.4 0.019481 0.025349 0.00029004 0.82578 5.16E-05 12 Accept 0.034632 2285.1 0.019481 0.026358 0.00010122 0.8988 2.59E-05 13 Accept 0.028139 2277.4 0.019481 0.026446 0.00015502 0.86513 0.0081237 14 Accept 0.036797 2293.7 0.019481 0.027786 0.00087009 0.89525 0.0056389 15 Accept 0.032468 2252.8 0.019481 0.028436 0.00040269 0.87339 0.00048719 16 Accept 0.036797 2311.4 0.019481 0.0285 0.00015923 0.88656 2.72E-06 17 Accept 0.02381 2312.7 0.019481 0.02726 0.00026917 0.89282 0.00046382 18 Accept 0.02381 2289.3 0.019481 0.026458 0.00026301 0.88663 0.0014638 19 Accept 0.66667 2149.5 0.019481 0.023422 0.099966 0.84025 1.23E-06 20 Accept 0.028139 2329.2 0.019481 0.026443 0.0010675 0.80008 0.0038983 21 Accept 0.33333 2308.4 0.019481 0.026572 0.0042908 0.89651 1.02E-06 22 Accept 0.59307 2331.9 0.019481 0.02079 0.0022645 0.86662 0.0087526 23 Accept 0.02381 2291.2 0.019481 0.020999 0.00065536 0.899 1.17E-06 24 Accept 0.02381 2351.4 0.019481 0.024937 0.0001248 0.89723 0.0021482 25 Accept 0.028139 2205.2 0.019481 0.023971 0.00022965 0.84862 0.00011305 26 Accept 0.030303 2337.2 0.019481 0.025463 0.0011636 0.89847 1.69E-06 27 Accept 0.66667 2362.9 0.019481 0.021554 0.0071359 0.82765 0.00016296 28 Accept 0.025974 2356.6 0.019481 0.021647 0.00094407 0.8011 0.00010491 29 Accept 0.032468 2339.6 0.019481 0.021141 0.00010048 0.89832 0.0069219 30 Accept 0.034632 2377.5 0.019481 0.022613 0.00033962 0.8959 2.41E-06 31 Accept 0.02381 2397.9 0.019481 0.021599 0.00048047 0.8965 8.22E-06 32 Accept 0.021645 2383.8 0.019481 0.021614 0.0011022 0.80386 1.12E-06 33 Accept 0.025974 2395.4 0.019481 0.022638 0.00082936 0.80318 0.0084898 34 Accept 0.032468 2388.1 0.019481 0.021811 0.00070627 0.80414 2.20E-06 35 Accept 0.034632 2299.5 0.019481 0.022807 0.00049401 0.8699 1.03E-06
demonstrates the confusion matrix of the test process of the re-trained SqueezeNet. In the confusion matrix presentation, accuracies and errors of each row and columns are given as the percentage value in the lower and right cells, respectively. The accuracy rates of each column show us the correctness value of each class and the accuracy values for each row state the single accuracy values of the classes.
As shown in Fig. 9, the false classification rate appears majorly within Normal and Pneumonia. Pneumonia class achieves nearly the perfect classification whereas Covid class has 70% accuracy within 10 test samples. In the Normal class distribution, 141 samples are mis-classified as Pneumonia. This situation shows the negative effect of the imbalanced distribution of the dominant Pneumonia class.
In Table 4, we can see the detailed classification results of the SqueezeNet for the raw dataset. The obtained results show that Normal class has the lower values of Acc, COM, and F1 as 38.89%, 38.89%, and 55.83%, respectively. The model with the raw dataset just reaches the 76.37% overall accuracy and 70.00% single accuracy value of the Covid class. While the highest accuracy is presented by Pneumonia class, the lower values of MCC and SPE in Pneumonia point out poor classifica-tion performance.
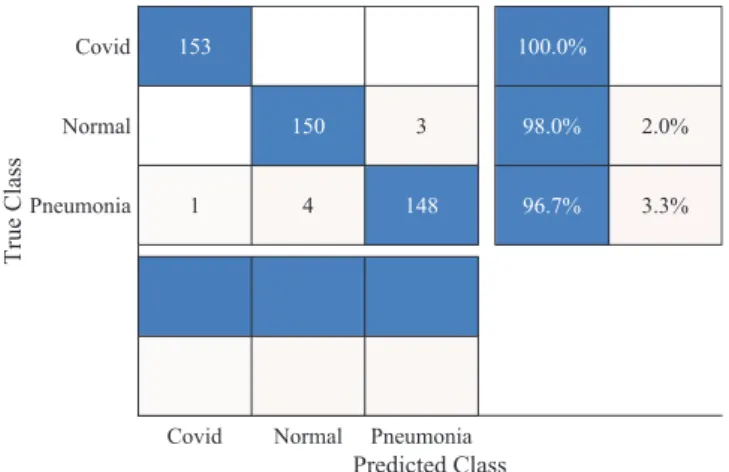
The second phase of our experiments is performing the augmented dataset testing process. In this phase, the proposed deep Bayes-SqueezeNet model, which is obtained by the Bayesian optimization approach, is validated with the separate test dataset. It should be noted that the obtained best model is trained with the augmented dataset to overcome the above-mentioned imbalance effects as well as achieving a rapid system for COVID-19 diagnosis with a robust and sustainable structure.Fig. 10presents the confusion matrix of the test phase. Here, we can see a tremendous performance boosting on all classes and overall accuracy. The deep Bayes-SqueezeNet model catches all the Covid samples in the X-rays, perfectly. There are just eight misclassified samples among 459 test samples. The error rate of the Normal class is 2% while it is 3.3% in Pneumonia. In addition, the most mis-classification rate is presented by Pneumonia.
We can interpret the detailed test results fromTable 5. In the de-cision-making system, Covid class reaches the perfect classification rate as showing the 100% test accuracy and completeness values. F1 and MCC values also prove that it is obtained a stable classification. The
overall accuracy is 98.26% with a COM of 98.26%, it draws a picture that our model is well-trained and robust. Although Pneumonia accu-racy decreases to 96.73% compared to former experiments, all other performance criteria of the related class are boosted and exhibit an effective prediction. The classification performance of the Normal class is visibly enhanced and it reaches to 98.04% Acc value.
In order to analyze the performance comparison between the ex-periments of the raw dataset and the augmented one, we report the increase rates of the performance values as inFig. 11. The sharp bounce is experienced in the Normal class by a boosting of 2.5 times. As it is the focus of our model, when we concentrate on the performance of the Covid then we detect 2.5 times boosting. In Pneumonia class, there is a decreasing percentage of 2.06% considering just the accuracy value. The overall accuracy rate has also a performance increasing at the rate of 28.66%. The overall accuracy rate has also a performance increase at a rate of 28.66%.
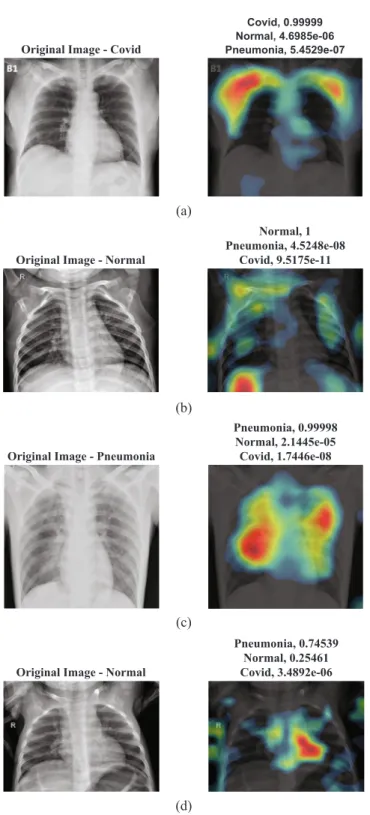
For a detailed visual analysis, we provide a class activation mapping images as shown inFig. 12. Class activation mapping is a way of gen-erating visual explanations of the predictions of deep learning models. Misclassified or unreasonable predictions sometimes can rely on rea-sonable explanations. By the aid of the class activation mapping, we can investigate useful knowledge of the prediction regions. Activation mapping also defines the bias regions in the training images. The first Covid Normal Pneumonia
Predicted Class Covid Normal Pneumonia True Class 7 2 4 91 1 3 141 390 70.0% 38.9% 30.0% 61.1% 1.3% 98.7% 53.8% 46.2% 1.1% 73.0% 27.0% 98.9%
Fig. 9. Confusion matrix of the re-trained SqueezeNet with raw dataset.
Table 4
Classification results of the re-trained SqueezeNet with raw dataset (%).
Class Acc COR COM SPE F1 MCC
Covid 70.00 53.85 70.00 99.04 60.87 60.70 Normal 38.89 98.91 38.89 99.75 55.83 53.03 Pneumonia 98.73 73.03 98.73 40.98 83.96 52.07 Overall 76.37 75.26 69.21 79.93 66.89 55.27
Covid Normal Pneumonia Predicted Class Covid Normal Pneumonia True Class 1 4 3 153 150 148 2.0% 3.3% 100.0% 98.0% 96.7% 0.6% 2.6% 2.0% 99.4% 97.4% 98.0%
Fig. 10. Confusion matrix of the proposed deep Bayes-SqueezeNet in testing phase.
Table 5
Classification results of the proposed deep Bayes-SqueezeNet (%).
Class Acc COR COM SPE F1 MCC
Covid 100.00 99.35 100.00 99.67 99.67 99.51 Normal 98.04 97.40 98.04 98.69 97.72 96.58 Pneumonia 96.73 98.01 96.73 99.02 97.37 96.07 Overall 98.26 98.26 98.26 99.13 98.25 97.39 0 20 40 60 80 100
Accuracy (%)
Raw Dataset Augmented Dataset
Covid Normal Pneumonia Overall
column ofFig. 12defines the original input images while the second column includes the heat map images of the predicted samples. When all the class activation mappings are examined inFig. 12(a)– (c), the probability values of the predictions are nearly 1.00. According to the heat maps of the images, the trained network distinguishes the classes with an acceptable feature mapping. To form an outlier example, Fig. 12 (d) presents a misclassified class sample i.e. Normal class is confused with Pneumonia. The probability values are 0.25 and 0.74, for Normal and Pneumonia respectively.
The proposed deep Bayes-SqueezeNet with its low model size is easy
to implement in hardware deployments. As shown inTable 6, the model size of the proposed network is less than 77.31 times lower compared to the AlexNet, which is the inspiration of the SqueezeNet architecture.
The overall experimental results show that proposed model has a significant and robust performance value. Over the COVID-19 patient cases, this study proposes a complete and compact solution using the chest X-ray images for rapid diagnosis.
Comparison between the State-of-the-Art methods
The coronavirus disease 2019 was announced as an outbreak by WHO on February 11, 2020[1]. Due to the COVID-19 outbreak, the early diagnosis of this disease has become a key topic for clinicians and radiologists in the world. The AI techniques regarding the image clas-sification approaches can help in early diagnose of the disease. Con-sidering AI, CNN methods achieve better and faster results compared to the traditional diagnosis methods. In this paper, a rapid robust and efficient COVID-19 diagnosis method, which is namely deep Bayes-SqueezeNet, is proposed. The proposed method performs the X-ray images into multiclass as Normal, Pneumonia, and Covid. In order to evaluate the proposed CNN model, the general performance compar-ison of our study with the state-of-art methods is given in this section. In the model evaluations, the related studies depend on the multiclass classification of the chest X-ray images with various AI techniques. Table 7shows the comparison results with the related studies uses the same or similar datasets.
Li and Zhu[16] propose a DenseNet based COVID-Xpert archi-tecture classifying the three-class chest X-ray images. They use transfer learning and obtain an overall accuracy of 0.889. Wang and Wong[11] present COVID-Net design to the diagnosis of the COVID-19 and in their study the main model is based on the tailored CNN. Machine-driven design is used to improve the model architecture. The overall accuracy, COM, and COR metrics of[11]can be listed as 0.923, 0.887, and 0.913, respectively. The authors also share and collect the COVIDx dataset used in our study. Afshar et al.[17]introduce a deep learning model based on a capsule network using a four-class dataset. Their model produces a 0.957 overall accuracy. Farooq and Hafeez[18]present a ResNet based framework in a four-class dataset with augmentation. The model accuracy has remained as 0.962. Chowdhury et al.[19]explain a bundle structure that includes various deep learning models using four different chest X-ray datasets. Amid the performance metrics that Table 7gives, our model outperforms similar studies that use chest X-rays in the diagnosis of the COVID-19. Although it seems that some of the performance values have been achieved the same with the study [19], the whole performance of the proposed method in our study is better than it.
InTable 8, the performance values of the listed studies are given in terms of COVID-19 class accuracy. While Chowdhury et al.[19]have the same overall accuracy with our study, the COVID-19 class accuracy stays behind the proposed method. Farooq and Hafeez[18]obtain the same accuracy of COVID-19 class, but our study outperforms it in the overall accuracy. In addition, the test dataset of the study includes just eight samples of COVID-19.
To the best of our knowledge, the proposed model reveals the ex-cellent classification performance for the COVID-19 diagnosis with chest X-rays. The proposed model has a great advantage of owning a practical network architecture with a robust and stable operation. With its nature of including fewer parameters, our network is more favorable for embedded systems among existing deep learning models.
Original Image - Covid
Covid, 0.99999 Normal, 4.6985e-06 Pneumonia, 5.4529e-07
(a)
Original Image - Normal
Normal, 1 Pneumonia, 4.5248e-08
Covid, 9.5175e-11
(b)
Original Image - Pneumonia
Pneumonia, 0.99998 Normal, 2.1445e-05 Covid, 1.7446e-08
(c)
Original Image - Normal
Pneumonia, 0.74539 Normal, 0.25461 Covid, 3.4892e-06
(d)
Fig. 12. Class activation mapping visualization of the proposed deep Bayes-SqueezeNet on sample images: a) Covid b) Normal c) Pneumonia d) Misclassified prediction.
Table 6
Model sizes in mega bytes.
Deep Bayes-SqueezeNet AlexNet
Conclusions
A rapid diagnosis method has a key role in the control of infectious diseases and pandemic situations like the up to date COVID-19. Some limitations of the RT-PCR nucleic acid-based test modules reveal a need for fast alternative methods to be able to serve the front-line experts to make them reach a quick and accurate diagnosis. In this study, we propose an AI-based decision-making system including the recognition of input X-ray images under the roof of a very practical deep learning model. This study is an important attempt including an easy to imple-ment deep learning model which has an accuracy performance of 98.3% (among Normal, Pneumonia and Covid cases), and 100% for the single recognition of COVID-19 (among other classes). In these difficult days of the global COVID-19 pandemic, our model has a strong po-tential to build a tool design for COVID-19 monitoring. We would like to note that that the RT-PCR test method to detect the SARS-CoV-2 is still important. However, it is proved that there are also undeniable shortcomings along with the RT-PCR test method, which can be listed as follows: 1) its possible methodology lacks, 2) strict dependence on the level of the disease (timing), 3) the possibility for collecting the specimens in mistaken localizations and 4) its response time delay [6,7]. In our model working with a deep learning-based practical structure, the early stage detections of the COVID-19 cases could be done to manage and control the pandemic disease. In medical image processing, while deep learning methods are preferred in many areas, it is becoming more and more important especially in the interpretation of radiological images. As such, our model, which is extremely sa-tisfactory even with its initial results, opens the door for the im-plementation of a comprehensive product that can work mobile and appeal to the end-user.
Backbone of our model is the deep Bayes-SqueezeNet decision-making system for the COVID-19 diagnosis from X-ray images. SqueezeNet with much less model size is a state-of-the-art deep learning model, which is inspired by the well-known AlexNet. With its practical structure and generalization performance, the SqueezeNet is preferable in the embedded applications. We improve the SqueezeNet structure with Bayes optimization algorithm to build a robust and sustainable learning model. Bayesian optimization helps us to build a best-per-formed model with a validation dataset. The diagnosis system is trained using the public dataset proposed in[11]with its augmented form. A separate test, which is independent of train and validation sets, forms the experiments. Our experimental results also present the per-formance boosting of the augmentation contribution to the dataset
pre-processing. Thus, model training can be performed with a rich image set of X-rays of COVID-19. After comprehensive literature research, the up to date studies, which use the same or similar public datasets are de-tected and we evaluate our model with those. The proposed diagnosis model for COVID-19 using the X-ray images, the deep Bayes-Squee-zeNet outperforms its competitors. We believe that with increased training dataset, it is expected to get higher results.
In further works, we aim to plan our model to be able to work mobile appealing to the health care experts for diagnosis of the COVID-19. In addition, the possibility of presenting this diagnostic system as a solution for other medical image processing cases will also be explored. Declaration of Competing Interest
The authors declare that they have no known competingfinancial interests or personal relationships that could have appeared to in flu-ence the work reported in this paper.
Appendix A. Supplementary data
Supplementary data to this article can be found online athttps:// doi.org/10.1016/j.mehy.2020.109761.
References
[1] WHO - Coronavirus disease 2019 info web site n.d. https://www.who.int/emer-gencies/diseases/novel-coronavirus-2019 (accessed April 6, 2020).
[2] Lai CC, Shih TP, Ko WC, Tang HJ, Hsueh PR. Severe acute respiratory syndrome coronavirus 2 (SARS-CoV-2) and coronavirus disease-2019 (COVID-19): The epi-demic and the challenges. Int J Antimicrob Agents 2020;55:105924https://doi.org/ 10.1016/j.ijantimicag.2020.105924.
[3] Salman S, Salem ML. Routine childhood immunization may protect against COVID-19. vol. 140. Churchill Livingstone; 2020. doi:10.1016/j.mehy.2020.109689. [4] Wang D, Hu B, Hu C, Zhu F, Liu X, Zhang J, et al. Clinical Characteristics of 138
Hospitalized Patients with 2019 Novel Coronavirus-Infected Pneumonia in Wuhan, China. JAMA - J Am Med Assoc 2020;323:1061–9.https://doi.org/10.1001/jama. 2020.1585.
[5] Xie M, Chen Q. Insight into 2019 novel coronavirus— an updated intrim review and lessons from SARS-CoV and MERS-CoV. Int J Infect Dis 2020. doi:10.1016/j.ijid. 2020.03.071.
[6] Liu R, Han H, Liu F, Lv Z, Wu K, Liu Y, et al. Positive rate of RT-PCR detection of SARS-CoV-2 infection in 4880 cases from one hospital in Wuhan, China, from Jan to Feb 2020. Clin Chim Acta 2020;505:172–5.https://doi.org/10.1016/j.cca.2020.03. 009.
[7] Chu DKW, Pan Y, Cheng SMS, Hui KPY, Krishnan P, Liu Y, et al. Molecular Diagnosis of a Novel Coronavirus (2019-nCoV) Causing an Outbreak of Pneumonia. Clin Chem 2020;66:549–55.https://doi.org/10.1093/clinchem/hvaa029.
[8] 3D medical animation corona virus.jpg - Wikimedia Commons. Wikimedia Commons n.d. https://commons.wikimedia.org/wiki/File:3D_medical_animation_ corona_virus.jpg (accessed April 6, 2020).
[9] Li Y, Xia L. Coronavirus Disease 2019 (COVID-19): Role of Chest CT in Diagnosis and Management. Am J Roentgenol 2020:1–7. doi:10.2214/ajr.20.22954. [10] Kermany DS, Goldbaum M, Cai W, Valentim CCS, Liang H, Baxter SL, et al.
Identifying Medical Diagnoses and Treatable Diseases by Image-Based Deep Learning. Cell 2018;172(1122–1131):e9https://doi.org/10.1016/j.cell.2018.02. 010.
[11] Wang L, Wong A. COVID-Net: A Tailored Deep Convolutional Neural Network Design for Detection of COVID-19 Cases from Chest Radiography Images. ArXiv 2200309871 2020.
[12] Cohen JP, Morrison P, Dao L. COVID-19 Image Data Collection. ArXiv 200311597 2020.
[13] Gozes O, Ayan Frid-Adar M’, Greenspan H, Browning PD, Zhang H, Ji W, et al. Rapid AI Development Cycle for the Coronavirus (COVID-19) Pandemic: Initial Results for Automated Detection & Patient Monitoring using Deep Learning CT Table 7
The general comparison of the proposed method between the state-of-the-art methods.
Study Year Methods Class Acc COR COM SPE F1 MCC
Li and Zhu[16] 2020 DenseNet 3 0.889 – – – – –
Wang and Wong[11] 2020 Tailored CNN 3 0.923 0.913 0.887 – 0.900 –
Afshar et al.[17] 2020 Capsule Networks 4 0.957 – 0.900 0.958 – –
Farooq and Hafeez[18] 2020 ResNet50 4 0.962 0.969 0.969 – 0.969 –
Chowdhury et al.[19] 2020 Sgdm-SqueezeNet 3 0.983 1.000 0.967 0.990 0.983 –
Proposed Method 2020 Bayes-SqueezeNet 3 0.983 0.983 0.983 0.991 0.983 0.974
Table 8
COVID-19 class comparison of the proposed method between the state-of-the-art methods.
Study COVID-19 Class Acc Overall Acc
Li and Zhu[16] 0.792 0.889
Wang and Wong[11] 0.800 0.923
Afshar et al.[17] – 0.957
Chowdhury et al.[19] 0.967 0.983
Farooq and Hafeez[18] 1.000 0.962
Image Analysis Authors. ArXiv 200305037 2020.
[14] Xiaowei Xu;, Xiangao Jiang;, Chunlian Ma;, Peng Du;, Xukun Li;, Shuangzhi Lv;, et al. Deep Learning System to Screen Coronavirus Disease 2019 Pneumonia. ArXiv 200209334 2020:1–29.
[15] Wang S, Kang B, Ma J, Zeng X, Xiao M, Guo J, et al. A deep learning algorithm using CT images to screen for corona virus disease (COVID-19). MedRxiv 2020:2020.02. 14.20023028. doi:10.1101/2020.02.14.20023028.
[16] Li X, Zhu D. COVID-Xpert: An AI Powered Population Screening of COVID-19 Cases Using Chest Radiography Images. ArXiv:200403042 2020:1–6..
[17] Afshar P, Heidarian S, Naderkhani F, Oikonomou A, Plataniotis KN, Mohammadi A, et al. Caps: A Capsule Network-Based Framework for Identification of Covid-19 Cases From X-Ray Images. ArXiv Prepr ArXiv200402696 2020:1–4. [18] Farooq M, Hafeez A. COVID-ResNet: A Deep Learning Framework for Screening of
COVID19 from. Radiographs 2020.
[19] Chowdhury MEH, Rahman T, Khandakar A, Mazhar R, Kadir MA, Mahbub Z Bin, et al. Can AI help in screening Viral and COVID-19 pneumonia? ArXiv 200313145 2020.
[20] Lakhani P, Sundaram B. Deep learning at chest radiography: Automated classifi-cation of pulmonary tuberculosis by using convolutional neural networks. Radiology 2017;284:574–82.https://doi.org/10.1148/radiol.2017162326. [21] Varshni D, Thakral K, Agarwal L, Nijhawan R, Mittal A. Pneumonia Detection Using
CNN based Feature Extraction. Proc. 2019 3rd IEEE Int. Conf. Electr. Comput. Commun. Technol. ICECCT 2019, Institute of Electrical and Electronics Engineers Inc.; 2019. doi:10.1109/ICECCT.2019.8869364.
[22] Budak Ü, Cömert Z, Çıbuk M, Şengür A. DCCMED-Net: Densely connected and concatenated multi Encoder-Decoder CNNs for retinal vessel extraction from fundus images. Med Hypotheses 2020;134.https://doi.org/10.1016/j.mehy.2019.109426. [23] Özyurt F, Sert E, Avcı D. An expert system for brain tumor detection: Fuzzy C-means
with super resolution and convolutional neural network with extreme learning machine. Med Hypotheses 2020;134.https://doi.org/10.1016/j.mehy.2019. 109433.
[24] Iandola FN, Han S, Moskewicz MW, Ashraf K, Dally WJ, Keutzer K. SqueezeNet: AlexNet-level accuracy with 50x fewer parameters and < 0.5MB model size. Arxiv 2016;160207360:1–13.
[25] Fan G, Chen F, Chen D, Dong Y. Recognizing Multiple Types of Rocks Quickly and Accurately Based on Lightweight CNNs Model. IEEE Access 2020;8:55269–78. https://doi.org/10.1109/ACCESS.2020.2982017.
[26] Chappa RTNV., El-Sharkawy M. Squeeze-and-Excitation SqueezeNext: An Efficient DNN for Hardware Deployment. 2020 10th Annu. Comput. Commun. Work. Conf., IEEE; 2020, p. 0691–7. doi:10.1109/ccwc47524.2020.9031119.
[27] Wu J, Chen XY, Zhang H, Xiong LD, Lei H, Deng SH. Hyperparameter optimization for machine learning models based on Bayesian optimization. J Electron Sci Technol 2019;17:26–40.https://doi.org/10.11989/JEST.1674-862X.80904120. [28] Gu J, Wang Z, Kuen J, Ma L, Shahroudy A, Shuai B, et al. Recent advances in
convolutional neural networks. Pattern Recognit 2018;77:354–77.https://doi.org/ 10.1016/j.patcog.2017.10.013.
[29] Raghu S, Sriraam N, Temel Y, Rao SV, Kubben PL. EEG based multi-class seizure type classification using convolutional neural network and transfer learning. Neural Networks 2020;124:202–12.https://doi.org/10.1016/j.neunet.2020.01.017. [30] Jadhav P, Rajguru G, Datta D, Mukhopadhyay S. Automatic sleep stage
classifica-tion using time–frequency images of CWT and transfer learning using convoluclassifica-tion neural network. Biocybern Biomed Eng 2020;40:494–504.https://doi.org/10. 1016/j.bbe.2020.01.010.
[31] Sun W, Zhang Z, Huang J. RobNet: real-time road-object 3D point cloud segmen-tation based on SqueezeNet and cyclic CRF. Soft Comput 2019;24:5805–18.https:// doi.org/10.1007/s00500-019-04355-y.
[32] Su L, Ma L, Qin N, Huang D, Kemp AH. Fault Diagnosis of High-Speed Train Bogie by Residual-Squeeze Net. IEEE Trans Ind Informatics 2019;15:3856–63.https://doi. org/10.1109/TII.2019.2907373.
[33] Sameen MI, Pradhan B, Lee S. Application of convolutional neural networks fea-turing Bayesian optimization for landslide susceptibility assessment. Catena 2020;186.https://doi.org/10.1016/j.catena.2019.104249.
[34] Snoek J, Rippel O, Swersky K, Kiros R, Satish N, Sundaram N, et al. Scalable Bayesian Optimization Using Deep Neural Networks. 32nd Int. Conf. Mach. Learn. ICML 2015, vol. 3, International Machine Learning Society (IMLS); 2015, p. 2161–70.
[35] Mockus J. On the Bayes Methods for Seeking the Extremal Point. IFAC Proc 1975;8:428–31.https://doi.org/10.1016/s1474-6670(17)67769-3.
[36] Shahriari B, Swersky K, Wang Z, Adams RP, De Freitas N. Taking the human out of the loop: A review of Bayesian optimization. Proc IEEE 2016;104:148–75.https:// doi.org/10.1109/JPROC.2015.2494218.
[37] Shallow Understanding on Bayesian Optimization - Towards Data Science 2020. https://towardsdatascience.com/shallow-understanding-on-bayesian-optimization-324b6c1f7083 (accessed April 9, 2020).
[38] Kermany, Daniel; Zhang, Kang; Goldbaum M. Labeled Optical Coherence Tomography (OCT) and Chest X-Ray Images for Classification. Mendeley Data, V2 2018. http://dx.doi.org/10.17632/rscbjbr9sj.2.
[39] Buda M, Maki A, Mazurowski MA. A systematic study of the class imbalance pro-blem in convolutional neural networks. Neural Networks 2018;106:249–59. https://doi.org/10.1016/j.neunet.2018.07.011.