ISTANBUL BILGI UNIVERSITY INSTITUTE OF GRADUATE PROGRAMS
FINANCIAL ECONOMICS MASTER’S DEGREE PROGRAM
IMPACT OF DISCOUNTED TICKET ADS ON AIRLINES STOCK PRICE: AN EMPIRICAL ANALYSIS FOR PEGASUS AIRLINES
Serkan AY 115620024
Assoc. Prof. Serda Selin ÖZTÜRK
ISTANBUL 2020
ISTANBUL BILGI UNIVERSITY INSTITUTE OF GRADUATE PROGRAMS
FINANCIAL ECONOMICS MASTER’S DEGREE PROGRAM
IMPACT OF DISCOUNTED TICKET ADS ON AIRLINES STOCK PRICE: AN EMPIRICAL ANALYSIS FOR PEGASUS AIRLINES
Serkan AY 115620024
ACKNOWLEDGMENTS
I’m deeply grateful to my supervisor, Assoc. Prof. Serda Selin Öztürk for her guidance, patience and support. I consider myself very fortunate for being able to work with a very considerate and encouraging professor like her.
I must express my very profound gratitude to my parents Şükran and Ramazan Ay for providing me with unfailing support and continuous encouragement throughout my life. This accomplishment would not have been possible without them.
TABLE OF CONTENTS
Page
ACKNOWLEDGMENTS ... ii
TABLE OF CONTENTS ... iii
LIST OF ABBREVIATIONS ... vi
LIST OF FIGURES ... vii
LIST OF TABLES ... viii
ABSTRACT ... ix
ÖZET ... x
INTRODUCTION ... 1
1.1 THE AIM OF THE STUDY ... 1
1.2 AIRLINES INDUSTRY IN GENERAL ... 2
1.2.1 Cost Factors in the Airlines Industry ... 3
1.2.2 Issues for Determining Ticket Prices in the Airlines Industry ... 5
1.3 TURKISH ECONOMY IN RECENT YEARS ... 7
1.4 TURKISH AIRLINES INDUSTRY ... 8
1.4.1 Airlines Industry Market Share in Turkey ... 9
1.4.2 Turkish Airlines in Summary ... 11
1.4.3 Pegasus Airlines in Summary ... 12
PART 2: LITERATURE REVIEW ... 13
PART 3: METHODOLOGY ... 16
3.1 MODERN PORTFOLIO THEORY ... 18
3.1.1 Risk and Return ... 19
3.1.2 Efficient Frontier ... 19
3.2 CAPITAL MARKET THEORY ... 20
3.2.1 Capital Market Line ... 21
3.3 CAPITAL ASSET PRICING MODEL ... 22
3.3.1 Beta ... 23
3.3.2 Security Market Line... 24
3.4.3 BIST-100 Index Return Calculation ... 26
3.4.4 Pegasus Airlines Stock Excess Return Calculation ... 26
3.4.5 BIST-100 Index Excess Return Calculation ... 27
3.4.6 Brent Oil Return Calculation ... 27
3.4.7 USD/TL Return Calculation ... 27
3.4.8 EUR/TL Return Calculation ... 27
3.4.9 Campaign Dummy ... 28
3.4.10 KAP Dummy ... 28
PART 4: DATA ... 28
4.1 PEGASUS AIRLINES STOCK PRICE AND BIST-100 INDEX ... 28
4.2 USD, EUR AND BRENT OIL ... 30
4.3 CAMPAIGN DUMMY VARIABLE ... 33
4.4 KAP DUMMY VARIABLE ... 34
PART 5: RESULTS ... 43
5.1. MODEL RESULT WHEN KAP AND CAMPAIGN DUMMY USED TOGETHER ... 47
5.2. MODEL RESULT WHEN CAMPAIGN DUMMY USED ONLY ... 49
CONCLUSION ... 51
REFERENCES ... 55
APPENDIX ... 58
APPENDIX 1: ADF TEST RESULTS FOR BRENT OIL, USD/TL AND EUR/TL RAW DATA ... 58
APPENDIX 2: LIST OF CAMPAIGNS USED IN SCOPE OF THE STUDY 59 APPENDIX 3: LIST OF KAP ANNOUNCEMENTS USED IN SCOPE OF THE STUDY ... 60
APPENDIX 4: CORRELATION OF CAMPAIGN AND KAP USED TOGETHER ... 61
APPENDIX 5: CORRELATION OF CAMPAIGN AND KAP USED TOGETHER WITH USD/TL RETURN EXCLUDED ... 61
APPENDIX 6: CORRELATION OF CAMPAIGN USED ONLY ... 61
APPENDIX 7: CORRELATION OF CAMPAIGN USED ONLY WITH USD/TL RETURN EXCLUDED ... 62
APPENDIX 8: CAPM RESULTS FOR KAP AND CAMPAIGN DUMMIES USED TOGETHER ... 62
APPENDIX 9: CAPM RESULTS FOR KAP AND CAMPAIGN DUMMIES USED TOGETHER WITH USD/TL RETURN EXCLUDED ... 63 APPENDIX 10: CAPM RESULTS FOR CAMPAIGN USED ONLY ... 63 APPENDIX 11: CAPM RESULTS FOR CAMPAIGN USED ONLY WITH USD/TL RETURN EXCLUDED ... 63
LIST OF ABBREVIATIONS
CAPM : Capital Asset Pricing Model LCC : Low Cost Carrier
ICAO : International Civil Aviation Organization IATA : International Air Transport Association CASK : Cost per Available Seat Kilometer ADF : Augmented Dickey Fuller
GFP : Gross Domestic Product KAP : Public Disclosure Authority
LIST OF FIGURES
Page
Figure 1.1: Turkish Economy GDP Growth (2008-2019) ... 8
Figure 1.2: Airline Companies Domestic Passenger Traffic Shares in Turkey for 2018 ... 10
Figure 1.3: Airline Companies International Passenger Traffic Shares in Turkey for 2018 ... 11
Figure 3.1: Utility Functions ... 16
Figure 3.2: Systematic and Unsystematic Risk ... 19
Figure 3.3: Efficient Frontier ... 20
Figure 3.4: Capital Market Line and Efficient Frontier ... 22
Figure 3.5: Security Market Line ... 24
Figure 4.1: Pegasus Airlines Daily Stock Price for Research Period ... 29
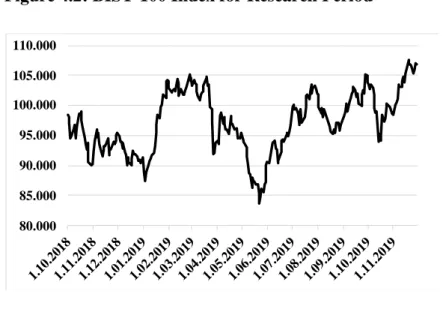
Figure 4.2: BIST-100 Index for Research Period ... 29
Figure 4.3: USD/TL Exchange Rate for Research Period ... 31
Figure 4.4: EUR/TL Exchange Rate for Research Period ... 31
Figure 4.5: Brent Oil/USD Price for Research Period ... 32
LIST OF TABLES
Page
Table 1.1: CASK Segmental Breakdown for Pegasus Airlines in 2019 ... 4
Table 4.1: ADF Test Results for Brent Oil, USD/TL and EUR/TL Raw Data... 33
Table 5.1: Correlation Between Model Variables... 45
Table 5.2: CAPM Results for KAP and Campaign Dummies Used Together ... 48
Table 5.3: CAPM Results for KAP and Campaign Dummies Used Together with USD/TL Return Excluded ... 49
Table 5.4: CAPM Results for Only Campaign Dummy Used ... 50
Table 5.5: CAPM Results for Only Campaign Dummy Used with USD/TL Return Excluded ... 50
ABSTRACT
Impact of Discounted Ticket Ads on Airlines Stock Price: An Empirical Analysis for Pegasus Airlines
Aviation industry is one of the indispensable components of the global economy which makes possible to connect people, cultures and businesses to the furthest places in the world. Accurate pricing strategy is an important factor in creating value for both shareholders and investors especially for airlines companies which transport passengers. In this study, the impact of discounted ticket ads on airlines stock price with an empirical analysis for Pegasus Airlines for a specific period of time is examined. Since the low-cost carriers’ pricing policy is generally dynamic with discounts and promotions due to the business model and the market competition, Pegasus Airlines, which is the leading low-cost carrier in Turkey, is determined as research subject. The Capital Asset Pricing Model (CAPM) is employed to examine the relationship between Pegasus Airlines stock return and discounted ticket ads for given days of the sample campaigns. Additional independent variables, including USD/TL, EUR/TL, Brent oil and Public Disclosure Platform (KAP) announcements, are also included in the CAPM. As a result of the regression estimation, the beta value indicates that Pegasus Airlines stock is less volatile than BIST-100 index. Abnormal return coefficient is positive, indicating that Pegasus Airlines stock performed better than the BIST-100 index, but it is not significant in measuring how much Pegasus Airlines outperform or underperform the BIST-100 index. As a result of the studies made on the CAPM, discounted ticket ads are found to be insignificant on explaining Pegasus Airlines stock return for given research period between 01.10.2018 and 30.11.2019.
Key Words: CAPM; Stock Return; Istanbul Stock Exchange; Airlines Companies;
ÖZET
İndirimli Bilet Reklamlarının Havayolu Şirketleri Hisse Senedi Fiyatı Üzerine Etkisi: Pegasus Hava Yolları Reklamları için Ampirik Bir Analiz
Havacılık endüstrisi; insanları, kültürleri ve işletmeleri dünyanın en uzak yerlerine ulaştırmayı mümkün kılan küresel ekonominin vazgeçilmez bileşenlerindendir. Özellikle yolcu taşıyan havayolu şirketlerinde, doğru fiyatlandırma stratejisi hem hissedarlar hem de yatırımcılar için değer yaratmada önemli bir faktördür. Bu çalışmada, indirimli bilet reklamlarının havayolları hisse senedi fiyatı üzerindeki etkisi Pegasus Havayolları örneği üzerinden ampirik bir analizle belirli bir süre aralığı için incelenmiştir. Düşük maliyetli taşıyıcıların fiyatlandırma politikası iş modeli ve pazar rekabeti nedeniyle genellikle indirim ve promosyonlarla dinamik olduğu için Türkiye'nin önde gelen düşük maliyetli taşıyıcısı olan Pegasus Havayolları araştırma konusu olarak belirlenmiştir. Örneklemde yer alan indirimli bilet kampanyaları ve Pegasus Havayolları hisse senedi getirisi arasındaki ilişkiyi incelemek için Finansal Varlıkları Fiyatlama Modeli (FVFM) kullanılmıştır. USD/TL, EUR/TL, Brent petrol ve Kamuyu Aydınlatma Platformu (KAP) duyurularını içeren ek bağımsız değişkenler de FVFM'ye dahil edilmiştir. Regresyon sonucunda elde edilen beta değeri, Pegasus Havayolları'nın BIST-100 endeksinden daha az oynak olduğunu göstermektedir. Pozitif olan anormal getiri katsayısı Pegasus Havayolları hisselerinin BIST-100 endeksinden daha iyi performans gösterdiğini işaret etmesine rağmen şirketin BIST-100 endeksinden ne kadar iyi veya düşük performans gösterdiğini ölçmede istatistiksel olarak anlamlı değildir. FVFM üzerinde yapılan çalışmalar sonucunda, 01.10.2018 ve 30.11.2019 tarihleri arasında Pegasus Havayolları'nın hisse senedi getirisini açıklamada indirimli bilet reklamlarının önemli olmadığı belirlenmiştir.
Anahtar Kelimeler: FVFM; Hisse Getirisi; Borsa İstanbul; Havayolu Şirketleri;
INTRODUCTION PART 1:
1.1 THE AIM OF THE STUDY
Airline industry has been transformed over the years. Despite economic struggles, recessions, shocks, terrorism and diseases, the number of passengers has risen over the years. Considerable increase on variety of travel options by destinations, cheaper tickets have made new business models possible, frequency of flights and higher standards in terms of safety have benefited to consumers and the economy itself. In addition to the airline consumers who have benefited from these developments, there are also investors who have been making these developments possible.
In the report prepared by (IATA, 2011), it is stated that shareholders of the airlines could not get the value of the risk taken. The number of airlines that generate consistent return on capital that exceeds its cost are very few. In scope of the report, five force framework which is a tool for understanding the competitiveness of the business environment is applied by Michael Porter, who is the creator of the five force method, to understand poor airline profitability through the force of rivalry, new entrants, customer and supplier bargaining power, and the threat of substitutes. In the report, they concluded that the poor profitability in the airlines industry is driven by competition almost solely on price caused by overly fragmented industry.
Ticket prices have a significant impact on airline companies' profitability. In this study, I aimed to examine whether the discounted ticket prices have an effect on the stock investor on the example of an airlines company whose shares are traded on the stock exchange. There have been many research in literature related to
Hanssens, 2010), the impact of price promotions on the revenue of the firms (Slotegraaf & Pauwels, 2008), the effect of product market advertising on liquidity of the common stock and the breadth of the ownership (Grullon, Kanatas, & Weston, 2004), the effect of advertising activities (in terms of advertising expenditure) on the firms’ stock returns both in the short and long run (Chemmanur & Yan, 2019), the perception of the companies’ advertising in specific advertising season in terms of stock price performance from the financial investor framework including stakeholders and investors (Kim & Morris, 2003). In my study, I examined the impact of discounted ticket ads on airlines stock price with an empirical analysis for Pegasus Airlines excess stock returns for a specific period of time. Since the low-cost carriers’ pricing policy is generally dynamic with discounts and promotions due to the business model and the market competition, I determined Pegasus Airlines, which is the leading low-cost carrier in Turkey, as my research subject. I employed CAPM to examine the relationship between Pegasus Airlines stock excess return and discounted ticket ads for given days of the campaign.
1.2 AIRLINES INDUSTRY IN GENERAL
The airline industry, which is in an indispensable position in terms of the world economy, continues to grow in the long term although it is interrupted from time to time due to economic crises, epidemics and terrorist events. Factors such as the increase in world trade volume, economic growth, development in the tourism sector, increasing city population, globalization, and the opportunity of a faster and more comfortable travel by air transport are the main factors that support the growth of the sector in the world.
Competition conditions within the sector have also changed over time due to the growth of the airlines industry. Competitive tools such as fast transportation, quality service and reasonable prices are among the important factors in determining the preferences of the customers. As a result of the changes in the competitive
environment and conditions in the industry, airline companies continue their activities in a way to meet the demands of the customers.
1.2.1 Cost Factors in the Airlines Industry
Operational and financial management issues are important in airline transportation as they require high capital investment. Especially for airlines operating with the LCC business model, it is important to keep the costs under control in order to keep profit margins at a certain level.
The most common airway cost classification used today is the classification made by ICAO. According to this classification, the costs of airlines are divided into two as operating costs and non-operating costs. Operating costs are the costs directly related to the flight services offered by the airline company, while non-operating costs are costs not directly related to the flight services offered. Fixed costs are costs that do not change depending on the airline's service production level, or in other words that these costs are costs which do not change depending on a specific flight or a series of flights. The costs that vary depending on the level of service production are called variable costs (Uslu & Cavcar, 2003).
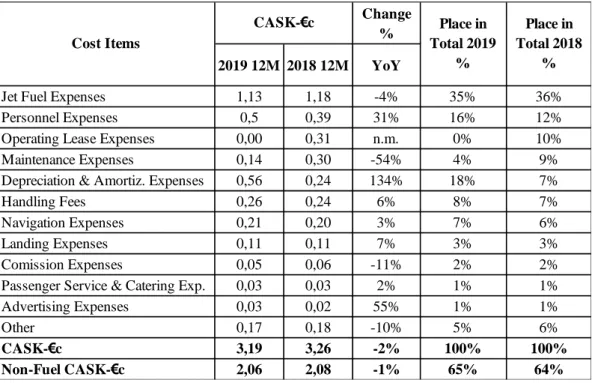
When classified in general, fixed costs include fuel expenses, personnel payments, aircraft rents, training expenses, maintenance expenses, insurance expenses while variable costs include operational costs and catering expenses (Öncü, Çömlekçi, & Coşkun, 2010). The most important cost item of airline companies is determined as aircraft fuel. Due to the fluctuating oil prices, the fuel expenses of airline companies change, and this affects the profitability of the companies. In the table below, the cost breakdown of Pegasus Airlines on the basis of Cost per Available Seat Kilometer at the end of 2018 and 2019 is given as an example.
Table 1.1: CASK Segmental Breakdown for Pegasus Airlines in 2019
(Pegasus Airlines, 2020)
CASK is an airlines industry standard for measuring the unit cost. This measurement is frequently used in airlines industry since it allows a cost comparison between different airlines, or cost comparison of a single airline in different time periods. The calculations can be made for different aircraft types for comparing the unit cost of them. In this example, CASK is calculated for a Pegasus Airlines for a particular period of time.
As it can be seen from the Table 1.1, Pegasus Airlines' biggest cost item is fuel expense, which constitutes 35% of the total costs. After the depreciation and amortization, the third highest expense in total costs is personnel expense. In general, the two most important cost items of the aviation industry are fuel and personnel expenses. Since Turkey is dependent on imports for the supply of fuel, managing the fuel costs is of great importance for airlines industry. In addition to
Change % 2019 12M 2018 12M YoY
Jet Fuel Expenses 1,13 1,18 -4% 35% 36%
Personnel Expenses 0,5 0,39 31% 16% 12%
Operating Lease Expenses 0,00 0,31 n.m. 0% 10%
Maintenance Expenses 0,14 0,30 -54% 4% 9%
Depreciation & Amortiz. Expenses 0,56 0,24 134% 18% 7%
Handling Fees 0,26 0,24 6% 8% 7%
Navigation Expenses 0,21 0,20 3% 7% 6%
Landing Expenses 0,11 0,11 7% 3% 3%
Comission Expenses 0,05 0,06 -11% 2% 2%
Passenger Service & Catering Exp. 0,03 0,03 2% 1% 1%
Advertising Expenses 0,03 0,02 55% 1% 1% Other 0,17 0,18 -10% 5% 6% CASK-€c 3,19 3,26 -2% 100% 100% Non-Fuel CASK-€c 2,06 2,08 -1% 65% 64% CASK-€c Cost I tems Place in Total 2019 % Place in Total 2018 %
Turkey being dependent on imports for fuel, the airline industry may face additional risks with the fluctuation of TL against other operational currencies.
Airline companies regularly purchase aircraft within the scope of fleet renewal or expansion. Although these purchases are not carried out frequently, they are reflected in the balance sheet as an important expense item due to their costs. Aircraft purchases are generally made in long term due to their high costs, but aircraft can also be purchased through financial leasing.
1.2.2 Issues for Determining Ticket Prices in the Airlines Industry
The price of the airline ticket depends on the complete analysis of some metrics which include costs, supply and demand. At the very heart of the business, costs are the determinant factors on the profit margin which shows how much money your business is making, whether your business is thriving or there are potential problems related to business. So, costs are one of the main determinants of the ticket price. Supply and demand show the behavior of the consumers and the market which provides data related to the price formation from the benefits of the services offered by the airline industry.
Supply and demand are two economic variables which are used to explain the determination of the price in the market for various products and services. While supply stands for the relationship between the prices of goods and services and their availability, demand stands for the number of goods that consumers want to buy at a range of affordable prices in the market. There is an equilibrium point which supply, and demand curves meet on a graph. If we simply explain, companies use supply and demand to determine how much of a product or service they should make and at what price.
loyalty, availability of other means of transport, state of the economy, in-flight amenities, frequency of the service, safety, aircraft type together with other random factors (Vasigh, Fleming, & Tacker, 2008). It has been noted that the ticket price (with competing airlines’ ticket prices) is the most influential factor on demand especially for price sensitive passengers.
An increase or decrease in airline ticket price affects the demand from customers who are sensitive to ticket price. As a result of increase on ticket price for price sensitive customers, demand for the competing airlines with lower prices or other means of transportation increase.
However, different customer segments such as time sensitive customers are affected by these price variables in different ways. Depending on the customer needs, ticket prices may be important or not. Income level, consumer loyalty and other variables should be taken into account for evaluation.
The analysis of airline ticket price and its determinants is researched by Alves and Caetano in 2016 (Alves & Caetano, 2016) In this study, correlation method is used to verify the effect of ticket price and influencing variables. In general, the aim of this study is to establish the relationship between operating costs, supply and demand. The data used in this study belongs to the Brazilian airline industry from 2004 to 2013. As a result of the study, they conclude that, there is a relationship between airline ticket price and operating costs. However, this relationship is overshadowed by the fact that the relationship between supply and demand is the main determinant in explaining ticket pricing for airlines.
Some problems encountered in the management of costs in the airline industry may arise at the stage of determining the supply-demand balance and pricing of tickets. Fleet planning should be carried out by estimating the medium and the long-term growth trends correctly. Even in the case of tight control of all cost factors and
planning with very advanced methods, sudden drops in the turnover of the sector may occur due to unforeseen events such as epidemics, war and terrorist acts.
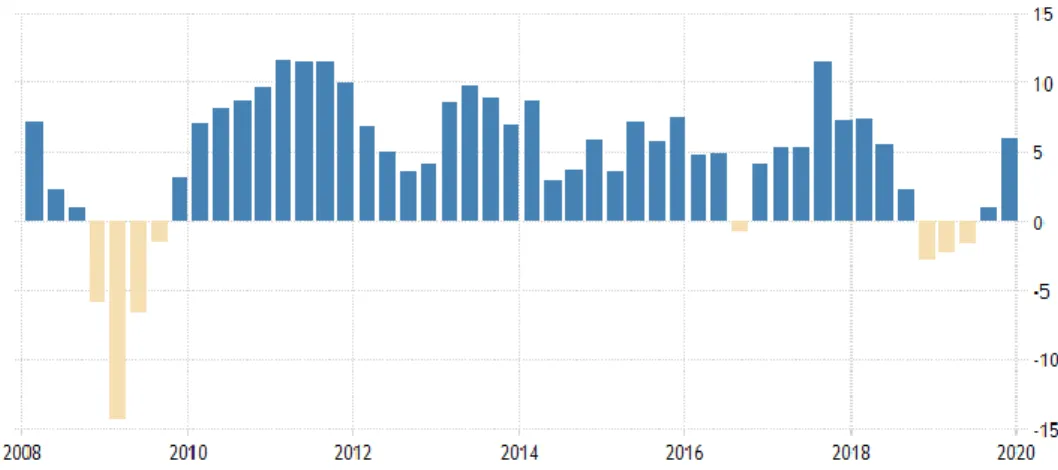
1.3 TURKISH ECONOMY IN RECENT YEARS
Turkey is the 18th largest economy in the world with a GDP of USD 755 billion. Between the years 2000-2019, GDP per capita in Turkey has increased from USD 4,200 to USD 9,140 (World Bank, 2020).
Turkish economy shrank due to the global economic crisis which occurred at 2009. The economy, which entered a rapid recovery period in the following years, have continued to grow with fluctuations.
With the effect of geopolitical and political negativities in 2016, growth declined to its lowest level after the global economic crisis in 2009.
With the aim of reviving the economy in 2017, loans were provided, and employment and production incentives were brought to companies to access funding.
The economy slowed down as a result of the uncertainties in the global market and the sharp depreciation of the Turkish Lira in August 2018. A tight monetary policy was implemented by Central Bank of the Republic of Turkey in order to prevent a rise in inflation and negativities in the financial environment in Turkey in 2018.
Although the Turkish economy contracted for 3 quarters since the last quarter of 2018, the economy gradually adjusted after the currency shock of August 2018 in 2019-year end. With the effect of relative recovery in economic activity, it has started a growth trend again from the second half of 2019.
Figure 1.1: Turkish Economy GDP Growth (2008-2019)
(Trading Economics, 2020)
1.4 TURKISH AIRLINES INDUSTRY
Turkey has a strategically significant airspace between Asia and Europe continents. This strategic geographical location secures the control of an important part of the air routes which flow between Asia, Europe and the Middle East. Airlines industry has important contributions to the economy in multiple ways such as domestic and international tourism, supply chain and related spending, flows of trade, jobs created and investment.
Turkey has replaced Ataturk International Airport with Istanbul Airport at the end of 2018 for aiming to be a major hub for international air travel in the world. The aim of the project is to increase the total passenger capacity of the airport. The fact that Istanbul is a natural hub, a transfer point between global routes, enables companies to utilize narrow body airplanes to operate at those routes. The most important contribution of this situation is the remarkable cost efficiency and competitive advantage it creates vis-à-vis other airlines.
In terms of transportation time, flights are usually the best option on some routes, especially if we are to compare flights with transportation by road. Considering
alternative transportation routes, train and sea transportation are not as efficient as airline. Domestic flights stand out as a better alternative for long-distance passenger transportation.
1.4.1 Airlines Industry Market Share in Turkey
There are two main carrier typologies exist for airlines industry which are full-service and low-cost carrier. The companies operating in airlines industry basically belongs to one or the other. However, airlines are generally able to carry out low-cost airline operations under their subsidiaries. Turkish Airlines can be given as an example. While Turkish Airlines operates as the legacy carrier, AnadoluJet which is the subsidiary of Turkish Airlines, operates as low-cost carrier. AnadoluJet carries out international flights as well as national flights.
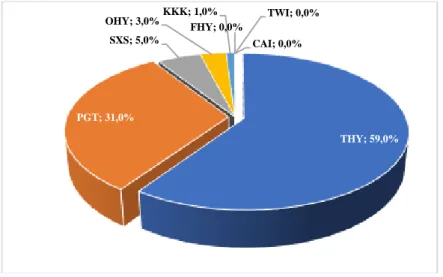
Turkish airlines industry is mainly dominated by two carriers, namely Turkish Airlines and Pegasus Airlines. In 2018, Turkish Airlines (together with AnadoluJet) served 59% of the market in domestic passenger transportation. The remaining share of the domestic passenger transportation was shared between these airlines: Pegasus Airlines 31%, Sunexpress 5%, Onur Air 3% and Atlas Global 1%.
Figure 1.2: Airline Companies Domestic Passenger Traffic Shares in Turkey for 2018
(THY; Turkish Airlines, KKK; Atlas Global, CAI; Corendon Airlines, FHY; Freebird Airlines, OHY; Onur Air, PGT; Pegasus Airlines, SXS; Sun Express, TWI; Tailwind Airlines)
(DHMİ, 2019)
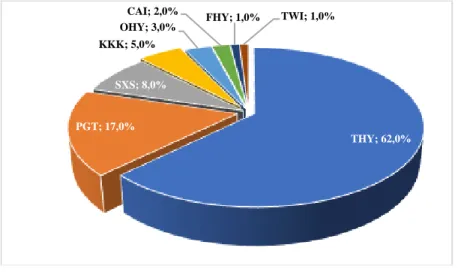
According to passenger traffic shares of 2018, Turkish Airlines carries 62% of all international passenger traffic alone, similar to its share in domestic passenger transportation. On the other hand, Pegasus Airlines has increased its international market share to 18%. Sun Express is the third company with 8% and the share of our other companies varies between 5% and 1%.
THY; 59,0% PGT; 31,0% SXS; 5,0% OHY; 3,0%KKK; 1,0% FHY; 0,0% TWI ; 0,0% CAI ; 0,0%
Figure 1.3: Airline Companies International Passenger Traffic Shares in Turkey for 2018
(THY; Turkish Airlines, KKK; Atlas Global, CAI; Corendon Airlines, FHY; Freebird Airlines, OHY; Onur Air, PGT; Pegasus Airlines, SXS; Sun Express, TWI; Tailwind Airlines)
(DHMİ, 2019)
As it can be seen by the above figures, Turkish Airlines has dominance in both domestic and international passenger transportation in Turkey. Pegasus Airlines which is a low-cost carrier, is the biggest competitor for both segments to Turkish Airlines in Turkey.
1.4.2 Turkish Airlines in Summary
Turkish Airlines is considered to be the flagship carrier of Turkey thanks to its size and history. Turkish Airlines which has started its operation with 5 planes at 1933, now continues its operation with 350 planes as of 2019 (Türk Hava Yolları, 2020). In the fleet of the company, there are 327 passenger planes which includes 97
wide-THY; 62,0% PGT; 17,0% SXS; 8,0% KKK; 5,0% OHY; 3,0% CAI ; 2,0% FHY; 1,0% TWI ; 1,0%
Turkish Airlines is renowned to be the airline that flies to the most countries and the most international destinations in the world. Turkish Airlines has the epicenter at the Istanbul Airport.
The main activity of the company is to carry out national and international passenger and cargo air transportation. Turkish Airlines also provides technical maintenance services to aircrafts. 50.88% of the company's shares were offered to the public. The initial public offering of the Turkish Airlines was made on 1990. 49.12% of the company's shares belong to Turkey Wealth Fund. One C group share belongs to the Privatization Administration of the Ministry of Treasury and Finance.
1.4.3 Pegasus Airlines in Summary
Pegasus Airlines, which started operating in the aviation industry with charter flights at the beginning of 1990, was acquired by Esas Holding at 2005. Pegasus Airlines which is the Turkey's leading low-cost airline has the epicenter at the Istanbul Sabiha Gokcen Airport.
Pegasus Airlines serves 112 destinations (34 domestic and 77 international destinations) in 43 countries. The company has a fleet of 84 aircraft in total, including 39 Boeing and 45 Airbus, as of April 2020.
Despite the intense competition within the sector, especially in the domestic line, it has managed to increase its market share over the years.
Currently, Esas Holding owns the 62.91% shares in Pegasus Airlines in the current situation. A total of 34.53% of the shares are publicly traded on the BIST-100 index. The initial public offering of the Pegasus Airlines was made on 2013. The remaining shares belong to various parties.
PART 2: LITERATURE REVIEW
A large number of studies have been conducted by academics around risk and return in the finance. One of the fundamental subject matter in finance literature is asset pricing. Generally speaking, buyer’s willingness is quite decisive on the price of an asset. Although there have been many models for different purposes in finance, the Capital Asset Pricing Model (CAPM) is one of the most famous one among others regarding asset pricing in finance literature. In a very broad sense, the CAPM aims to bring information to investor about the risks and expected return of the financial asset. The Markowitz's Modern Portfolio Theory is extended by the CAPM in both its assumptions and results.
The empirical test of the CAPM’s validity with different assets and indexes is one of the much-emphasized topics in finance. Especially, the test of the CAPM for the purpose of to evaluate its ability in explaining risk and return relationship in stock exchange markets is a frequently encountered issue.
Since Markowitz’s portfolio theory was published at 1952, portfolio optimization has led to numerous research fields. Further studies in this field related to CAPM were continued by Sharpe (1964), Treynor (1965), Mossin (1966) and Black (1972). Although there is no universal consensus among the academics related to predictive ability of the CAPM, these theories are mainly used for this study. Literature work which is related to this study, different approaches and latest studies done by researchers will be presented in this part.
Evidences related to positive relationship between advertising expenditure and the market value of the firms were provided by Joshi and Hanssens (Joshi & Hanssens, 2010). They analyzed the long-term relationship between advertising spending and market capitalization through Vector-Autoregressive (VAR) model. They used the
related to sporting goods industry. They found that advertising affects the return of the company stocks. This correlation was beyond the effect of advertising on revenue and profit.
The financial impact on the firm’s market value which was caused by new product introduction was researched by Chaney, Devinney and Winer (Chaney, Devinney, & Winer, 1991). They used traditional event study methodology to conduct the study. In this study, firm actions related to new product releases took on the form of discrete interventions. They used the new product introductions between 1975 and 1984, stock returns related to day which new product announcement released and subsidiary accounting information in their study. It was concluded that the reaction of the market to the announcement was related to the number of products announced and whether the product was really new in the market.
The Effect of Firm-Specific News to Stock Performance: Case of BIST-30 Companies is the paper evaluating the effects of the news announced by the companies traded at BIST-30 for the period of January 2003 to December 2012 on the stock performance. The firm specific news related to corporate governance, financial announcements, legal announcements, operational announcements and announcements regarding restructuring were examined in this study. Event study method was used for data analysis. They found that on the day of the incident, it was revealed that investors were most sensitive to announcements related to operational, financial and restructuring (Eyüboğlu, 2014).
Studies related to the impact of price promotions on the revenue of the firms was researched by Slotegraaf and Pauwels (Slotegraaf & Pauwels, 2008). They used panel data from September 1989 to May 1997 from 100 brands across seven product categories. They employed several methodological steps which included Unit Root and Cointegration Tests, Model of Dynamic Interactions, Policy Simulation Analysis and Sequential Regression. The findings showed that it was fairly
common that promotions had positive impact on sales especially for small brands. In addition, brands with higher equity and more product introductions were affected more by permanent and cumulative sales caused by marketing promotions.
The effect of product market advertising on liquidity of the common stock and the breadth of the ownership was examined by Grullon, Kanatas and Weston (Grullon, Kanatas, & Weston, 2004). They used financial and non-financial data for examination over the period of 1993-1999. They employed several methodological steps which included Univariate Analysis, Regression Analysis and Matched Sample Methodology. The findings showed that as the firms spent more on advertising in the case of ceteris paribus assumption, it caused the attraction of larger number of investors to the company stocks.
The effect of advertising activities (in terms of advertising expenditure) on the firms’ stock returns both in the short and long run studied by Chemmanur and Yan (Chemmanur & Yan, 2019). Furthermore, they linked this effect to the investor attention argument. They used financial data covering the period of 1996 to 2005. They employed Fama-French Factor Model and various benchmarks to analyze the impact of advertising on stock returns. They concluded that, the greater the amount of advertising expanditure is linked with larger stock return for the advertised year. However, stock return started to diminish after the first year.
The perception of the companies’ advertising in specific advertising seasons in terms of stock price performance from the financial investor framework including stakeholders and investors studied by Kim and Morris (Kim & Morris, 2003). The sample of Super Bowl advertisements related to 35 companies for the years which include 1998, 1999 and 2000 were chosen for examination purpose. To explore relationship between stock price performance and consumer behavior, Ad-Meter
information related to companies. Event-study method was employed to analyze the effect of advertising on the company’s stock price. The findings showed that advertised companies had significantly different stock price performance compared to the pre-advertisement period for the sample customers.
PART 3: METHODOLOGY
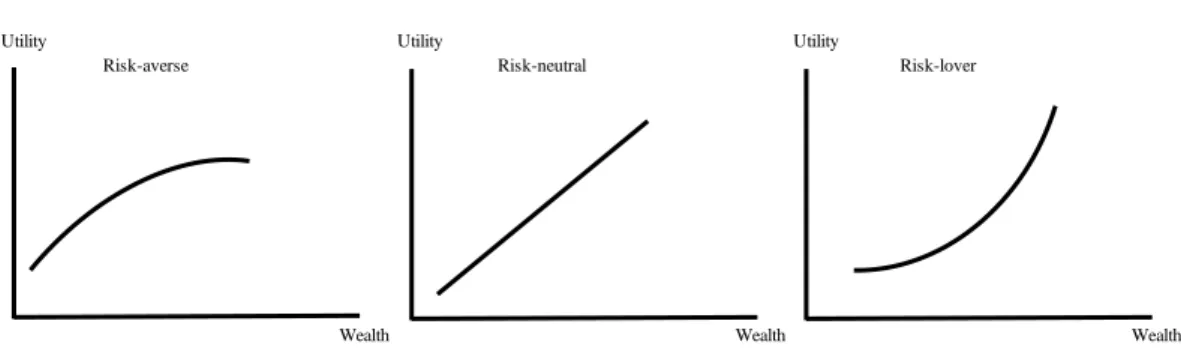
Investing in markets is all about risk and return. There is no investment which is inherently completely safe. However, not all human beings want to take huge risks with their hard-earned money. Portfolio management theories put investors into categories based on the appetite for risk. Identifying investor types helps us to interpret the consequences of investments. Financial investors are commonly categorized in three types: risk averse, risk neutral and risk lover.
Risk-averse (or risk-avoiding) investor is an investor who prefers lower returns with known risks rather than higher returns with unknown risks. Risk neutral investor is an investor who ignores the risk completely when
making an investment decision.
Risk lover (or risk-seeker) investor is an investor who prefers an investment opportunity with an uncertain consequence rather than one with the same expected returns and certainty that he/she will be delivered.
Figure 3.1: Utility Functions
Utility Utility Utility
Risk-averse Risk-neutral Risk-lover
In the paragraph above, I have briefly summarized the relationship between risk and investor. In order to explain the model that I employed in my thesis; I will briefly explain the theories in portfolio management in the following paragraphs chronologically.
The term portfolio refers to a collection of assets or investments held by financial institutions, investment firms, hedge funds or individuals which may include cash or cash equivalents, government or company bonds, stocks, precious metals and properties. In general, the aim of the construction of the portfolio which consists of different securities or other assets is to earn investment gain. Deciding the asset allocation while construction of the portfolio is related to risk tolerance of the investor. The aim of the asset allocation is to maximize the expected return and minimize the risk. Risk tolerance of the investor is one of the most important factors in deciding asset allocation.
The main purpose of creating a portfolio is to increase the number of assets invested and distribute the risk. There are studies on this subject in the literature. Traditional Portfolio Theory and Modern Portfolio Theory can be given as building blocks of the portfolio theories.
It is thought that the risk will be reduced by increasing the number of securities in the portfolio in the Traditional Portfolio Theory. The aim of this theory is to maximize the benefits that the investor will provide. Portfolio return is the sum of the dividends of the securities that constitute the portfolio and the increase in value in a certain period. The main purpose of creating a portfolio is to distribute the risk. Since the returns of the securities forming the portfolio will not move in the same direction, the risk of the portfolio will be smaller than the risk of investing in a single security. It is assumed that, with the increase in the number of securities, the
3.1 MODERN PORTFOLIO THEORY
Harry S. Markowitz, who is considered to be the founder of the Modern Portfolio Theory, argued the possibility of designing an ideal portfolio which would provide the investor maximum returns by taking on the optimal amount of risk in his article ‘Portfolio Selection’ published in 1952. In its essence, he asserted that the investors could reduce their portfolio risk through diversification using a quantitative method. He won the Nobel Prize at 1990 for his contributions to the financial economics and corporate finance fields with his essay “Portfolio Selection” (1952) and later more extensive study “Portfolio Selection: Efficient Diversification” (1959).
The risk component of MPT can be measured and reduced via the concept of diversification. The aim of the diversification is to properly choose a weighted collection of assets that together exhibit lower risk than any individual asset. As a core concept of the MPT, diversification is relying on the conventional wisdom of “never putting all your eggs in one basket” (Fabozzi, Gupta, & Markowitz, 2002)
MPT has assumptions related to markets and investors. Some of the main assumptions of the Markowitz’s Portfolio Theory are as such:
All investors are rational, so they seek to maximize returns while minimizing risk,
Investors’ decision is only affected by return and variance,
All investors are only willing to accept higher amounts of risk if they are compensated by higher expected returns,
All investors timely receive all pertinent information related to their investment decision,
Markets are perfectly efficient and do not include transaction costs or taxes, It is possible to select securities whose individual performance is
3.1.1 Risk and Return
In general, all investments include some risk which limits investment gain or may even lead to the loss of capital. These risks can change depends on the nature of portfolio which you invest your capital depending on volatility risk, exchange risk, inflation risk or business risk etc. This concept generally referred as risk-return relationship in literature.
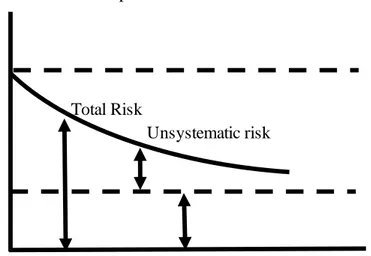
Systematic risk refers to market risk which cannot be diversified such as changes in interest rates, fluctuations on exchange rates, inflation etc. This risk is also known as common risk.
Unsystematic risks refer to risk specific features of an asset such as decreasing revenues related to a stock, change on management etc. This risk is also known as diversifiable risk.
Figure 3.2: Systematic and Unsystematic Risk
3.1.2 Efficient Frontier
Standard deviation of portfolio return
Total Risk
Unsystematic risk
securities producing the highest expected return for a given risk level or the lowest risk for a given level of expected return. The portfolios which maximize returns for the given level of risk assumed are graphically represented by the efficient frontier. The investment combinations which constitute the portfolio determines the investment return. The risk is synonymous with the standard deviation of a security. As the covariance between securities which constitute portfolio lower, the portfolio standard deviation results lower as well. Efficient frontier does not move in straight line, rather in a curve, providing diversification. Since the portfolios which lie under the efficient frontier do not provide sufficient return for the given level of risk compared to other portfolios, they are sub-optimal. Furthermore, since the portfolios which cluster at the right of the efficient frontier have higher level of risk compared to other portfolios for the defined rate of return, they are also sub-optimal. (Investopedia, 2020)
Figure 3.3: Efficient Frontier
3.2 CAPITAL MARKET THEORY
The Markowitz’s portfolio theory was extended with the work of William Sharp who examined the implications of introducing a risk-free asset to Modern Portfolio Theory in the mid of 1960s’s. Although William Sharpe was generally credited with developing the theory, John Linter and John Mossin also developed similar models
Expected return
Efficient frontier
independently. This theory is an important aspect in decision making process for investors on security prices. The Capital Market Theory demonstrates the trade-off between security returns and risk that should exist if the portfolio is constructed according to Modern Portfolio Theory. Some of the main assumptions of the Capital Market Theory are as such:
All investors choose investments on the basis of expected return and risk which mean they are all on the Markowitz efficient.
All investors can borrow or lend any amount at a risk-free rate of interest. All investors have homogeneous expectations for returns.
Capital markets are in equilibrium and there is no transactions costs, taxes or inflation.
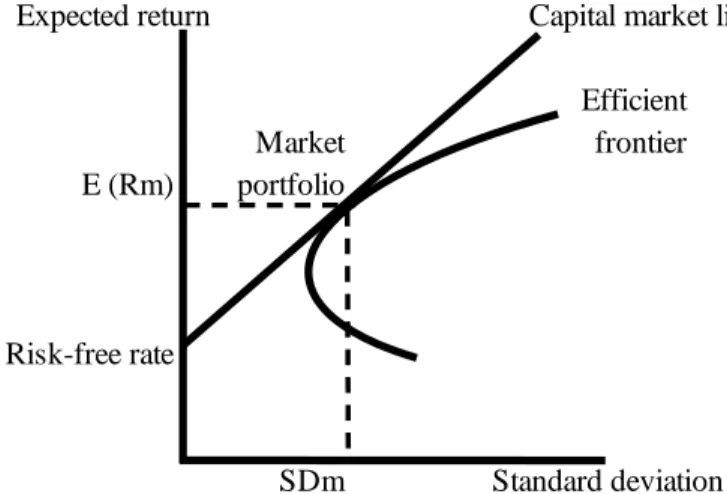
3.2.1 Capital Market Line
Capital Market Line is a graph which shows the portfolios that optimally combining all possible risk and return between the market portfolio and risk-free asset. The most prominent difference of Capital Market Line from the Efficient Frontier is that it includes the risk-free asset since Efficient Frontier represent all possible combinations of efficient portfolios which include only risk asset in varying proportions.
The intercept point of the Capital Market Line and Efficient Frontier is called Market or Tangency Portfolio. Given the Capital Market Theory assumptions, Tangency Portfolio is the most efficient portfolio.
Figure 3.4: Capital Market Line and Efficient Frontier
3.3 CAPITAL ASSET PRICING MODEL
Capital Asset Pricing Model is a general equilibrium model which was studied independently by Treynor (1961-1962), Sharpe (1964) and Linter (1965). Capital Asset Pricing Model evolved on the model of portfolio choice developed by Markowitz (1959). Efficient Frontier and Capital Market Line concepts, which were mentioned in previous sections, were improved by Sharpe in his work written in 1964. He later won the Nobel Prize for his work in developing models to aid investment decisions.
Capital Market Theory was extended by the Capital Asset Pricing Model that investors could evaluate the risk-return exchange for both portfolios and individual security. Capital Asset Pricing Model redefined the risk from total volatility to undiversifiable part of the total volatility through beta coefficient. Beta calculated the systematic risk of individual securities in comparison to market portfolio. It was used in the model as measure of volatility in comparison to the whole market portfolio. Sharpe (1964) stated in his study that the expected return of a portfolio depended on its systematic risk or beta. Some of the main assumptions of the Capital Asset Pricing Model are as such:
Expected return Capital market line
Efficient
Market frontier
E (Rm) portfolio
Risk-free rate
The market is perfectly competitive that investors have no ability to influence the price on their own. They are price takers.
All investors have the same plan for one-period horizon which usually named as myopic behavior.
All investors make investment decisions based on the basis of risk and return.
There is no friction in the market such as taxes or transaction costs. All investors can lend or borrow any amount at risk-free rate.
All investors analyze securities in the same way and have the homogenous expectations regarding future expected returns, correlations and volatilities. Investors share the same economic view of the market and all information is available to them at the same time.
3.3.1 Beta
The relationship between risk (more specifically the systematic risk) and expected return for securities is described by the beta in Capital Asset Pricing Model. A security's beta is calculated by dividing the covariance of the security's returns and the market's returns by the variance of the market's returns for a specified time period. Beta is used in finance to figure out if the stock is in the same direction as the rest of the market or not. The interpretation of the beta is given below:
Beta = 1 means that the volatility of the market will be reflected exactly by the security.
Beta > 1 means that the volatility of the security is more than the market. 0 < Beta < 1 means that the volatility of the security is less than the market. Beta = 0 means that the volatility of the market will not be reflected by the
security. It means they are uncorrelated.
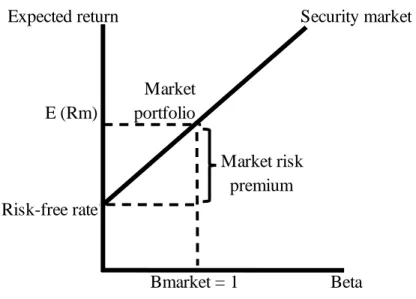
3.3.2 Security Market Line
Security Market Line can be defined as the visualized graphical representation of Capital Asset Pricing Model. Since Capital Asset Pricing Model describes the risk-return relationship between securities, horizontal axis of the Security Market Line represents the expected return, vertical axis of the chart represents the systematic risk or market risk in terms of beta. Security Market Line is defined as given equation:
E(𝑅𝑖) = 𝑅𝑓 + 𝛽𝑖 [E (𝑅𝑀) - 𝑅𝑓]
The slope of the Security Market Line is equal to the market risk premium which means expected market return exceeds the risk-free rate and reflects the risk-return trade off at a given time. It is assumed that the investors are risk averse, therefore a premium is expected by investors in exchange for the volatility of a higher risk investment. With the assumptions which are stated at previous section, Security Market Line covers the whole capital investments in the world.
Figure 3.5: Security Market Line
Expected return Security market line
Market E (Rm) portfolio Market risk premium Risk-free rate Bmarket = 1 Beta
3.4 THE MODEL
The aim of this dissertation is to research on the impact of discounted ticket ads on airlines stock price with an empirical analysis for Pegasus Airlines.
The Capital Asset Pricing Model, denoted CAPM, is used for this research. The classical version of the CAPM can be seen in the given formula:
(𝑟𝑖𝑡 – 𝑟𝑓𝑡) = 𝛼𝑖 + 𝛽𝑖 (𝑟𝑚𝑡 – 𝑟𝑓𝑡) + 𝜖𝑖𝑡
Where:
𝑟𝑖𝑡 = the rate of return on asset i (or portfolio) at time t,
𝑟𝑚𝑡 = the rate of return on the market portfolio at time t,
𝑟𝑓𝑡 = the risk-free rate at time t,
𝛼𝑖 = intercept term of stock,
𝛽𝑖 = the beta of stock I,
𝜖𝑖𝑡 = the random disturbance term in the regression equation at time t.
The extra variables have been added to classical CAPM model to explain relationship between them. In my airlines industry research, I have found out that the most important factors affecting the share price of airline companies are public announcements, currency and oil prices.
rit− rft = ai+ βi(rmt− rft) + βeurreurt+ βusdrusdt+ βoilroilt
3.4.1 Pegasus Airlines Stock Return Calculation
Pegasus Airlines stock return is calculated by subtracting closing day(t) price of the stock from closing day(t-1) price of the stock and logarithmic return of both days are taken as below formula:
ri = log Closing Stock Pricet log Closing Stock Pricet−1
3.4.2 Risk-Free Interest Rate Calculation
Central Bank of the Republic of Turkey (CBRT) 1-year bond price is converted to the daily rate to calculate the risk-free interest rate in order to be able to compute the excess return for the stock and the market. The logarithmic return of the daily risk-free rate is given as below formula:
rft1 = (1 + r365)3651 − 1
rft = log rft1
3.4.3 BIST-100 Index Return Calculation
BIST-100 index return is calculated by subtracting closing day(t) BIST-100 index from closing day(t-1) BIST-100 index and logarithmic return of both days are taken as below formula:
rmt =
log BIST100 Index Closingt log BIST100 Index Closingt−1
3.4.4 Pegasus Airlines Stock Excess Return Calculation
Excess return for Pegasus Airlines stock price is calculated by subtracting daily logarithmic risk-free interest rate of CBRT 1-year bond price from Pegasus Airlines stock return.
rit− rft
3.4.5 BIST-100 Index Excess Return Calculation
Excess return for BIST-100 index is calculated by subtracting daily logarithmic risk-free interest rate of CBRT 1-year bond price from BIST-100 index return.
rmt− rft
3.4.6 Brent Oil Return Calculation
Brent oil return is calculated by subtracting closing day(t) price of the Brent from closing day(t-1) price of the Brent and logarithmic return of both days are taken as below formula.
roilt = log Closing Brent Oil Pricet log Closing Brent Oil Pricet−1
3.4.7 USD/TL Return Calculation
USD/TL return is calculated by subtracting closing day(t) price of the USD/TL from closing day(t-1) price of the USD/TL and logarithmic return of both days are taken as below formula.
rusdt = log Closing USD/TL Pricet log Closing USD/TL Pricet−1
3.4.8 EUR/TL Return Calculation
EUR/TL return is calculated by subtracting closing day(t) price of the EUR/TL from closing day(t-1) price of the EUR/TL and logarithmic return of both days are taken as below formula.
3.4.9 Campaign Dummy
Campaign Dummy has been added as given below. A comprehensive description is given in the Data section.
Dcampaignt
= 1 if there is a campaign made by Pegasus Airlines on the day t and 0 otherwise.
3.4.10 KAP Dummy
KAP Dummy has been added as given below. A comprehensive description is given in the Data section.
Dkapt
= 1 if there is an announcement made on KAP on the day t and 0 otherwise.
PART 4: DATA
All data used in the CAPM model are presented in the following subsections.
4.1 PEGASUS AIRLINES STOCK PRICE AND BIST-100 INDEX
The data of the dependent and independent variables used in the model was proceeded by taking the log return. Since the model was built on Pegasus Airlines stock excess return, it was been computed by taking log return on Pegasus Airlines stock price and BIST-100 index.
The closing prices at the end of the day for both stock and index were obtained by Bloomberg Terminal for research period between 01.10.2018 and 01.11.2019. The figures related to stock price and index change given below were prepared in Microsoft Excel. CAPM model were studied and results were obtained on the Eviews.
Central Bank of the Republic of Turkey 1-year bond price was converted to the daily rate to calculate the risk-free interest rate in order to compute the daily excess return for the stock and the market.
Figure 4.1: Pegasus Airlines Daily Stock Price for Research Period
(Bloomberg L.P., 2019)
Figure 4.2: BIST-100 Index for Research Period
(Bloomberg L.P., 2019) 15,00 25,00 35,00 45,00 55,00 65,00 75,00 1.10 .201 8 1.11 .201 8 1.12 .201 8 1.01 .201 9 1.02 .201 9 1.03 .201 9 1.04 .201 9 1.05 .201 9 1.06 .201 9 1.07 .201 9 1.08 .201 9 1.09 .201 9 1.10 .201 9 1.11 .201 9 80.000 85.000 90.000 95.000 100.000 105.000 110.000 1.10 .201 8 1.11 .201 8 1.12 .201 8 1.01 .201 9 1.02 .201 9 1.03 .201 9 1.04 .201 9 1.05 .201 9 1.06 .201 9 1.07 .201 9 1.08 .201 9 1.09 .201 9 1.10 .201 9 1.11 .201 9
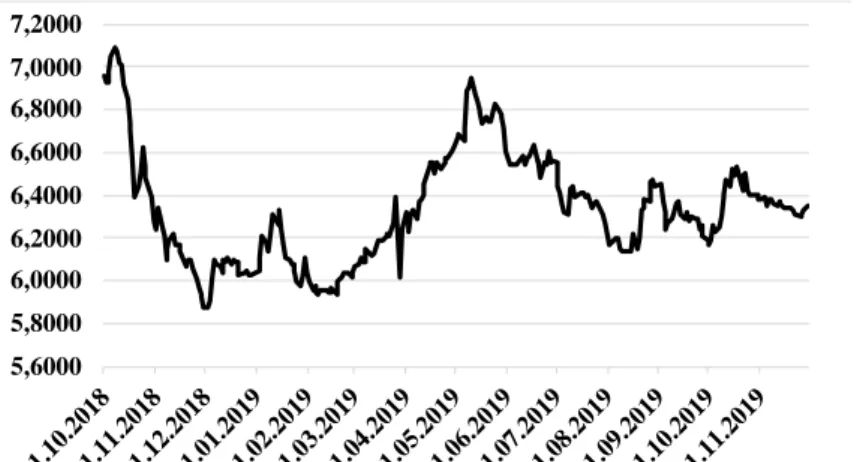
4.2 USD, EUR AND BRENT OIL
The closing prices at the end of the day for both EUR/TL and USD/TL were obtained by the Central Bank of the Republic of Turkey Electronic Data Delivery System for research period between 01.10.2018 and 01.11.2019. Since there were two different rates (sell and buy), exchange rates were determined by average of sell and buy rate. Brent oil prices were obtained by Investing web site. The figures related to price change given below were prepared in Microsoft Excel. CAPM model were studied and results were obtained on the Eviews.
Due to the fact that the foreign currencies (USD and EUR) were volatile in the period of the thesis study, it was computed by receiving a log return.
There are academic studies in literature devoted to the analysis of energy markets to investigate the impact of changes in exchange rates on oil prices. The impact of changes in the USD/EUR exchange rate on crude oil was investigated by Breitenfellner and Cuaresma (Breitenfellner & Cuaresma, 2008). They provided evidences that USD/EUR exchange rates did matter in forecasting commodity prices for given research period. Although the causality aspect being uncertain, oil price forecasts were improved significantly by the exchange rate information. They aimed to explain the negative correlation between USD/EUR exchange rate and crude oil prices with five possible channels: the purchasing power of oil export revenues for suppliers and local prices in non-U.S. dollar regions for demand side, investments in crude related asset markets, the monetary policy regime in oil-exporting countries and the efficiency of the currency market.
Given the relationship between oil price and exchange rates, Brent Petrol data was computed by receiving a log return to be consistent with USD and EUR data. Central Bank of the Republic of Turkey 1-year bond price was converted to the daily rate to calculate the risk-free interest rate in order to be able to compute the daily return for the USD/TL, EUR/TL and Brent oil.
Figure 4.3: USD/TL Exchange Rate for Research Period
(TCMB, 2019)
Figure 4.4: EUR/TL Exchange Rate for Research Period
(TCMB, 2019) 5,0000 5,2000 5,4000 5,6000 5,8000 6,0000 6,2000 6,4000 1.10 .201 8 1.11 .201 8 1.12 .201 8 1.01 .201 9 1.02 .201 9 1.03 .201 9 1.04 .201 9 1.05 .201 9 1.06 .201 9 1.07 .201 9 1.08 .201 9 1.09 .201 9 1.10 .201 9 1.11 .201 9 5,6000 5,8000 6,0000 6,2000 6,4000 6,6000 6,8000 7,0000 7,2000 1.10 .201 8 1.11 .201 8 1.12 .201 8 1.01 .201 9 1.02 .201 9 1.03 .201 9 1.04 .201 9 1.05 .201 9 1.06 .201 9 1.07 .201 9 1.08 .201 9 1.09 .201 9 1.10 .201 9 1.11 .201 9
Figure 4.5: Brent Oil/USD Price for Research Period
(Investing, 2019)
Augmented Dickey Fuller test was performed at level for all three raw data. ADF is a statistical test designed to test whether a given time series is stationary or not. It is one of the most frequently used statistical tests in stationary analysis of a series. ADF test is essentially a statistical significance test that there is a hypothesis testing involved with a null and alternate hypothesis and as a result a test statistic is computed, and p-values get reported. From the test statistics and the p-value, you can draw an inference whether a given series is stationary or not.
As a result of the ADF test, we do reject the null hypothesis (the data needs to be differenced to make it stationary) at %5 and %10 critical values for the Brent Oil. However, we do not reject the null hypothesis at %1 critical value. We do not reject the null hypothesis at all critical values (%1, %5 and %10) for USD/TL. Although we do reject the null hypothesis at %10 critical values, we do not reject the null hypothesis at %1 and %5 critical value for EUR/TL. Test results are given at Table 4.1 below. As a result, it was considered necessary to use all three data with log returns. 45 50 55 60 65 70 75 80 85 90 01.1 0.20 18 01.1 1.20 18 01.1 2.20 18 01.0 1.20 19 01.0 2.20 19 01.0 3.20 19 01.0 4.20 19 01.0 5.20 19 01.0 6.20 19 01.0 7.20 19 01.0 8.20 19 01.0 9.20 19 01.1 0.20 19 01.1 1.20 19
Table 4.1: ADF Test Results for Brent Oil, USD/TL and EUR/TL Raw Data
Note: *MacKinnon (1996) one-sided p-values.
ADF test was performed again at the level of all three data with log returns for the reasons detailed above. As a result of taking log return for all variables, we can conclude that null hypothesis can be rejected at given %1, %5 and %10 critical values. To sum up, given series are stationary at the end of the process.
4.3 CAMPAIGN DUMMY VARIABLE
At the time of the thesis study, all advertisements that can be accessed retrospectively in the campaigns section of the Pegasus Airlines website have been selected as the main mass. Outdated campaign information that is still published until certain date is excluded as actual campaign time has passed
According to the Pegasus Airlines website, there are two different date ranges, namely “sales date” and “flight date” for ticket campaigns. Sales dates refer to the dates when customers can purchase discounted tickets within the scope of the campaign. The sale of discounted tickets between 10.10.2018-13.10.2018 (four days) can be given as an example. The flight date refers to the date range that can be flown after purchasing a ticket. It can be given as an example to determine any
t-Statistic Prob.*
ADF test statistic -2,9469 0,0414
1% level -3,4530
5% level -2,8714
10% level -2,5721
ADF test statistic -1,9785 0,2963
1% level -3,4527
5% level -2,8713
10% level -2,5720
ADF test statistic -2,5871 0,0968
1% level -3,4527
5% level -2,8713
10% level -2,5720
EUR/TL
Test ciritical values Brent Oil
Test ciritical values
USD/TL
impact of discounted ticket ads on airlines stock price will be carried out on the sales dates.
Within the scope of the thesis study, there are thirty three campaign information that can be accessed on the Pegasus Airlines website between 01.10.2018-30.11.2019. (Pegasus Airlines Kampanyalar, 2019) The subject of nine campaigns consists of customer loyalty points gained from Pegasus Airlines, customer loyalty points gained from cooperated companies and special non-flight discounts. Since the content of nine related campaigns is irrelevant of the ticket discount that constitutes the thesis topic, they are excluded from the sample. As a result of the exclusions, the total number of campaigns to be examined within the scope of the thesis has been determined as twenty four. The total number of days open for sale of twenty four campaigns are ninety.
Since the BIST is closed on weekends and public holidays in Turkey, the relevant dates are excluded from the scope of the study and no sample data is included. A total of forty one campaign days excluded from the sample in this context.
As a result of the exclusions detailed above, a total of forty nine campaign days were included in the sample.
4.4 KAP DUMMY VARIABLE
Since the Efficient Market hypothesis in financial economics implies that stock prices reflect all known information about the firm’s future earnings prospects (Fama, 1970), market prices should only react to information which is new.
Pegasus Airlines has been listed on the Turkish Stock Exchange or Borsa Istanbul (BIST) since 2013. In the case of events that give rise to insider information and continuous information, capital market instruments are obliged to make disclosures at the Public Disclosure Platform (KAP) using the relevant forms. KAP is an electronic system where notifications to be disclosed to the public in accordance
with the capital market and exchange legislations (BIST, 2019). Regulatory Authority Announcements, Financial Reports, Material Event Disclosures, and Other company related announcements can be seen through this platform. Information given below have been taken from (KAP, 2019);
Regulatory Authority Announcements:
Announcement of Stock Exchange General Directorate Announcement Regarding Code Change
Announcement Regarding Delisting
Announcement Regarding Derivatives Market Last Trading Date and Maturity Date
Announcement Regarding Derivatives Market Transaction Cancellation Announcement Regarding Funds
Announcement Regarding Market Change
Announcement Regarding Suspension/Re-activation Announcement Regarding Warrants
Appointment of Liquidity Provider Appointment of Market Maker
BIST Announcement Regarding Corporate Actions BIST Stock Indices
BISTECH Equity Market Trading System Announcement BIST-KYD Indices
Borsa Istanbul A.Ş. Announcement
Capital Market Board Administrative Measures Capital Market Board Announcement
Capital Market Board Decision About Non-Publicly Traded and Banned Shares
CMB Bulletin
CMBs Assessment Regarding Financial Report Additional Time Demands Continuation of Trading Suspend
Corporate Actions
Corporate Actions - Cash Dividend Payment
Corporate Actions – Redemption/Coupon Yield/Profit Share Payment Date of Rights Coupon Market
Debt Securities Starting to Trade
Debt Securities that will be Sold in Qualified Investors Market Default Transaction
ETFs Starting to Trade
Ex-Date as to Stock Exchange Procedures Foreign Investors Transactions
Index Announcement
Investor Based Measure Systems
Investor Compensation Center Announcement
İstanbul Takas ve Saklama Bankası A.Ş. Announcement Lease Certificates Starting to Trade
Lease Certificates taht will be Sold in Qualified Investors Market List of ABCD Group Stocks
Merkezi Kayıt Kuruluşu A.Ş. Announcement MKK Member Code Changes
MKK Membership
MKK Membership Status Change
Pay Mali Hak Kullanım İşlemi – Nakit Ödeme (en) Periodical Assessment Criteria Announcement Primary Market Announcement
Public Disclosure Platform Announcement Public Offer of Stocks in the exchange
Reference Price for Rights Coupon Regulatory Authority Announcement
Removal of Capital Market Board Registration due to Transaction Ban Execution
Securities to Trade on Debt Securities Market
Sermaye Piyasası Kurulu Başvuru Sonucu (Haziran 2016 öncesi) (en) Sermaye Piyasası Kurulu Başvurusu (Haziran 2016 öncesi) (en) Situation of Trading
Stock Exchange Board Decision Stocks Starting to Trade
Stocks Whose Maximum Lot Quantity Changed Structured Debt Securities Starting to Trade Takasbank Money Market Daily Bulletin
Takasbank Securities Lending Market Daily Bulletin Test Notification
Trading Suspension Announcement – Circuit Breaker Transaction Cancellation
Transformation of Shares to Trading Shares Warrants or Certificates Starting to Trade Warning of Company
Wholesale Transactions
Financial Reports: Financial Report Integrated Report
Operating Review Report Statement of Responsibility
Acquisition
Additional Payments to Employees other than Monthly Salary
Adverse Opinion or Disclaimer of Opinion in Independent Audit Report Amendment of Financial Statement and – or Notes to Financial Statements Application for Market Change
Bankruptcy/Suspension of Bankruptcy Board of Director’s Subcommittees Cancel Corporate Action
Capital Increase/Decrease
Capital Market Instruments other than Shares’ Transaction Notification Change in Article of Association
Change in City that Activities or Income Concentrated on Change in Head Office Address
Change in Main Subject of Activity Change in Market Advisor of Company Change of Company Title
Corporate Governance Compliance Rating Credit Rating
Demerger
Determination of Independent Audit Company Disclosure Policy
Disposal of Buy-Back Shares Dividend Payment
Dividend Policy
Enforcement Proceedings Forward Looking Evaluations General Meeting
Lawsuit Against Company or Developments in the Lawsuit Against Company
Loss or Damage of Assets
Material Event Disclosure (General) Merger
New Business Relation Non-current Asset Purchase Non-current Asset Sale
Non-current Financial Asset Acquisition Non-current Financial Asset Sale
Notification About News or Rumors
Notification Regarding Advance Dividend Payment Notification Regarding Authorized Capital
Notification Regarding Capital Market Instruments Based on Shares Notification Regarding Conversion
Notification Regarding Delisting
Notification Regarding Investors Bought more than 5% of Securities in IPO Notification Regarding Issue Limit
Notification Regarding Issue of Capital Market Instrument Notification Regarding Other Cash Payment
Notification Regarding Other Share Issue / Cancellation Notification Regarding Retirement Right
Notification Regarding Share Buy-Back
Notification Regarding Share Purchases via Takeover Bid Notification Regarding Shares Kept Ready for Sales
Notification Regarding Squeeze Out and Sale Out Rights Notification Regarding Technical Management
Notification Regarding Brokerage Houses Warrants – Certificates – Notes Partial or Complete Suspension or Impossibility of Operations