Business Cycles and Workers’
Remittances: How Do Migrant Workers
Respond to Cyclical Movements of GDP
at Home?
© 2006 International Monetary Fund WP/06/52
IMF Working Paper
IMF Institute
Business Cycles and Workers’ Remittances: How Do Migrant Workers Respond to
Cyclical Movements of GDP at Home?
Prepared by Serdar Sayan
1Authorized for distribution by Andrew Feltenstein
February 2006
Abstract
This Working Paper should not be reported as representing the views of the IMF.
The views expressed in this Working Paper are those of the author(s) and do not necessarily represent those of the IMF or IMF policy. Working Papers describe research in progress by the author(s) and are published to elicit comments and to further debate.Workers’ remittances are often argued to have a tendency to move countercyclically with the
GDP in recipient countries since migrant workers are expected to remit more during down
cycles of economic activity back home. Yet, how much to remit is a complex decision
involving other factors, and different variables driving remittance behavior are differently
affected by the state of economic activity over the business cycle. This paper investigates the
behavior of workers’ remittances flows into 12 developing countries over their respective
business cycles during 1976-2003 and finds that countercyclicality of receipts is not
commonly observed across these countries.
JEL Classification Numbers: E32, F22, F49, J61
Keywords: workers’ remittances, business cycles, consumption vs. investment motive
Author
(s) E-Mail Address: [email protected]
1
Bilkent University, Ankara, Turkey and Ohio State University, Columbus, OH. This paper was
written while the author was visiting the IMF. He gratefully acknowledges financial support
from the Global Development Network and the infrastructure provided by the IMF Institute
where he benefited from useful discussions with Ralph Chami and Nikola Spatafora of the IMF
Research Department. He also thanks Dilip Ratha of the World Bank for the annual remittances
data and the encouragement for this study.
Contents Page
I. Introduction……….. 3
II. Some Stylized Facts and Cyclicality of Remittances……….... 4
III. Analysis of the Cyclical Characteristics of Remittances………... 6
IV. Results ……….. 10
V. Concluding Remarks ……… 15
Appendix ………...……….. 16
References ……… 18
Tables 1. Estimated Trends for the Total Output and Real Remittance Receipts of the Group of 12 ... 9
2. Cross Correlations between Real GDP at time t (t = 1976, …, 2003) and Real Remittances (Rrem) at t+i (i = -1, 0, 1) ……… 11
3. Cross Correlations Between Real GDP at time t in Turkey and Real Remittances from the Turkish Workers in Germany at t+i (i = -4, -3, -2, -1, 0, 1, 2, 3, 4) ….. 15
A1. Estimated Trend Equations for Real GDP ……… 16
A2. Estimated Trend Equations for Real Remittances ……… 17
Figures 1. Remittance Receipts by Low- and Middle-Income Developing Countries: World Totals, 1990-2003 .………. ……… 5
2. Remittance Receipts by Low- and Middle-Income Developing Countries in the Sample ………. 7
3. Total Real GDP (Weighted) of the Countries in the Sample and Its Trend …….. 9
4. Total Real Remittance Receipts (Weighted) by the Group and Its Trend ……… 10
5. Output and Remittance Cycles in Jordan ……….. 13
I. INTRODUCTION
Having grown rapidly since the 1970s, workers’ remittances have become an increasingly important channel for meeting external financing needs of developing countries, eventually proving to be one of the largest sources of such financing (Ratha, 2003; Spatafora, 2005). With steady increases after 1990 (with the exception of a slight decline in 1998), total remittance receipts by developing countries reached 116 billion dollars in 2003, representing more than 1.5 percent of their total GDPs as a group.
Aside from the significance of this magnitude, remittances are generally a less volatile, hence more dependable, source of funding than private capital flows and foreign direct investment (FDI) (Ratha, 2003; Buch and Kuckulenz, 2004). Being unilateral transfers, they do not create any future liabilities such as debt servicing or profit transfers. Furthermore, remittances are argued to have a tendency to move countercyclically with the GDP in recipient countries, as migrant workers are expected to increase their support to family members during down cycles of economic activity back home so as to help them compensate for lost family income due to unemployment or other crisis-induced reasons. Wherever true, such a countercyclicality enables remittances to serve as a stabilizer that helps smooth out large fluctuations in the national income over different phases of the business cycle. Yet, as shown by a considerable number of studies in the existing literature, the decision to remit is a complex phenomenon involving other factors than the motivation to help finance current (as opposed to future) consumption spending of family members and relatives back home (see, for example, Russell, 1986). Given that different variables driving the remittance behavior are differently affected by the state of economic activity over the business cycle, it is conceivable that remittances may be procyclical or even acyclical with the output in some of the recipient countries.2 In the case of procyclicality, remittances may act as a destabilizing force since this would increase the capacity of swings in remittance flows to produce additional fluctuations in output or current account balances, with serious macroeconomic effects (Sayan, 2004).3 Furthermore, any parallel reductions in remittances during the times of sharp output drops would deepen the crises even further, contributing to economic instability and lowering the credibility of recipient countries at times of greater need for external funding. It is therefore important to know whether remittances respond positively or negatively to movements of GDP over the business cycle for different countries.
2
An often overlooked fact in the literature is that remittances should also respond to the state of economic activity in the host countries (Sayan, 2004). Even if remittances move countercyclically with the output in the home countries of migrant workers, the cycles in home and host country economies may move together in sync, thereby making it difficult for migrant workers employed in a crisis-struck economy to help out family members facing similar conditions back home. In fact, the remittance flows themselves may contribute to the transmission of the effects of a contraction in the host economy to the recipient country through the reductions in the amounts remitted by migrant workers in a synchronized fashion or with a phase difference (Sayan and Tekin-Koru, 2005).
3
A strong case in point can be made by considering the disastrous consequences of the 1990-91 conflict in the Middle East for the economies receiving large amounts of remittances from Kuwait and other countries in the region (Wahba, 1991).
This paper considers the countercyclicality versus procyclicality issue in the context of remittances received by a group of 12 low-income (LI) and lower-middle income (LMI) countries by defining (business) cycles as the deviations of (real GDP) real variables from their respective trends as in Lucas (1977) and Kydland and Prescott (1990). Thus, cyclical characteristics of remittances are examined here by looking at the co-movements between deviations from trend of real remittances and those of real GDP. This approach is different than looking at the relationship between the GDP of recipient countries and remittances based on regression results. Any negative (positive) relationship between real output and
remittances found from multiple regression exercises based on time series or panel data does not necessarily imply that remittances are countercyclical (procyclical) to the business cycle. Even though some authors tend to use this term, any parameter estimate capturing the relationship between real GDP and remittance receipts for one or more countries over a sample period refers to the whole period and does not necessarily capture the co-movements of remittances with the real GDP as the latter cyclically fluctuates up and down along a trend with alternating growth and stagnation/crisis episodes during the sample period.
The analysis here separately treats 12 countries in the sample individually and as a group. The results obtained provide evidence that remittances are procyclical/acyclical with the output for some countries within the group, even though remittances received by the group as a whole are countercyclical and lead the aggregate GDP cycle by one period.4 In other words, savings remitted to the home countries of workers abroad tend to increase (decrease) after a period of stagnation/crisis (growth/boom) at home, as far as the entire group is concerned. This
behavioral pattern, however, is not common across countries within the group implying that panel evidence for a group of countries may conceal important country-specific
characteristics.
The discussion in the rest of the paper is organized as follows. The next section provides an overview of stylized facts about remitting behavior of migrant workers. Section III describes empirical methodology and data sources. The results are presented and possible reasons underlying procyclicality of remittances for some countries as well as its implications are discussed in Section IV. Section V concludes the paper.
II. SOME STYLIZED FACTS AND CYCLICALITY OF REMITTANCES
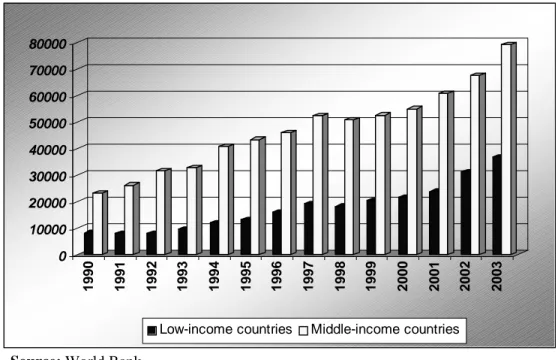
Workers’ remittances received by developing countries have rapidly grown during the past three decades. While the share of low income countries (32 percent) in total remittance receipts of developing countries is less than half the share of middle income countries (68 percent) currently (Figure 1), average annual growth rate of receipts by low income countries (12.3 percent) has been higher than middle income countries (9.9 percent) since 1990,
deviating even further in favor of low income countries more recently (15.9 percent versus 10.8 percent since 1999)—see Ratha (2003) and Spatafora (2005) for a more detailed analysis of recent trends.
4
As such, the results also serve as a caveat against generalizing econometric evidence obtained from panel data for a group of countries regarding the nature of the relationship between GDP and
remittances to all members of the group. Naturally, this warning also applies to studies that investigate cyclical properties of other variables such as capital flows and their co-movements with output (see, for example, Kaminsky, Reinhart and Végh, 2004).
Figure 1. Remittance Receipts by Low- and Middle-Income Developing Countries: 1990-2003 (Millions of Dollars) 0 10000 20000 30000 40000 50000 60000 70000 80000 1990 1991 1992 1993 1994 1995 1996 1997 1998 1999 2000 2001 2002 2003 Low-income countries Middle-income countries
Source: World Bank.
This rapid growth has raised the GDP share of remittances to 1.9 percent for low-income, 1.4 percent for lower-middle-income and 0.8 percent for upper-middle-income (UMI) countries as of 2001, and elevated the importance of remittances as a source of foreign exchange earnings in all recipient countries in the developing world. Increasing ratios of remittances to imports reached 6.2 percent for LI, 5.1 percent for LMI, and 2.7 percent for UMI countries in 2001. With receipts relative to FDI and other private capital inflows, respectively, reaching 213.5 and 666.1 percent for LI, 43.7 and 44.9 percent for LMI, and 21.7 and 20.2 percent for UMI countries in 2001, remittances began to stand out among other sources of external financing as well (Ratha, 2003).
In addition to this increasing trend, remittances are often observed to be a generally less volatile source of funding than private capital flows that tend to move procyclically with the output in recipient countries. As a result, while the inflows of private capital often boost incomes during an upturn, they would reduce them further during a downturn causing any economic crisis in the recipient country to get even deeper. On the contrary, remittances are often argued to have the potential to increase during times of economic hardship in the home countries of migrant workers. In fact, there are findings indicating a negative relationship between remittances and income for different countries and cross-country evidence that remittances would reduce the size of worst drops in GDP experienced during severe economic crises. Sharp increases in remittances as observed after economic crises in countries like Indonesia (1997), Ecuador (1999) and Argentina (2001) also seem to support this view (Spatafora, 2005).
From a microeconomic perspective, it is indeed reasonable to expect that migrant workers increase their support to family members during down cycles of economic activity back home so as to help them compensate for lost family income due to unemployment or other
crisis-induced reasons.5 Still, as the sizable literature on remittances has taught the economic profession, remitting is a multifaceted behavior affected by many other variables than the desire to help out family members with their financing of current consumption spending. Since different variables affecting the remittance behavior (such as interest rate differentials between the home countries and the rest of the world or exchange rates between home and host country currencies) respond to changes in economic activity over the business cycle differently, the possibility of a procyclicality or acyclicality between remittances and output in at least some of the recipient countries would be difficult to rule out based on microeconomic incentives alone. Given the increasingly significant role remittances play for developing economies and sometimes critically different implications of their countercyclicality and procyclicality,6 it is imperative to investigate the cyclical nature of remittances for different countries individually, without relying on evidence reported for groups of countries alone. As the results presented in the next section reveal, evidence based on the group may mask important differences in country-specific dynamics of remittance behavior vis-à-vis business cycles in the home countries of migrant workers.
III. ANALYSIS OF THE CYCLICAL CHARACTERISTICS OF REMITANCES
In this section, business cycle properties of real remittances are analyzed against the behavior of real output in the selected recipient countries individually and as a group using annual data between 1976 and 2003. Twelve (six LI and six LMI) countries for which data were available over the period under consideration were selected. LI countries in the sample are Bangladesh (BGD), India (IND), Côte d’Ivoire (CIV), Lesotho (LSO), Pakistan (PAK) and Senegal (SEN) and LMI countries are Algeria (DZA), Dominican Republic (DOM), Jamaica (JAM), Jordan (JOR), Morocco (MAR) and Turkey (TUR).7
5
Chami, Fullenkamp and Jahjah (2003) study the effects of remittances on growth by assuming that remittances are motivated by the altruism of migrant workers who remit “in order to help the family avoid shortfalls created by a poor economy” and present a detailed survey of the literature trying to explain remittance behavior or predict flows based on micro-founded models of the economics of household.
6
While remittances make a critical contribution to the development of many labor-surplus economies in the developing world by helping relax the hard currency constraints facing these economies and reducing the need for international borrowing in general, the timing of fluctuations in remittance flows is equally critical. Depending upon their cyclical behavior, remittances may serve to reduce or increase income volatility thereby affecting stability (and hence credibility) of the recipient countries in a completely opposite fashion. The nature of their cyclicality is particularly important to know for countries that use or intend to use future potential remittances as collateral for international loans (see Ratha, 2003 for a list).
7
In terms of geographical coverage and regional distribution by the World Bank classification, Africa is represented by Middle East and North Africa (MENA) region countries Algeria, Jordan and Morocco in the north and by SSA region countries Côte d’Ivoire, Lesotho and Senegal located in the south, whereas Asia is represented by Bangladesh, India and Pakistan located in the South Asia (SA) region. Representing South America are Dominican Republic and Jamaica in the LAC region, whereas Europe is represented by Turkey in the Europe and Central Asia (ECA) region.
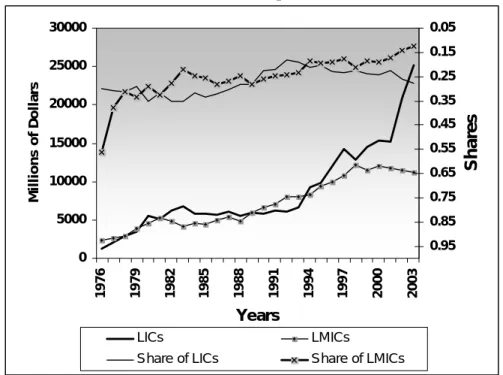
Consistently with the pattern for all developing countries, remittances received by LI countries in the sample have grown faster than the receipts of LMI countries over the 1976-2003 period as a whole, although this growth has been less steady for LI countries than LMI countries. In terms of their share in total remittance receipts of all LI and LMI countries in the world, the group of 12 in our sample started out with a combined share of 86.2 percent in 1976, ending up with a combined share of 39.8 percent (27.5 percent for the six LI countries and 12.3 percent for the remaining six) in 2003 (Figure 2). Despite this decline in their combined shares over time, the sample includes leading recipients of remittances in the world in terms of the magnitude (India, Turkey, Morocco, Pakistan, Bangladesh, Jordan, Dominican Republic) or ratios of receipts to output (Lesotho, Jordan, Jamaica), thereby making up a representative sample of the larger country groups they belong in.
Figure 2. Remittance Receipts by Low- and Middle-Income Developing Countries in the Sample 0 5000 10000 15000 20000 25000 30000 1 976 1 979 1 982 1 985 1 988 1 991 1 994 1 997 2 000 2 003 Years M illio n s o f D o lla rs 0.05 0.15 0.25 0.35 0.45 0.55 0.65 0.75 0.85 0.95 Sha re s LICs LMICs
Share of LICs Share of LMICs
Source: World Bank.
As Figure 2 indicates, total remittances received by both LI and LMI countries in the sample have upward trends, even though fluctuations around the (unobserved) trend seem greater in the case of LI countries than LMI countries. This is a reflection of the greater variation in remittances that individual LI countries in the sample have received over the sample period. Despite such differences, the common characteristic of all 12 countries is that their real remittance receipts and real GDPs (measured in constant US dollars at 2000 prices as reported in World Development Indicators)8 have upward trends.
8
Real GDP was chosen as the relevant output indicator in light of the national income accounting conventions that define GNP as GDP plus net factor income from abroad (NFI). Since NFI includes net remittance receipts, GDP series leave out remittances received by countries in the sample. While the World Bank’s time series data on remittances received by each country were in nominal US dollar terms, these series were converted into real terms by using the U.S. GDP deflator (2000=100).
This evolutionary (time-variant) trend within each series needs to be removed to identify stylized facts of business cycles and analyze cyclical nature of remittance receipts. Detrending each series by removing the estimated trend makes it possible to separate fluctuations
(cyclical components) around the trend of each data series, making examination of the statistical properties of the co-movements of deviations of output and real remittances from their respective trends possible (Lucas, 1977; Kydland and Prescott, 1990). When respective trends are properly filtered out from real remittances and output series for each country, the remaining cyclical components would be stationary with zero mean for each variable. Then, contemporaneous and asynchronous cross correlations between the cyclical components of respective series can be calculated to identify cyclical characteristics of remittances.
Procyclicality (countercyclicality) of remittances in this context refers to the tendency of real remittance receipts by each country to move above its trend, whenever the corresponding real output variable is above (below) its respective trend. In the absence of such a tendency, remittances and output are said to be acyclical.
The detrending approach adopted here is to estimate the (unknown) trend of each GDP and remittances series by fitting a polynomial of degree k of the form
k k T
t
t
t
t
y
=
α
0+
α
1+
α
2 2+
...
+
α
to the GDP series (yt) of each country or the group and k
k T
t
t
t
t
r
=
β
0+
β
1+
β
2 2+
...
+
β
to the remittances series (rt) of each country/group such that all estimated
α
and
β
coefficients would be statistically significant and once the estimated trend is removed, the remaining series (cyclical component) would be stationary (as indicated by the ADF test results) with zero mean.9In order to see the aggregate behavior of remittances over the business cycle, 12 countries in the sample are considered as a single entity first. The aggregate real GDP for the whole group is obtained by weighting yearly outputs of individual countries in the sample with their average shares in total real GDP of all LI and LMI countries. Similarly, the weighted total of real remittances received by the group over the sample period is generated by using as weights the average shares of remittances flowing into each of the twelve countries within total receipts of all LI and LMI countries. Polynomial trends estimated for each of the resulting series are given in Table 1.
9
The idea follows from the Weierstrass Theorem which states that any continuous, real-valued function defined on a bounded interval can be approximated by a polynomial to a sufficiently high degree of accuracy (Miranda and Fackler, 2002). Although they are not as widely used by economists as such popular filters as the ones developed by Hodrick and Prescott (1997) or Baxter and King (1999), polynomial filters are useful detrending devices, producing similar results to Hodrick-Prescott filter (Turhan-Sayan and Sayan, 2002). For basic information about polynomial filters, see Pollock (2005) and for a recent application using polynomial filters, see Lucke (2005).
Table 1. Estimated Trends for the Total Output and Real Remittance Receipts of the Group of 12 (t-statistics in parentheses)
Constant t t 2 t 3 t 4 t 5 R2 [Adj.R2] F-statistic T t
y
(2341.189) 4.916883 0.006593 (9.610) 0.000189(3.172) -4.52E-06(-3.115) -- -- [0.998] 4626.6 0.998 T tr
2.287111 (140.928) 0.125088 (9.681) -0.022463(-7.234) 0.001679(5.644) -5.43E-05(-4.435) 6.33E-07(3.511) [0.929] 72.1 0.942Figure 3 shows the combined trend of real GDP estimated by fitting the third order polynomial in Table 1 to the aggregate real GDP.10
Figure 3. Total Real GDP (Weighted) of the Countries in the Sample and Its Trend
4.91 4.96 5.01 5.06 5.11 1 976 1 978 1 980 1 982 1 984 1 986 1 988 1 990 1 992 1 994 1 996 1 998 2 000 2 002 Years R e al G D P a t 200 0 U S D (i n na tu ra l l ogs )
Real GDP of the Group (Weighted Total) Trend of the Real (Group) GDP
10
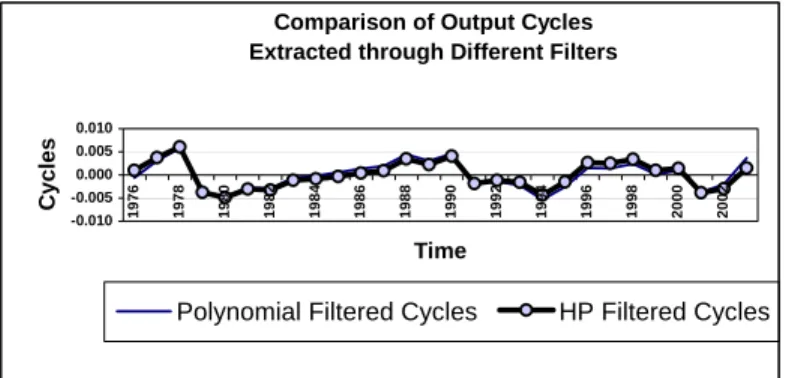
The following figure gives an idea about how the cyclical components obtained through the polynomial filter estimated here and the Hodrick-Prescott filter (with a penalty parameter value of
λ
=100 suggested for annual data) compare.Comparison of Output Cycles Extracted through Different Filters
-0.010 -0.005 0.000 0.005 0.010 1976 1978 1980 1982 1984 1986 1988 1990 1992 1994 1996 1998 2000 2002 Time C ycles
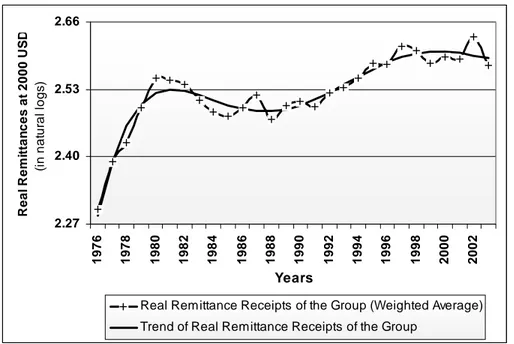
The combined trend of real remittance receipts by the countries in the sample (as given by the fifth order polynomial in Table 1) is in Figure 4. The higher degree of the estimated
polynomial for the trend of total remittances duly reflects the higher volatility of remittances series as compared to output.
Figure 4. Total Real Remittance Receipts (Weighted) by the Group and Its Trend
2.27 2.40 2.53 2.66 197 6 197 8 198 0 198 2 198 4 198 6 198 8 199 0 199 2 199 4 199 6 199 8 200 0 200 2 Years Real Remi tt an ce s a t 200 0 US D (i n n a tu ra l l ogs )
Real Remittance Receipts of the Group (Weighted Average) Trend of Real Remittance Receipts of the Group
Once the estimated trends from the output and real remittances series are removed, two types of correlation coefficients between the remaining cyclical components can be obtained: Contemporaneous cross correlations and asynchronous correlations (calculated after shifting the real remittances series backward or forward by one year). Asynchronous correlation coefficients allow possible phase shifts to be identified by looking at how early or how late the highest correlation appears relative to the contemporaneous period (Pallage and Robe, 2001; Alper, 2002). In other words, the position of largest (in absolute value) significant cross correlation between real remittances and output series enables one to identify the timing and direction that remittance receipts respond to output drops.
IV. RESULTS
Table 2 reports contemporaneous cross correlations, as well as asynchronous correlations between the cyclical components of output and remittances series for the group of 12 as well as for individual countries in the group (for the estimated trend equations for output and remittances series of individual countries, see Appendix). In the table, correlation coefficients with the largest absolute value are shown in bold. Of those largest valued coefficients, the ones that are statistically significant at 95 percent level are marked with an asterisk. The results can be summarized as follows:
1) Remittance receipts by the group of countries in the sample move
countercyclically with the aggregate output for the whole group over the 1976-2003 period considered. More specifically, real remittances lag real GDP with a phase difference of one year, implying that migrant workers would tend to increase
remittances following a cyclical drop in real GDP of their home countries. In the terminology of business cycles, remittances would peak (reach the peak of their own cycle) within one year after a trough in the home country output.
Table 2. Cross Correlations between Real GDP at time t (t = 1976, …, 2003) and Real Remittances (Rrem) at t+i (i = -1, 0, 1)
Rrem(t-1) Rrem(t) Rrem(t+1) Nature of the Co-movement
Whole sample 0.3032 -0.2696 -0.3639* Countercyc.: Remittances lag output
Country Income Group /Region
DZA LMI/MENA -0.1346 -0.2447 -0.0739 Acyclical
BGD LI/SA 0.0536 -0.4145* -0.1329 Countercyclical and synchronous
CIV LI/SSA 0.2482 0.0767 -0.0885 Acyclical
DOM LMI/LAC 0.2497 0.2289 0.1109 Acyclical
IND LI/SA 0.3747 -0.0143 -0.3798* Countercyc.: Remittances lag output
JAM LMI/LAC -0.0630 -0.1812 -0.0846 Acyclical
JOR LMI/MENA 0.3689 0.8704* 0.6472 Procyclical and synchronous
LSO LI/SSA 0.2193 -0.0105 -0.0434 Acyclical
MAR LMI/MENA -0.1217 0.2167 0.3832 * Procyclical: Remittances lag output
PAK LI/SA -0.0574 -0.1539 0.1499 Acyclical
SEN LI/SSA 0.0881 0.0718 0.1076 Acyclical
TUR LMI/ECA -0.0953 -0.0450 -0.0513 Acyclical
Source: Author’s calculations based on the World Bank data.
2) When looked at individually, remittance flows into some of the countries within the group are countercyclical whereas others are procyclical or acyclical. Of the countries where strong countercyclicality is found, Bangladesh’s remittances receipts are synchronous with the business cycle, whereas India’s receipts lag it by a year. Similarly, of the countries with a strong procyclical relationship between remittances and output, receipts by Jordan are synchronous with real GDP in this country, whereas remittances received by Morocco lag the output cycle by a year. Put differently, migrants from Bangladesh and India increase their transfers during times of economic hardship at home (implying a strong consumption smoothing motive), whereas migrants from Jordan and Morocco increase their transfers during good times at home (implying a stronger investment motive/higher risk aversion). In terms of the response
time, Bangladeshi and Jordanese migrants respond to the state of economic activity in their home countries immediately (though in the opposite direction), whereas Indian and Moroccan migrants respond with a time lag (though in the opposite direction again).
3) Again, by country-specific results, remittances sent home by migrant workers from Algeria, Jamaica, Lesotho, Pakistan and Turkey appear to be countercyclical but the degree of cyclicality is not strong enough to state this with confidence based on statistical significance of correlations estimated using annual data. Likewise, the seemingly procyclical relationship between remittances sent by migrants from the remaining countries (Dominican Republic, Ivory Coast and Senegal) and respective outputs fails to pass statistical significance tests requiring that real remittances received by these countries be classified as acyclical.
The finding that remittances received by 12 countries in the sample together are
countercyclical with their aggregate output, and respond to drops in output with a lag of one year certainly supports the expectation that migrant workers would increase remittances following an economic crisis in their home country.
A closer look at individual country results, however, indicates that this behavioral pattern is observed in only one country in the sample: India –which is the top recipient of remittances in the world in terms of the average annual amount of receipts over the period from 1990 to 2003 (Spatafora, 2005). The remittance behavior of Bangladeshi workers abroad is also similar in terms of the nature of response to a home country crisis but differs in its timing. In fact, results indicate that Bangladeshi workers are even quicker in increasing their support to home by adjusting their remittance behavior during the same year when an output drop is experienced in Bangladesh –which ranked eleventh in the world again in terms of the yearly average of 1990-2003 receipts. Despite phase differences, the remitting behavior of workers from these two countries are broadly consistent with studies that view consumption
smoothing as the primary motive behind remittances.
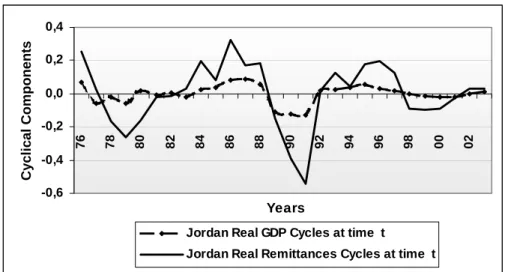
Workers from two other countries in the sample seem to be doing the opposite and increase their remittances during periods of higher economic activity at home, cutting them during downturns and crises. Moroccan workers appear to wait for a while and watch positive (negative) developments before beginning to transfer more (less), whereas Jordanian workers abroad are responding strongly and quickly to cyclical movements in the Jordanian economy in the same direction. A possible explanation for this procyclical behavior of remittances is the higher strength of the investment motive than consumption smoothing motive. In other words, migrant workers may choose to keep more of their savings in the host country, rather than transferring them home, during periods of economic trouble in the home country due to declining returns or reduced confidence in their country’s financial system. Yet another possible explanation for this procyclicality is that output drops may be caused by drops in remittances themselves. This may be an even more plausible explanation for countries that are heavily dependent on remittance receipts such as Jordan. With an average share close to 20 percent over 1990-2003, Jordan has in fact been one of the top five countries with the highest ratio of remittances to GDP, and suffered a severe drop in remittances during the 1990-91 conflict in the Middle East as thousands of Jordanian workers in Kuwait and Saudi Arabia lost their jobs. That procyclicality of Jordanian remittances with the output may be due to income reductions resulting from the fall in remittances is supported by Figure 5 where cyclical
components of the Jordanian real GDP and remittance receipts of this country obtained after detrending each series through a polynomial filter are plotted together.
Figure 5. Output and Remittance Cycles in Jordan
-0,6 -0,4 -0,2 0,0 0,2 0,4 76 78 80 82 84 86 88 90 92 94 96 98 00 02 Years Cycl ical Components
Jordan Real GDP Cycles at time t
Jordan Real Remittances Cycles at time t
It is interesting to note that the output and remittances cycles for the rest of the countries in the sample are uncorrelated. This acyclicality is true even for Lesotho which has by far the highest ratio (almost 70 percent) of remittances to GDP on the basis of 1990-2003 averages. Given such high shares, it would be reasonable to expect a procyclicality between remittances sent by migrant Basotho workers (who overwhelmingly work in South African mines) and real GDP in Lesotho, at least since increases in remittances would be expected to boost real GDP as seems to be the case in Jordan. Yet, the acyclicality observed in the case of Lesotho seems to be resulting from volatility of remittances due to frequent and sharp changes in the number of Basotho workers employed in South Africa, rather than changes in their remitting behavior. As can be observed from Figure 6, remittances cycles display sharp drops in Lesotho due to changing demand for the Basotho miners in South Africa as gold prices fluctuate.
Figure 6. Output and Remittance Cycles in Lesotho
-0,40 -0,30 -0,20 -0,10 0,00 0,10 0,20 0,30 76 78 80 82 84 86 88 90 92 94 96 98 00 02 Years Cyclical Components
Lesotho Real GDP Cycles at t
The downturn in remittance receipts of Lesotho after 1990 and the sharp drop in 1994, for example, were due to the yearly reductions in the number of Basotho workers employed abroad which hit 13 percent in 1994 (Sparreboom and Sparreboom-Burger, 2004). The exogenous dynamics driving remittance receipts of Lesotho once again remind the need that cyclical behavior of remittances be analyzed by also taking output cycles in the host countries into account as pointed out by Sayan (2004) and Sayan and Tekin-Koru (2005) and as also noted in footnote 1 above.
It should be noted finally that the results reported here may be improved when higher frequency (such as quarterly) data is used instead of annual data. In the case of Turkey, for example, the analysis based on annual data here signals an absence of any synchronous or asynchronous correlation between real GDP and remittances. Yet, earlier works (such as Sayan, 2004 and 2005) employing quarterly data on remittances from the Turkish workers in Germany indicate that there is a strong synchronous procyclicality between remittance receipts and output over the Turkish business cycles.11 Sayan (2005) further indicates that the countercyclical relationship between remittances from Turkish workers abroad may have turned into procyclicality over time implying that the passage of time may change cyclical properties of remittances. Supported by results from recent empirical work by Aydas, Metin-Ozcan and Neyapti (2005), this view is seemingly consistent with the inconclusive nature of results from annual data reported here for this country. In order to further test the validity of this view, quarterly data covering the period 1987:1 to 2003:3 from the Turkish Central Bank have been used to analyze the co-movements between the cycles of output in Turkey and real remittances from the Turkish workers in Germany.
The results presented in Table 3 indicate that even though remittances from Germany are procyclical with the Turkish output over the whole period, they were countercyclical to the business cycle in the sub-period from 1987:1 to 1994:2. Furthermore, these procyclical remittances were following the output cycle by a lag of one quarter during the 1987:1-2003:1 period, as indicated by the position of 0.3683, the largest correlation coefficient (with the contemporaneous correlation coefficient of 0.3566 being a close second and indicating that the synchronous co-movement of remittances with the output cycle in Turkey was also strong). When the sub-period from 1987:1 to 1994:2 is considered instead, however, the results indicate a countercyclicality with real remittances from Germany following the
Turkish output with a lag of one or two quarters in the opposite direction. This implies that up to the second quarter of 1994 when the first major economic/financial crisis in the aftermath of the 1980s hit Turkey, Turkish workers in Germany tended to increase remittances shortly after output drops in the Turkish economy, but this pattern changed after the crisis of 1994.
11
Germany is by far the most important destination for migrant workers from Turkey playing host to about 60 percent of all Turkish workers abroad. Procyclicality of remittances from Turkish workers in Germany with the business cycles in Turkey found by Sayan seems to be a robust result independent of whether the detrending technique used in extracting the cycles is Hodrick-Prescott as in the 2004 study or polynomial filtering as in the 2005 study.
Table 3. Cross Correlations Between Real GDP at time t in Turkey and Real Remittances from the Turkish Workers in Germany at t+i (i = -4, -3, -2, -1, 0, 1, 2, 3, 4)
i -4 -3 -2 -1 0 1 2 3 4
1987:1-2003:3 -0.0516 0.0161 0.1940 0.2838 0.3566* 0.3683* 0.2766 0.1494 0.0830 1987:1-1994:2 0.1761 0.2345 0.2700 0.2055 -0.2990 -0.4128* -0.4168* -0.3599 -0.2439
As argued by Sayan (2005), this switch may be due to a host of factors possibly including the reunification of workers with immediate family members in the host country and weakening ties with other relatives back home over time, changing decisions of migrants about the length of stay in the host country and timing of return, as well as changing investment atmosphere in the home country. Given that the switch from countercyclicality to procyclicality occurred after the severe financial crisis in 1994 in Turkey, it appears plausible to argue that major economic/financial crises may negatively affect the level of migrants’ confidence in the banking system and financial institutions of the home country and hence their decisions about when to transfer their savings home and when to keep them in the host country. This view is further supported by very sharp drops observed in remittance receipts of Turkey more recently after 2000 when the country was successively hit by two major economic/financial crises.
V. CONCLUDING REMARKS
The discussion has shown that remittance receipts of different countries are driven by complex dynamics and respond differently to the state of economic activity in the home countries of migrant workers. Even though a countercyclical remittance behavior is reasonable to expect in some countries and seemingly easy to explain based on sensible arguments around the consumption smoothing motive of migrant workers, such
countercyclicality is hard to generalize to all countries. The behavior of remittances appears to be procyclical or even acyclical in some countries and the possible reasons underlying such procyclicality/acyclicality often differ across countries. Cross-country studies that produce empirical estimates referring to the average behavior may sometimes be misleading as they conceal possibly significant differences in the behavior of remittances received by individual countries. The potentially misleading nature of cross country results have been clearly shown by a comparison of results obtained for the group of 12 countries as a whole and the results for individual countries making up the sample.
Since procyclicality or countercyclicality of remittances have opposite implications for the capacity of recipient countries to cope with economic crises, individual country characteristics should not be overlooked in designing policies related to remittance flows, and a realistic degree of caution should be applied, particularly in such cases involving the use of potential remittance receipts as collateral while raising external funding.
Table A1. Estimated Trend Equations for Real GDP (Dependent Variable: ln RGDPt) Constant t t 2 t 3 t 4 t 5 R2 [Adj.R2] F-statistic Whole Sample 2.287111 (140.928) 0.125088 (9.681) -0.022463 (-7.234) 0.001679 (5.644) -5.43E-05 (-4.435) 6.33E-07 (3.511) 0.942 [0.929] 72.1 ALG 24.021030 (1591.730) 0.086433 (17.532) -0.005319 (-12.404) 0.000120 (11.494) -- -- 0.988 [0.986] 652.2 BAN 23.615230 (3635.849) 0.029474 (26.462) 0.000427 (10.718) -- -- -- 0.999 [0.999] 10236.6 CIV 22.718510 (722.268) 0.059967 (3.575) -0.010953 (-4.222) 0.000693 (4.761) -1.31E-05 (-4.898) -- 0.908 [0.892] 56.9 DOM 22.760510 (987.196) 0.019656 (4.972) 0.000715 (5.052) -- -- -- 0.983 [0.982] 741.7 IND 25.601970 (1938.296) 0.043393 (19.158) 0.000355 (4.383) -- -- -- 0.997 [0.997] 4119.1 JAM 22.575130 (988.407) -0.034852 (-4.671) 0.004363 (6.723) -0.000103 (-6.512) -- -- 0.941 [0.933] 126.7 JOR 21.578410 (462.769) 0.209776 (8.438) -0.020484 (-5.326) 0.000918 (4.250) -1.39E-05 (-3.512) -- 0.975 [0.971] 226.4 LES 19.357970 (709.134) 0.213501 (9.823) -0.038442 (-7.360) 0.003481 (6.955) -0.000134 (-6.519) 1.84E-06 (6.060) 0.994 [0.993] 747.8 MOR 23.464160 (1288.024) 0.040232 (12.879) -0.000289 (-2.583) -- -- -- 0.985 [0.984] 812.9 PAK 23.763980 (2741.420) 0.055320 (11.969) 0.002591 (3.624) -0.000196 (-4.888) 3.43E-06 (4.659) -- 0.999 [0.999] 9512.5 SEN 21.602850 (898.806) -0.066172 (-3.458) 0.021556 (4.687) -0.002014 (-4.572) 7.97E-05 (4.400) -1.11E-06 (-4.156) 0.988 [0.986] 373.7 TUR 25.123000 (1013.390) 0.016453 (2.390) 0.001719 (3.950) -- -1.52E-06 (-4.588) -- 0.987 [0.985] 593.4
Table A2. Estimated Trend Equations for Real Remittances
(Dependent Variable: ln RREMt)
Constant t t 2 t 3 T 4 t 5 t 6 t 7 R2 [Adj.R2] F-statistic Whole Sample 4.9169 (2341.2) 0.0066 (9.6) 0.0002 (3.2) -4.5E-06 (-3.1) -- -- -- -- 0.998 [0.998] 4626.6 ALG 6.3477 (29.2) 0.5366 (3.1) -0.1707 (-4.1) 0.0180 (4.5) -0.0008 (-4.6) 1.1E-05 (4.6) -- -- 0.653 [0.574] 8.3 BAN 4.0020 (38.2) 1.0578 (12.7) -0.1557 (-7.8) 0.0108 (5.6) -0.0003 (-4.4) 4.3E-06 (3.7) -- -- 0.983 [0.980] 261.8 CIV 3.6170 (14. 9) -- 0.0019 (2.7) -- -- -- -- -- 0.215 [0.184] 7.1 DOM 5.7478 (107.7) -- -0.0046 (-2.8) 0.0005 (4.9) -- -3.4E-07 (-4.8) -- -- 0.976 [0.973] 325.7 IND 7.3255 (60.8) 0.4426 (6.9) -0.0678 (-6.8) 0.0038 (6.8) -6.7E-05 (-6.5) -- -- -- 0.946 [0.937] 101.1 JAM 5.4697 (40.4) -0.1779 (-4.0) 0.0178 (4.6) -0.0003 (-3.5) -- -- -- -- 0.938 [0.930] 120.6 JOR 6.6789 (41.5) 0.3317 (4.4) -0.0351 (-4.4) -- -- 1.2E-05 (3.2) -6.5E-07 (-2.8) 9.9E-09 (2.4) 0.704 [0.636] 10.5 LES 5.8114 (55.1) 0.1553 (2.7) -0.0188 (-2.5) -- 0.0001 (2.5) -4.7E-06 (-2.5) 1.8E-09 (2.5) 0.868 [0.838] 29.0 MOR 7.2920 (122.4) -- 0.0026 (3.3) -- 5.8E-07 (-2.4) -- 1.9E-08 (2.4) -- 0.674 [0.634] 16. 6 PAK 6.9567 (49.7) 0.6922 (6.2) -0.1258 (-4.7) 0.0101 (3.9) -0.0004 (-3.7) 5.9E-06 (3.8) -- -- 0.896 [0.872] 37.7 SEN 4.6745 (72.0) -- -- 0.0005 (3.2) -2. 9E-05 (-2.9) -- 1.8E-08 (2.9) -- 0.776 [0.748] 27.7 TUR 7.6011 (46.2) 0.3061 (3.5) -0.0588 (-4.3) 0.0039 (5.1) -8.1E-05 (-5.8) -- -- -- 0.756 [0.714} 17.9

![Table A1. Estimated Trend Equations for Real GDP (Dependent Variable: ln RGDP t ) Constant t t 2 t 3 t 4 t 5 R 2 [Adj.R 2 ] F-statistic Whole Sample 2.287111 (140.928) 0.125088 (9.681) -0.022463 (-7.234) 0.001679 (5.644) -5.43E-05 (-4.435)](https://thumb-eu.123doks.com/thumbv2/9libnet/5619834.111286/18.918.146.803.186.738/table-estimated-equations-dependent-variable-constant-statistic-sample.webp)

