ABSTRACT: We present a comprehensive and integrated model-independent ab initio study of the structural, cohesive, electronic, and optical properties of silicon quantum dots of various morphologies and sizes in the framework of all-electron “static” and time-dependent density functional theory (DFT, TDFT), using the well-tested B3LYP and other properly chosen functional(s). Our raw ab initio results for all these properties for hydrogen-passivated nanocrystals of various growth models and sizes from 1 to 32 Å are subsequently fitted, using power-law dependence with judicially selected exponents, based on dimensional and other plausibility arguments. As a result, we can not only reproduce with excellent accuracy known experimental and well-tested
theoretical results in the regions of overlap but also extrapolate successfully all the way to infinity, reproducing the band gap of crystalline silicon with almost chemical accuracy as well as the cohesive energy of the infinite crystal with very good accuracy. Thus, our results could be safely used, among others, as interpolation and extrapolation formulas not only for cohesive energy and band gap but also for interrelated properties, such as dielectric constant and index of refraction of silicon nanocrystals of various sizes all the way up to infinity.
1. INTRODUCTION
Silicon nanocrystals, or quantum dots (due to their zero dimensionality, compared to infinite Si crystals, 3D, films, 2D, or wires, 1D), have attracted a lot of interest over the last years due to their potential band gap engineering properties. The main reason is that, contrary to the electronic properties, the optical properties of crystalline silicon are rather poor because of the small (smaller than the lower edge of the visible spectrum) and indirect band gap, resulting in phonon-assisted emission. Thus, the optical properties of silicon quantum dots (QDs), which are inherently connected with the electronic properties as well as with the bonding and cohesive properties, have been a very challenging and promising field of research over the past decade for obvious technological and scientific reasons.1−26 The culmination of the silicon quantum dots research occurred with the observation of visible photo-luminescence (PL) in porous silicon and silicon nanocrystals.1 Hence, most of the work in this field has been devoted to understand and tune the visible photoluminescence of the QDs by adjusting and correlating the optical gap with the size (diameter) of the dots,2−4 not always without inconsistencies and ambiguities,4which are related with the difficulty to exactly determine the QD size and the exact morphology and
composition of its surface layer.4However, with the advance-ment of technology in recent years, these problems are not so serious. It is widely accepted by now that the visible luminescence of small and pure (oxygen-free) QD samples with well-defined diameters is mainly due to quantum confinement of the corresponding quantum dots.4−6 Yet, since the dot’s properties are sensitive to the preparation conditions and the growth environment, several other alternative mechanisms have been also considered in the past for the detailed description of the variation of the gap with size (number of particles or diameter) and surface conditions of the dots, such as free-exciton collision7 and impurity luminescent center mechanism.8
The unique size and composition and tunable electronic and optical properties of Si quantum dots make them very appealing for a variety of applications and new technologies. Examples include LEDs,9 solid-state lighting displays,10 and photovoltaics.11Being zero dimensional, quantum dots have a sharper density of states than higher dimensional structures.
Received: March 22, 2016
Revised: May 3, 2016
Published: May 5, 2016
Downloaded via BILKENT UNIV on November 25, 2018 at 08:14:02 (UTC).
Their small size also means that electrons do not have to travel as far as with larger particles, thus electronic devices can operate faster. Examples of possible applications taking advantage of these unique electronic properties include transistors12 and logic gates13 and quantum computing,14among many others. The small size of quantum dots allows them to go anywhere in the body, making them suitable for different biomedical applications15like medical imaging16and biosensors,17etc. At present,fluorescence-based biosensors depend on organic dyes with a broad spectral width, which limits their effectiveness to a small number of colors and shorter lifetimes to tag the agents. On the other hand, quantum dots can emit the whole spectrum, are brighter, and have little degradation over time, thus being superior to traditional organic dyes used in biomedical applications.
In this study three distinct growth models (morphologies) of silicon quantum dots are studied such as elongated, spherical (grown along [111] direction), and reconstructed dots. Spherical QDs with diameters d smaller than 2 nm (d < 2 nm) have been studied by our group earlier5with considerable success. These calculations have served, among others, as“yard sticks”, especially in the gap-size dependence, in several experimental and theoretical works. In this work we have considered alternative QD morphologies and have expanded their size up to 3.2 nm. In several cases we have also considered alternative modern functionals for comparison, although we have already tested B3LYP with high level ab initio results in the past.5 As was expected, in the framework of the present investigation, we found that there is no need to resort to other types of functional(s). Concerning new morphologies, we have considered, in addition to spherical, elongated and recon-structed QDs. We have already introduced spherical silicon quantum dots (d < 2 nm),5 whereas in this work, we include large dots (up to 3.2 nm in diameter). For reconstructed dots, Hongdo et al.18reported that step and dimmer reconstruction decrease the gap values and modulate the charge distribution, inducing spatial separation of near-gap levels. The predicted induction in spatial separation of HOMO−LUMO can be used for designing efficient solar cells. In this work, special effort has been placed in examining the quantum confinement concept on large quantum dots in which the gaps have been obtained with very high accuracy. Our results verify the quantum confinement dependence and agree with experimental measurements (wherever possible) in and outside the size range of our calculations, making it possible to successfully extrapolate nanoscale results in the intermediate region all the way to infinite silicon crystal. On the basis of existing (empirical) relationships between gap and dielectric constant or index of refraction,27,28if one wishes to rely on such methods, one can also obtain estimates of such quantities for a given QD size and morphology.
2. TECHNICAL DETAILS
All DFT, TDDFT, and frequency calculations were performed with the TURBOMOLE29suite of programs for medium size of dots (d < 20 Å). For larger dots of diameter d > 20 Å, calculations were performed in the GAUSSIAN 0330package because of the number of basis function limitations in TURBOMOLE. All ab initio calculations are based on the DFT/B3LYP method, employing the hybrid nonlocal ex-change-correlation B3LYP31 functional. This functional has been shown to efficiently reproduce the band structure of a
wide variety of materials, including c-Si, with no need for further numerical adjustments.
The SVP32basis set was used for geometry optimization of the larger dots (for computational economy), after which single-point calculations of the energy were performed with the TZVP33basis (and in some cases def2-TZVPP34). In addition to this we have also tested (in selected cases) for possible basis set superposition error by using the counterpoise method. Convergence criteria for the SCF energies and for the electron density (rms of the density matrix) were placed at 10−7 au, whereas for the Cartesian gradients the convergence criterion was set at 10−4au.
Besides the standard spherical nanocrystals, widely used in the literature5(which consist of a central atom and the various spherical layers of its near neighbors, all in Tdgeometry), we have also considered surface-reconstructed structures, obtained from their spherical counterparts. In addition to spherical and reconstructed models, we have considered elongated (not spherical) nanocrystals, grown along the [111] crystal direction. In this last category, which is also of Tdsymmetry, there is no “central atom” located at the origin of the axis (with coordinates 0, 0, 0). Our results clearly include (and compare) all these three categories, or morphologies.
3. RESULTS AND DISCUSSION
As we mentioned above, we present a very detailed discussion on our results concerning various growth models. Thus, we discuss the structural, electronic, cohesive, and optical proper-ties, respectively, using DFT/TDDFT calculations in order to investigate the stability and their size dependence of the silicon quantum dots.
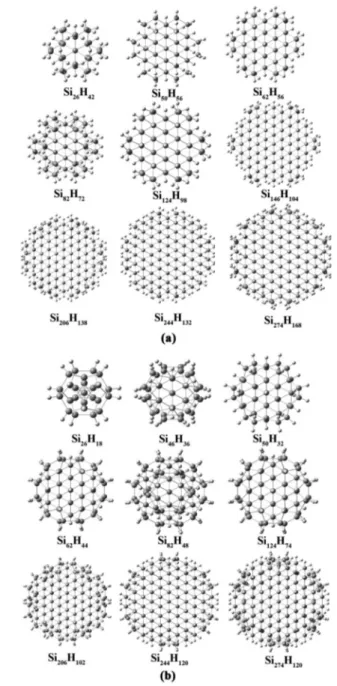
3.1. Structural Properties. We construct spherical quantum dots with Td symmetry by keeping one atom at origin and grow them spherically in the [111] direction. The size of the spherical quantum dots, considered here, ranges from 17 to 717 Si atoms with 36 to 300 H atoms (a total of 1017 atoms in the largest dot). The diameter of the small (Si17H36) and large (Si717H300) cluster is 9.62 and 30.95 Å, respectively. The optimized structures of spherical quantum dots are shown inFigure 1.
However, elongated quantum dots are grown along [111] by keeping two atoms in origin (instead of one). Elongated quantum dots range from 26 to 274 Si atoms including 42 to 168 H atoms (a total of 442 atoms). The diameter of the small (Si26H42) and large (Si274H168) dot is 10.05 and 20.98 Å, respectively. Furthermore, reconstructed quantum dots are also grown along [111] (with the same technique we used for elongated dots) along with further surface reconstruction.18 These dots range from 26 to 274 Si atoms, with 18 to 120 H atoms (a total of 394 atoms in the largest dot). The diameter of the small (Si26H18) and large (Si274H120) dot is 10.66 and 20.06 Å, respectively. All reconstructed dots are of D3dsymmetry. For every distinct model, geometries have been fully optimized within symmetry constraints, using the hybrid B3LYP func-tional. The optimized structures of the elongated and reconstructed quantum dots are shown inFigure 2.
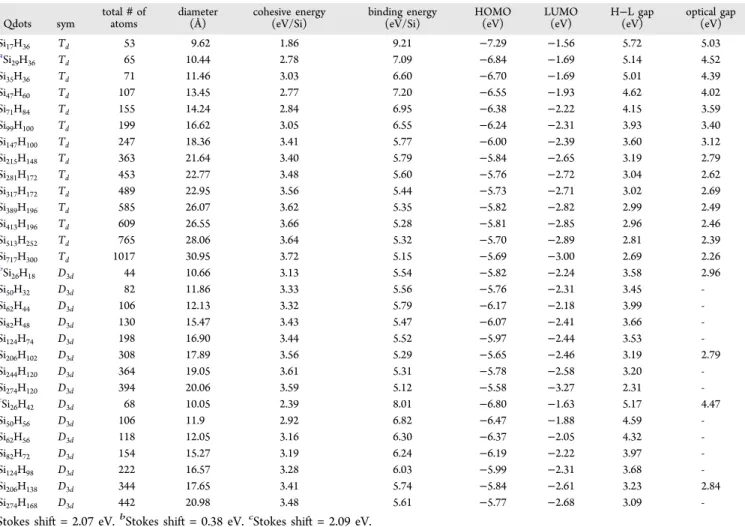
3.2. Electronic Properties. We investigate electronic properties for all stable spherical, elongated, and reconstructed silicon quantum dots. Table 1 presents a summary of all properties discussed in this study.Figure 3shows a diameter-dependent HOMO−LUMO gap of spherical quantum dots. The black dots represent our previous work; the red curve shows a QC fit (eq 1); whereas blue triangles represent our
current work on large dots up to 32 Å (3.2 nm) in diameter. Concerning this plot, it is worthwhile to understand that large dots (blue triangles) are not included during quantum confinement fit (fit is only applied to the small dots).
Surprisingly, large dots follow thefit very well, which is clear evidence of an accurate formula. Based on our previous work5 using the quantum confinement concept, the “extrapolation formula” of our ab initio results can be described by the expected dependence of the HOMO−LUMO (also optical) gap on size (number of atoms or“diameter”) as
= + * −
E N( ) A B N n (1)
or
= + * −
E D( ) C F D m
where A, B, n, C, F, and m, respectively, are used as adjustable parameters to be determined by thefit. The D is the diameter, and/or N is total number of silicon atoms of the quantum dot. Initially m (and n) were free fitting parameters to be determined. The value obtained by the fit for m was m = 0.89 ± 0.15, whereas the values quoted in the literature vary
between 0.76 and 1.3. The value obtained for the parameter C by the samefit, which did not include the large dots, was C = 1.02 ± 0.25 eV. As was explained in ref 5, this value of C corresponds to the energy gap (band gap) of the infinite crystal since as D→ ∞, E becomes equal to D(∞), which, surprisingly enough, is in very good agreement with experiment. However, after inclusion of some (not all) of the larger dots in thefit, the quality of the fit (χ2) was improved, and the value of the exponent m was shifted toward 1 (0.98± 0.10), which is highly suggestive that this exponent might have some kind of “universal” value equal to unity. One could rationalize this by considering the analogy between the HOMO−LUMO gap (which is a measure of chemical hardness or kinetic stability as shown in the article of Zdetsis35 and stability (cohesive stability) which is quantified by the cohesive energy, i.e., the
Figure 1.Optimized geometries of Si17H36, Si29H36, Si35H36, Si47H60,
Si71H84, Si99H100, Si147H100, Si215H148, Si281H172, Si317H172, Si389H196,
Si413H196, Si513H252, and Si717H300spherical quantum dots.
Figure 2.Optimized geometries of Si26H42, Si50H56, Si62H56, Si82H72,
Si124H98, Si146H104, Si206H138, Si244H132, and Si274H168 elongated
quantum dots (a) and Si26H18, Si46H36, Si50H32, Si62H44, Si82H48,
Si124H74, Si206H102, Si244H120, and Si274H120 reconstructed quantum
larger the gap, the larger the stability). In a recent paper by Zdetsis et al.37 it was illustrated that cohesive energy of a nanocrystal varies inversely proportional to its diameter. Therefore, it is reasonable to assume that the HOMO−
LUMO (energy) gap would also vary inversely proportional with the diameter of the nanocrystal. Hence, in subsequentfits we havefixed the value of the exponent m = 1. With the same reasoning the value of the exponent n wasfixed to the value n = 1/3 (since the total number of silicon atoms, N, is proportional to the third power of the diameter D). As will be explained further below, the N-dependence of the gap can be described more accurately, compared to the D-variation, due to the uncertainties in defining the equivalent “diameter of the nanocrystal”. Thus, the new D-dependence of the HOMO− LUMO gap for spherical dots inFigure 3has the form
= ± + ± × −
E D( )HL,spherical (1.33 0.1) (41.8 1.6) D 1
(2) For this newfit which is included in the fitting process, the larger (but not the largest) dots are shown inFigure 4together with an analogousfit for the elongated dots grown along the [111] direction. As would be expected for large diameters, the twofits practically coincide, and the trends as well as the fitted parameters are the same within the (statistical) error margins, as we can see in relation 3. Small differences exist for small diameters due to small differences in the geometric arrange-ment and the “neighborhood” around each silicon atom. Obviously, for very large dots these differences become marginal (and eventually zero).
Table 1. Structural (Total Number of Atoms, Symmetry, Diameter), Energetic (Cohesive Energy per Silicon Atom, Binding Energy per Silicon Atom), Electronic (HOMO, LUMO, H−L Gaps from DFT Calculations), and Optical (Optical Gap for TDDFT Calculations) Characteristics of Spherical, Reconstructed, and Elongated Silicon Quantum Dots, Respectively
Qdots sym total# of atoms diameter (Å) cohesive energy (eV/Si) binding energy (eV/Si) HOMO (eV) LUMO
(eV) H−L gap(eV)
optical gap (eV) Si17H36 Td 53 9.62 1.86 9.21 −7.29 −1.56 5.72 5.03 aSi 29H36 Td 65 10.44 2.78 7.09 −6.84 −1.69 5.14 4.52 Si35H36 Td 71 11.46 3.03 6.60 −6.70 −1.69 5.01 4.39 Si47H60 Td 107 13.45 2.77 7.20 −6.55 −1.93 4.62 4.02 Si71H84 Td 155 14.24 2.84 6.95 −6.38 −2.22 4.15 3.59 Si99H100 Td 199 16.62 3.05 6.55 −6.24 −2.31 3.93 3.40 Si147H100 Td 247 18.36 3.41 5.77 −6.00 −2.39 3.60 3.12 Si215H148 Td 363 21.64 3.40 5.79 −5.84 −2.65 3.19 2.79 Si281H172 Td 453 22.77 3.48 5.60 −5.76 −2.72 3.04 2.62 Si317H172 Td 489 22.95 3.56 5.44 −5.73 −2.71 3.02 2.69 Si389H196 Td 585 26.07 3.62 5.35 −5.82 −2.82 2.99 2.49 Si413H196 Td 609 26.55 3.66 5.28 −5.81 −2.85 2.96 2.46 Si513H252 Td 765 28.06 3.64 5.32 −5.70 −2.89 2.81 2.39 Si717H300 Td 1017 30.95 3.72 5.15 −5.69 −3.00 2.69 2.26 bSi 26H18 D3d 44 10.66 3.13 5.54 −5.82 −2.24 3.58 2.96 Si50H32 D3d 82 11.86 3.33 5.56 −5.76 −2.31 3.45 -Si62H44 D3d 106 12.13 3.32 5.79 −6.17 −2.18 3.99 -Si82H48 D3d 130 15.47 3.43 5.47 −6.07 −2.41 3.66 -Si124H74 D3d 198 16.90 3.44 5.52 −5.97 −2.44 3.53 -Si206H102 D3d 308 17.89 3.56 5.29 −5.65 −2.46 3.19 2.79 Si244H120 D3d 364 19.05 3.61 5.31 −5.78 −2.58 3.20 -Si274H120 D3d 394 20.06 3.59 5.12 −5.58 −3.27 2.31 -cSi 26H42 D3d 68 10.05 2.39 8.01 −6.80 −1.63 5.17 4.47 Si50H56 D3d 106 11.9 2.92 6.82 −6.47 −1.88 4.59 -Si62H56 D3d 118 12.05 3.16 6.30 −6.37 −2.05 4.32 -Si82H72 D3d 154 15.27 3.19 6.24 −6.19 −2.22 3.97 -Si124H98 D3d 222 16.57 3.28 6.03 −5.99 −2.31 3.68 -Si206H138 D3d 344 17.65 3.41 5.74 −5.84 −2.61 3.23 2.84 Si274H168 D3d 442 20.98 3.48 5.61 −5.77 −2.68 3.09
-aStokes shift = 2.07 eV.bStokes shift = 0.38 eV.cStokes shift = 2.09 eV.
Figure 3.Plot shows HOMO−LUMO gap dependence on diameter
of spherical quantum dots. The black dots represent our previous
work,5 whereas blue triangles are from our current work (last five
dots), in order to verify QCfit accuracy.
= ± + ± × = ± + ± × − − E D D E D D ( ) (1.32 0.1) (41.8 1.2) ( ) (1.27 0.1) (40.2 1.0) HL,spherical 1 HL,elongated 1 (3)
InFigure 4, together with the spherical and“elongated” dots, we also display for comparison the HOMO−LUMO gaps of reconstructed dots as random points. As we can see ineq 3the HL gap (parameter C) difference between spherical and “elongated” quantum dots is around 0.05 eV (gap difference of both infinite crystals). One can expect larger differences at small quantum dots which is obvious. For example, the HOMO− LUMO gap difference between spherical and “elongated” dots at identical size of 8 nm is 0.09 eV (where Cspherical= 1.84 eV and Celongated= 1.75 eV, respectively) which decreases with the increase in dot size andfinally becomes zero (or nearly zero) at infinity. It is also worth mentioning that the HOMO−LUMO gap value of infinite crystal 1.32 eV (or 1.27 eV for elongated) is larger than the experiment band gap value which is probably due to the negligence of many-body effects in most of the DFT (electronic hence HL gap) calculations. For this reason we also carried out TDDFT calculations as well so that we can accurately compare experimental energy gap values with optical gap (section 3.3).
We have already explained above that the N-dependence of the gap can be described more accurately, compared to the D-variation; therefore Figure 5 shows N-dependent energy gap (HOMO−LUMO gap) fit for spherical dots together with the elongated dots grown along the [111] direction and reconstructed dots. It is clear from the comparison between
eqs 3 and 4 that the energy gap values of infinite crystal (parameter A), for both spherical and elongated dots, are expectedly the same (within the statistical error margin).
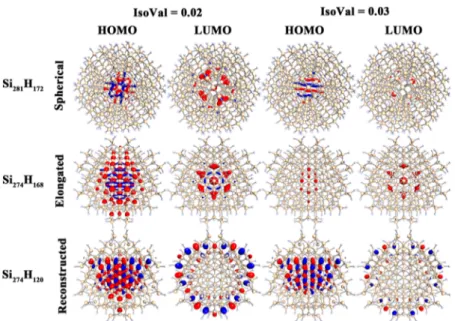
= ± + ± × = ± + ± × − − E N N E N N ( ) (1.38 0.1) (11.4 0.2) ( ) (1.41 0.1) (11.2 0.3) HL,spherical 1/3 HL,elongated 1/3 (4) Figure 6 shows the distribution of the highest occupied molecular orbitals (HOMOs) and lowest unoccupied molecular orbitals (LUMOs) for all three candidate quantum dots. As we can see in the figure, the HOMOs and LUMOs are mainly localized in the interior of the dots for spherical and elongated
quantum dots (without reconstructions), whereas after reconstruction, the HOMOs are localized inside and LUMOs distributed on the surface near the reconstruction sites of the quantum dots. This feature is also present in the work of ref18
with which we agree. However, one must be careful when making such comparisons because the isovalue used for the drawing is very important. We can see in Figure 6 the representation drawn at <0.02 is different from expectations (as we observed in smaller dots <15 Å). Hence, special care must be taken in making such graphical representations.
Clearly, for small−medium size dots the spherical dots have larger gaps compared to reconstructed dots and, therefore, on the basis of“kinetic stability” (or chemical hardness) would be expected to be more stable with the highest HOMO−LUMO gap for a given diameter compared to elongated dots. For larger dots as n→ ∞ the results for spherical and elongated dots, as would be expected, are practically identical. Concerning spherical dots, for which we have considered a much larger number of sizes (larger number of points in the graph), the results obtained here agree with our previous calculations4,5and with experimental results. For spherical and elongated dots, quantum confinement fit produces excellent results with good match to the experimental values for the HOMO−LUMO gap. Due to the good quality of thefit one can predict a HOMO− LUMO gap for the infinite system; obviously, reconstructed dots are not expected to, and they do not follow such afitting scheme because of their random size dependence behavior for large sizes.
3.3. Optical Properties. We perform TDDFT/B3LYP/ SVP level calculations for optical properties taking into account for spherical dots and some selected candidate dots of elongated and reconstructed growth models. We present optical properties in the form of diagrams of N-dependence and D-dependence of the optical gap (where D and N correspond to the diameter and number of heavy atoms of dots, respectively). InFigure 7, during thefitting process we consider our small spherical dots (black spheres),5 and then we place larger dots (blue triangles) which nicely follow thefitting curve. The infinite crystal optical gap compared with experiment results is in very good agreement (larger dots are not included yet), hence results offitting function can be observed
Figure 4. Representation of the HOMO−LUMO gap energy
dependence on the diameter of the dots for spherical and elongated quantum dots.
Figure 5. Plot corresponding to the HOMO−LUMO gap energy
dependence on the number of Si atoms for spherical and elongated, whereas reconstructed quantum dots are shown as random points.
= ± + ± × −
E D( )OPT,spherical (1.14 0.1) (37.3 0.4) D 1
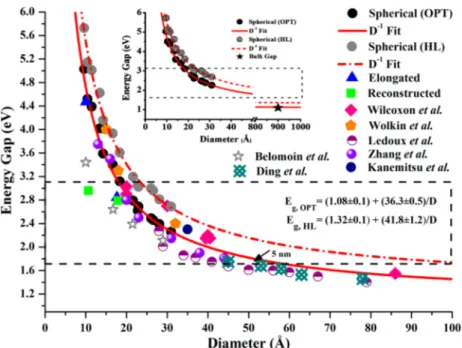
(5) The results in Figure 8 include in the fitting process large spherical dots (in addition to the small ones which are shown in
Figure 7), which were not included in the fitting process of
Figure 7. In the same we include some experimental results from different research groups for comparison (Figure 8). First of all, as we can see in the figure, the dispersion of the experimental data for dots of similar or equal sizes is impressive indeed. Besides uncertainties in the determination of diameters, such scattering of the experimental data is related also to different ways of preparation (for example, gas phase, solution, etc.) and various surface conditions (ligands, etc.). Our data and their expansion, through their fitting scheme, completely free from any influence or bias from experimental data, constitute true reference points and testing grounds, serving also as clear and accurate guiding lines and virtual“yard sticks” from all sizes. This is because the fit and the resulting
interpolation−extrapolation formula are of excellent quality, as can be seen also from the numerical values (and interpretation) of thefitted parameters and their statistical error bars
= ± + ± × −
E D( )OPT,spherical (1.08 0.1) (36.3 0.5) D1 (6) As can be seen, we have obtained the experimental value of the gap with almost “chemical accuracy”. Clearly, the optical (energy) gap value, which is 1.08 eV, is improved compared to the previous fitting results (Figure 7) and in a perfect agreement with the experiment value (i.e 1.1 eV). As we can see in the figure, the randomly chosen small elongated dot shows slightly smaller optical gap for that particular size, compared to the corresponding spherical dot. For larger sizes, as D→ ∞, the results will coincide.
In addition to the D-dependence of the optical gap,Figure 9
shows the variation of the optical gap in terms of the number of silicon atoms of spherical quantum dots. The quality of thefit, as shown above (for the D-dependence), is excellent and even more improved since there is not additional uncertainty about the exact determination of the diameter D. The new parameters are given by the following equation
= ± + ± × −
E N( )OPT,spherical (1.09 0.1) (10.4 0.1) N 1/3
(7) The agreement with experiment is excellent.
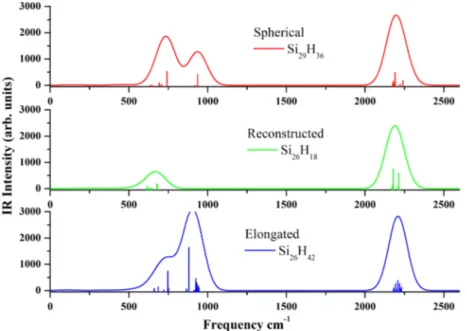
We also present IR spectra in Figure 10 of one candidate structure of each growth model. First peaks correspond to the Si−H bonding frequencies, and second large peaks shows Si−Si bond frequencies.
3.4. Cohesive Properties. In this section we discuss cohesive/binding/atomization properties of our spherical, elongated, and reconstructed quantum dots. We investigate cohesive properties by calculating binding/atomization energy and cohesive energy per silicon atom as a function of number of silicon atoms (or N-dependence of binding and cohesive energy usingeq 1) for all three growth models (seeFigures 11and12). Binding energy of a quantum dot is defined as
= N E +N E H −E
BEQD Si (Si) H ( ) QD[Si H ]N N
Si H (8)
Figure 6. Highest occupied molecular orbital (HOMO)−lowest unoccupied molecular orbital (LUMO) graphical representation of Si281H172
(spherical), Si274H168(elongated), and Si274H120(reconstructed) quantum dots at isovalue 0.02 and 0.03, respectively.
Figure 7. Plot showing optical gap versus diameter of spherical
quantum dots. The black dots represent our previous work,5whereas
blue triangles are from our current work (lastfive dots).
where NSi and NH represent total number of silicon and hydrogen atoms, respectively, within the silicon quantum dot; E(Si) and E(H) are energies of single silicon and hydrogen atom, respectively; and EQD[SiNSiHNH] represents total energy of
the quantum dot.Figure 11shows binding energy per silicon atom as a function of the size of spherical, elongated, and reconstructed quantum dots. In this diagram, the reconstructed dots are artificially appearing as less stable compared to spherical and elongated dots because the contribution of surface hydrogens is not taken fully and correctly into account. When this is properly done (with the definition of cohesive energy), as will be shown below, the reconstructed dots would be clearly more stable as would be expected. In agreement with the relative size of the HOMO−LUMO gap, we can verify in
Figure 11that the spherical dots (for small and medium sizes) are more stable compared to the elongated dots. Furthermore,
as was explained earlier in the discussion for the size variation of the energy gap, the binding energy should follow a N−1/3size dependence.36,37As was demonstrated by Zdetsis et al.,36,37this type offitting process can reproduce with chemical accuracy the cohesive energy of the infinite crystal, provided the proper functional (or meta-functional) has been chosen. The parameters obtained from thefit for the binding energy using the B3LYP functional are
= ± + ± × = ± + ± × − − E N N E N N ( ) (4.13 0.1) (9.9 0.6) ( ) (4.14 0.3) (9.2 1.0) B,spherical 1/3 B,elongated 1/3 (9) The extrapolated values of the binding energy of the infinite crystal are 4.13 eV/atom and 4.14 eV/atom for spherical and elongated dots, respectively, whereas the experimental value is 4.63 eV/atom.38 This result is quite good (especially when considering the simplicity of the method versus other high level direct methods) but is not so “spectacular” as for the energy gap, for which the superiority of the B3LYP functional for silicon has been demonstrated earlier by Zdetsis et al.35 Apparently, B3LYP is not as good for cohesive properties as for electronic and optical properties. This is also verified by the plot (and fit) of the “cohesive energy” (instead of binding energy per atom), shown inFigure 12below.
In addition to (or instead of) the binding energy, one can use the related, but not identical, concept of the“cohesive energy” to describe the cohesive properties of the nanocrystals in a “more uniform way”. The cohesive energy deals with the binding energy of the Si core for which the interaction of the surface atoms has been taken into account in a uniform way through the introduction of the chemical potential of hydrogen. This way, reconstructed nanocrystals, which by construction have a much smaller number of passivating hydrogen atoms, would naturally appear more stable, which is obviously true. Thus, although reconstructed nanocrystals, which technically have appeared to be less stable on the basis of binding energy
Figure 8.Plot showing the energy (optical and H−L) gap with respect to the diameter of the spherical quantum dots (red) along with a few points
from reconstructed (green) and elongated (blue) quantum dots. We also include some experimental results19−25from different research groups for
comparison. Dotted rectangles correspond to the visible-light range, and the black star (inset) shows the experimental band gap value for silicon.
Figure 9.Plot showing optical gap energy dependence on the number
of Si atoms for spherical quantum dots, whereas one point from reconstructed and elongated quantum dots represents comparison.
per (Si) atom, would be more stable by the use of cohesive energy. As we can see in Figure 12 this is clearly so. The cohesive energy is defined as
μ
= +
ECoh,QD [BEQD HNH] (10)
where BEQDis the binding energy of the quantum dot;μH is chemical potential of hydrogen; and NH is total number of hydrogen atoms in a quantum dot.Figure 12shows the plot of cohesive energies versus the number of silicon atoms,fitted to the same N−1/3 linear dependence as the binding energy per atom. The new parameters have been somewhat improved as can be seen in the following relations
= ± + − ± × = ± + − ± × − − E N N E N N ( ) (4.21 0.1) ( 4.4 0.1) ( ) (4.23 0.1) ( 4.7 0.5) COH,spherical 1/3 COH,elongated 1/3 (11)
As we can see, these cohesive energy values for the infinite crystal are closer to the experimental values, compared to the binding energy per atom, but still not as satisfactory as the energy gap or the cohesive energies of the MgH2 and BeH2 crystals.36,37Nevertheless, it has been demonstrated here that the cohesive energy, for obvious reasons, is a better criterion of stability for Si nanocrystals (with a varying number of surface hydrogens) compared to binding energy per (Si) atom.
To improve the calculated (extrapolated) cohesive energy of the infinite crystal, we have recalculated below the cohesive (and in part the optical) properties of selective silicon dots of small, medium, and large (but not very large, due to computational cost) sizes using the M06 meta-functional, which was very successful for MgH2and BeH2nanocrystals.
3.5. Comparison with the M06 Meta-Functional.39For the reasons explained above, we have chosen to compare the results for silicon nanocrystals obtained with the B3LYP
Figure 10.IR spectrum of spherical Si29H36, reconstructed Si26H18, and elongated Si26H42quantum dots. The continuous curves are produced by
Gaussian broadening. Calculations were performed at the B3LYP/SVP level.
Figure 11.Plot presenting binding energy per Si atom depending on
number of Si atoms for spherical, elongated, and reconstructed
quantum dots. Figure 12.dependence on the number of Si atoms for spherical, elongated, andPlot corresponding to the cohesive energy per Si atom
reconstructed quantum dots.
functional with similar results using the M06 (Meta) functional, using the samefitting scheme and procedures.
Figure 13represents the N-dependence of the cohesive and binding energy per silicon atom of small and medium size dots, using the M06 functional. As we can see, in contrast toFigures 11 and 12 (with B3LYP results), the M06 functional significantly improves (increases) both binding and cohesive energy per atom of the infinite system. However, at the same time it overestimates both of them. As was mentioned by Zdetsis et al.,36,37 the M06 functional is very reliable for cohesive properties, but for silicon it seems that its success is not as dramatic as for the metal hydrides. This is partly due to an inadequate number of points in thefit (as is indicated by the larger uncertainties in the infinite energy parameter A, ±0.58
and±0.39 eV in both cases compared to ±0.1 and ±0.1 eV for B3LYP). Needless to say, the experimental value of 4.63 eV for the cohesive energy is in fact obtained within the calculated statistical uncertainty of ±0.4 or ±0.5 eV, but this is not enough. Another possible reason for the not so good performance of the M06 functional is the geometry reoptimizations we have performed with this functional to obtain the (new) equilibrium geometries corresponding to the calculated cohesive and binding energies. As was shown by Zdetsis et al.,36,37although the M06 functional is very good for energies, it is not so good for geometries. This is why in the calculations of cohesive properties in refs 36 and 37 the geometries were optimized using the PBE functional, before the energies were computed by single-point M06 calculations. It is
Figure 13.N-dependence of the binding energy per heavy atom and cohesive energy per heavy atom comparison using the M06 functional.
anticipated that when we recalculate the equilibrium geometries and add more points in the fit the cohesive energy would improve significantly (perhaps close to the experimental value). This remains to be seen in future work.
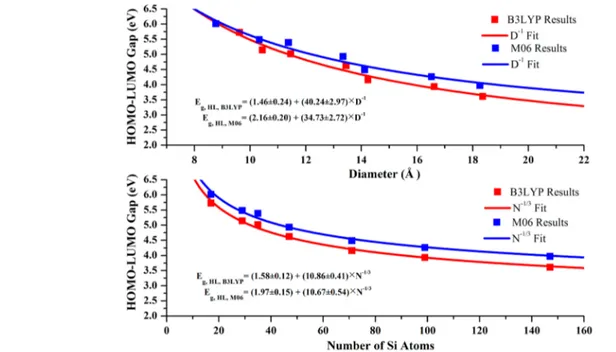
In addition to the comparisons of cohesive and binding energies we have also performed comparisons for the electronic and optical gaps, for which we have already shown the excellent performance of the B3LYP functional. The results of such comparisons are shown in Figure 14, which shows both D-dependence and N-D-dependence of the HOMO−LUMO gap of small and medium size (limited data sets) spherical silicon quantum dots. Red squares represent B3LYP results, and blue squares show M06 results. Red and blue curves correspond to the fit using eq 1. Clearly, the M06 functional significantly overestimates the HOMO−LUMO gap of each of the dots and consequently the infinite band gap compared with the B3LYP functional. Therefore, the comparison with the experimental energy gap is getting worse. Again, avoiding the M06 geometry optimization could improve the results and the agreement with experiment since M06 is not so good for geometry optimization (we can observe inFigure 14that M06 slightly reduces the Si− Si bond length, as can be seen by the differences in the diameters of nanocrystals containing the same number of Si and H atoms).
3.6. Other Related Properties. There are in the literature several empirical (to one degree or another) relationships27 connecting the dielectric constant (and/or the index of refraction) for a substance with the band gap as the key quantity. For example
= + + ⎛ ⎝ ⎜⎜ ⎞⎠⎟⎟ n A E B 1 g 2 (12) where A = 13.6 eV and B = 3.4 eV.
Therefore, from the above empirical relation (and its various extensions) one could have quick estimates of n (and epsilon) if one wishes to rely on such methods. For obvious reasons, in our fully ab initio study here we have not attempted to obtain any such estimates.
4. CONCLUSIONS
In conclusion, we have thoroughly and systematically studied the structural, cohesive, electronic, and optical properties of small, medium, and large silicon quantum dots, up to 32 Å in diameter (a total of 1017 atoms, i.e., 717 silicon atoms and 300 hydrogen atoms) in terms of size, growth pattern, and model description. Our results are fully consistent with the quantum confinement interpretation. An important, perhaps the most important, outcome of such a study, besides the very satisfactory agreement with experimental measurements for nanocrystals (up to 32 Å in diameter), is the judicious extrapolation of the nanoscale results all the way to infinite silicon crystal and the successful comparison with experiment for both the energy gap and the cohesive energy of crystalline silicon. We have found that the 1/3 expected dependence37of the cohesive energy on the number of particles can be fully appropriate and compatible with the gap size dependence on the grounds that“kinetic stability” and cohesive stability should vary in parallel, although this is not always valid.35The optical gaps of the nanocrystals, calculated with TDDFT, lead naturally (in an unbiased way) to the prediction of the band gap of crystalline silicon with almost chemical accuracy. The cohesive
energy of the infinite crystal has been also obtained with very good accuracy, which, if needed, can be further improved in a systematic way. Our present results for the band gaps, which are based on our earlierfindings for spherical Si quantum dots up to 20 Å in diameter, are in full agreement with those results and predictions. Thus, our results can serve as a“yard stick” for a quick (and rather accurate) estimate of such fundamental quantities.
Comparing the three different growth models (spherical, elongated, and reconstructed) for small and medium size dots, the reconstructed nanocrystals are more stable in comparison to both unreconstructed ones. The spherical ones are more stable (and with larger HOMO−LUMO gaps) compared to the elongated dots. However, for large enough nanocrystals the stability and energy gaps become similar, and for very large dots (as n → ∞) the results practically coincide, as would be expected.
■
AUTHOR INFORMATIONCorresponding Author
*E-mail: [email protected]; [email protected]. tr. Phone: +90-312-290-2514. Fax: +90-312-266-4579. Notes
The authors declare no competingfinancial interest.
■
ACKNOWLEDGMENTSThe State Scholarships Foundation (Iδρύμα Kρατικών Yπoτρoφιών) Greece “IKY” and The Scientific and Techno-logical Research Council of Turkey“TÜBİTAK” are gratefully acknowledged.
■
REFERENCES(1) Cho, B.; Baek, S.; Woo, H.-G.; Sohn, H. Synthesis of Silicon Quantum Dots Showing High Quantum Efficiency. J. Nanosci. Nanotechnol. 2014, 14, 5868−5872.
(2) Ji, J.; Wang, G.; You, X.; Xu, X. Functionalized silicon quantum dots by N-vinylcarbazole: synthesis and spectroscopic properties. Nanoscale Res. Lett. 2014, 9, 384.
(3) Li, H.; Wu, Z.; Zhou, T.; Sellinger, A.; Lusk, M. T. Tailoring the optical gap of silicon quantum dots without changing their size. Phys. Chem. Chem. Phys. 2014, 16, 19275−19281.
(4) Garoufalis, C. S.; Zdetsis, A. D.; Grimme, S. High Level Ab Initio Calculations of the Optical Gap of Small Silicon Quantum Dots. Phys. Rev. Lett. 2001, 87, 276402−276405.
(5) Niaz, S.; Koukaras, E. N.; Katsougrakis, N. P.; Kourelis, T. G.; Kougias, D. K.; Zdetsis, A. D. Size dependence of the optical gap of “small” silicon quantum dots: Ab initio and empirical correlation schemes. Microelectron. Eng. 2013, 112, 231−234.
(6) Barbagiovanni, E. G.; Lockwood, D. J.; Simpson, P. J.; Goncharova, L. V. Quantum confinement in Si and Ge nanostructures. J. Appl. Phys. 2012, 111, 034307−9.
(7) Glinka, Y. D.; Lin, S. H.; Hwang, L. P.; Chen, Y. T.; Tolk, N. H.
Size effect in self-trapped exciton photoluminescence from SiO2-based
nanoscale materials. Phys. Rev. B: Condens. Matter Mater. Phys. 2001, 64, 085421.
(8) Qin, G. G.; Song, H. Z.; Zhang, B. R.; Lin, J.; Duan, J. Q.; Yao, G. Q. Experimental evidence for luminescence from silicon oxide layers in oxidized porous silicon. Phys. Rev. B: Condens. Matter Mater. Phys. 1996, 54, 2548−2555.
(9) Park, N.-M.; Kim, T.-S.; Park, S.-J. Band gap engineering of amorphous silicon quantum dots for light-emitting diodes. Appl. Phys. Lett. 2001, 78, 2575−2577.
(10) Nirmal, M.; Brus, L. Luminescence Photophysics in Semi-conductor Nanocrystals. Acc. Chem. Res. 1999, 32, 407−414.
(16) Liu, J.; Erogbogbo, F.; Yong, K.-T.; Ye, L.; Liu, J.; Hu, R.; Chen, H.; Hu, Y.; Yang, Y.; Yang, J.; Roy, I.; Karker, N. A.; Swihart, M. T.; Prasad, P. N. Assessing Clinical Prospects of Silicon Quantum Dots: Studies in Mice and Monkeys. ACS Nano 2013, 7, 7303−7310.
(17) Medintz, I. L.; Uyeda, H. T.; Goldman, E. R.; Mattoussi, H. Quantum dot bioconjugates for imaging, labelling and sensing. Nat.
Mater. 2005, 4, 435−446.
(18) Lu, H.; Zhao, Y.-J.; Yang, X.-B.; Xu, H. Theoretical investigation of structural stability and electronic properties of hydrogenated silicon nanocrystals: Size, shape, and surface reconstruction. Phys. Rev. B: Condens. Matter Mater. Phys. 2012, 86, 085440.
(19) Wilcoxon, J. P.; Samara, G. A.; Provencio, P. N. Optical and electronic properties of Si nanoclusters synthesized in inverse micelles. Phys. Rev. B: Condens. Matter Mater. Phys. 1999, 60, 2704−2714.
(20) Wolkin, M. V.; Jorne, J.; Fauchet, P. M.; Allan, G.; Delerue, C. Electronic States and Luminescence in Porous Silicon Quantum Dots: The Role of Oxygen. Phys. Rev. Lett. 1999, 82, 197−200.
(21) Ledoux, G.; Gong, J.; Huisken, F.; Guillois, O.; Reynaud, C. Photoluminescence of size-separated silicon nanocrystals: Confirma-tion of quantum confinement. Appl. Phys. Lett. 2002, 80, 4834−4836. (22) Zhang, Q.; Bayliss, S. C. The correlation of dimensionality with emitted wavelength and ordering of freshly produced porous silicon. J.
Appl. Phys. 1996, 79, 1351−1356.
(23) Kanemitsu, Y. Luminescence properties of nanometer-sized Si crystallites: Core and surface states. Phys. Rev. B: Condens. Matter
Mater. Phys. 1994, 49, 16845−16848.
(24) Belomoin, G.; Therrien, J.; Smith, A.; Rao, S.; Twesten, R.; Chaieb, S.; Nayfeh, M. H.; Wagner, L.; Mitas, L.; et al. Effects of
surface termination on the band gap of ultrabright Si29nanoparticles:
Experiments and computational models. Phys. Rev. B: Condens. Matter Mater. Phys. 2002, 65, 193406.
(25) Ding, L.; Chen, T. P.; Liu, Y.; Yang, M.; Wong, J. I.; Liu, Y. C.; Trigg, A. D.; Zhu, F. R.; Tan, M. C.; Fung, S. Influence of nanocrystal
size on optical properties of Si nanocrystals embedded in SiO2
synthesized by Si ion implantation. J. Appl. Phys. 2007, 101, 103525−6.
(26) Wang, B.; Chou, Y.; Deng, J.; Dung, Y. Structural and Optical Properties of Passivated Silicon Nanoclusters with Different Shapes: A
Theoretical Investigation. J. Phys. Chem. A 2008, 112, 6351−6357.
(27) Hervé, P. J. L.; Vandamme, L. K. J. Empirical temperature
dependence of the refractive index of semiconductors. J. Appl. Phys. 1995, 77, 5476−5477.
(28) Ghosh, D. K.; Samanta, L. K.; Bhar, G. C. A simple model for evaluation of refractive indices of some binary and ternary mixed
crystals. Infrared Phys. 1984, 24, 43−47.
(29) TURBOMOLE (version 5.6); Universitat Karlsruhe: Karlsruhe, Germany, 2000.
(30) Frisch, M. J.; Trucks, G. W.; Schlegel, H. B.; Scuseria, G. E.; Robb, M. A.; Cheeseman, J. R.; Scalmani, G.; Barone, V.; Mennucci, B.; Petersson, G. A.; Nakatsuji, H.; Caricato, M.; Li, X.; Hratchian, H. P.; Izmaylov, A. F.; Bloino, J.; Zheng, G.; Sonnenberg, J. L.; Hada, M.;
2577.
(33) Schäfer, A.; Huber, C.; Ahlrichs, R. Fully Optimized Contracted
Gaussian Basis Sets of Triple Zeta Valence Quality for Atoms Li to Kr. J. Chem. Phys. 1994, 100, 5829−5835.
(34) Weigend, F.; Ahlrichs, R. Balanced basis sets of split valence, triple zeta valence and quadruple zeta valence quality for H to Rn: Design an assessment of accuracy. Phys. Chem. Chem. Phys. 2005, 7, 3297−3305.
(35) Zdetsis, A. D. Structural, Cohesive, Electronic, and Aromatic Properties of Selected Fully and Partially Hydrogenated Carbon Fullerenes. J. Phys. Chem. C 2011, 115, 14507−14516.
(36) Koukaras, E. N.; Zdetsis, A. D.; Sigalas, M. M. Ab Initio Study of Magnesium and Magnesium Hydride Nanoclusters and Nanocrystals: Examining Optimal Structures and Compositions for Efficient Hydrogen Storage. J. Am. Chem. Soc. 2012, 134, 15914−15922.
(37) Zdetsis, A. D.; Sigalas, M. M.; Koukaras, E. N. Ab initio theoretical investigation of beryllium and beryllium hydride nano-particles and nanocrystals with implications for the corresponding infinite systems. Phys. Chem. Chem. Phys. 2014, 16, 14172−14182.
(38) Kittel, C. Introduction to Solid State Physics; John Wiley & Sons: New York, 1971.
(39) Zhao, Y.; Truhlar, D. G. The M06 suite of density functionals for main group thermochemistry, thermochemical kinetics, non-covalent interactions, excited states, and transition elements: two new functionals and systematic testing of four M06-class functionals and 12 other functionals. Theor. Chem. Acc. 2008, 120, 215−241.