ORIGINAL CONTRIBUTION
Production and characterization of liquid crystal/polyacrylonitrile
nano-fibers by electrospinning method
Atilla Eren Mamuk1 &Çağdaş Koçak2 &Çiğdem Elif Demirci Dönmez3
Received: 21 November 2020 / Revised: 17 April 2021 / Accepted: 17 April 2021
# The Author(s), under exclusive licence to Springer-Verlag GmbH Germany, part of Springer Nature 2021 Abstract
We present that high birefringent nematic liquid crystal,4–n–pentyl–4’–cyanobiphenyl, was incorporated into the polyacryloni-trile precursor which has a strong polar cyano group so as to produce electrospun nano-fibers, as the first time. Optical textures of nano-fibers were taken by polarized optical microscopy with different angles to determine the orientation degree of liquid crystal molecules in the center of the fiber. The molecules of liquid crystal self-ordered within the core of the fiber. Variation in morphology of liquid crystal/polymer nano-fibers were examined by utilizing both scanning electron microscopy and polarized optical microscopy depending on liquid crystal concentration in precursor and application voltage during electrospinning. Morphology of nano-fibers was significantly affected by electrospinning parameters and liquid crystal/polymer ratio. To under-stand phase separation and thermal stability of nano-fibers, calorimetric and thermogravimetric analyses were performed. Keywords Liquid crystals . Polymer . Electrospinning . Nano-fiber . TGA . DSC . Globules in fiber
Introduction
Liquid crystals (LCs) are an important type of materials that exhibit anisotropic properties and give materials various phys-ical properties. In addition to this, LCs have specific phase behavior which has both weak molecular ordering and rheo-logic properties likewise solid crystals and ordinary liquids, respectively [1]. This phase can be changed and controlled in different ways, such as surface interactions [2]. Despite liquid crystals that are generally researched in cell type samples for investigating optical properties and dynamics of defects [3,4], they are quite suitable materials to be examined by combining them with various geometries and different types of materials. LCs may be prepared in much morphologies by merging with different materials such as azo dyes, polymers, and
nano-particles [5–7]. Thereby, various occasions/reasons arise to investigate the unique physical properties of LCs [8].
A great deal of work has been focused on improving ther-mal, optical, and structural properties of LCs by composing with polymers. LC/polymer composites are utilized in several applications such as artificial muscles [9], mirrorless lasing [10,11], and a variety of flexible light–modulating devices
[12–14]. In order to benefit some of the physical properties, such as anisotropy, self-ordering at the molecular level, and birefringence, LC/polymer composites are able to be formed in fiber. LCs have been produced in fiber structure as the core of a fiber by using different production techniques, for exam-ple, single-needle electrospinning, coaxial electrospinning, and airbrushing. The diameter of the fiber which is produced by electrospun and airbrushing is ordinarily less than 10μm, thus limiting the diameter of the LC core to a couple of micron dimensions [15].
Recently, owing to generate microscale fibers with a core-sheath structure in which a liquid crystal or polymer core is encapsulated with a surrounding polymer shell, the electrospinning technique has been frequently used as a simple method [8,16–19]. Reyes et al. [20] reported that electrospun mats of liquid crystal core fiber sensed the organic volatile vapors by responding to the optical changes. Also, electrospun LC/polymer fibers were reported as to have potential for some applications such that drug delivery, gas sensors, * Atilla Eren Mamuk
1
Liquid Crystals Laboratory, Department of Physics, Muğla Sitki Koçman University, TR48000 Muğla, Turkey
2
Molecular Nano-Materials Laboratory, Department of Physics, Muğla Sitki Koçman University, TR48000 Muğla, Turkey
3 The Center of Research Laboratories, Muğla Sitki Koçman
University, TR48000 Muğla, Turkey
electronics [21–23], actuators in soft robotics and responsive textiles [10], and semi-flexible material [24]. Aside from electrospinning, it was reported that a solid polymer cylindri-cal core was separately submerged in both polymer and LC solutions as a new type of LC/polymer fiber production way, thus obtaining a three-layer cylindrical polymer/LC/polymer core-sheath structure fiber [15].
In this study, we showed that thermotropic LC/polymer core-sheath fibers are produced by single-needle electrospinning technique and how their optical, thermal, and structural properties change depending on LC/polymer ratio. Because of quite important benefits, polyacrylonitrile (PAN) was preferred for a polymeric host in our experiments: (i) that mean refractive index of PAN which is 1.53 at 25°C [25] is close to 1.60 at 23°C [26] of 5CB. Therefore, we expected transparent sheath to be achieved. (ii) PAN has polar cyano groups, in this way, it can influence and enhance some physical properties of LCs [27]. In previous studies, PAN was used several times with LCs or liquid crystalline materials for making a composite for altering the properties of LCs. Salim et al. [28] reported that PAN was used as a host in the precur-sor for producing liquid crystalline graphene oxide microfibers which were made by wet-spinning process. In [28], instead of LC, a quasi-liquid crystal material was used as a dopant, and microfibers were produced by using different methods from electrospinning. Chino et al. [29] reported that pure PAN was electrospun without mixing with any LC and collected over an ITO covered glass as a fiber mat and this deposited glass assembled with another glass as a type of sandwich cell; thereafter, LC was injected into the cell by capillary effect and was investigated under the influence of an electric field. Hence, LC/polymer structure has not been formed in [29]. In another study, some LCs and PAN were mixed to form a kind of polymer/gel structure, and the electro-optical properties of the structure were examined, but the fiber structure was not formed and/or focused [27]. In our research, the thermotropic nematic LC 5CB was incorporated into the core of PAN fibers by way of electrospinning in order to obtain nano-fiber for the first time. We successfully performed the self-assembly of the 5CB, which is widely used in re-searches and exhibits a liquid crystalline phase at room tem-perature, in the core of a nano-fiber by electrospinning pro-cess. Optical properties were given in order to determine the degree of birefringence of electrospun 5CB/PAN nano-fibers and these were related to the ability of the fibers to modulate light. Also, we performed structural characterization of nano-fibers to reveal the effects of electrospinning parameters and LC/polymer concentrations on the structure. Structural prop-erties are pretty related to optical parameters of LC/polymer nano-fibers. In addition, thermal properties of nano-fibers were studied so as to determine how the 5CB concentration in composite affects the nematic-isotropic (N-I) phase transi-tion temperature and to see the mass change of the nano-fiber
over time as the temperature changes. Depending on the re-sults obtained, LC/polymer nano-fibers may be used in poten-tial applications such as light-modulating devices and optical actuators or in different optical device applications.
Experimental
Materials
As a LC core, 4–n–pentyl–4’–cyanobiphenyl (5CB) which was purchased from TCI Inc. was used as a LC. Scheme1a
demonstrates the molecular structure of 5CB. It shows nemat-ic phase between 22 and 35°C temperature interval in the event of bulk state, and has a 0.18 birefringence at 23°C [30]. Phase transition temperatures may change depending on research conditions. The cyano group in the molecular structure of 5CB which can be regarded to be along the mo-lecular long axis determines the dipolar moment and polariz-ability of its molecule [30,31]. Therefore, 5CB is a compound of a high optical anisotropy and chemical stability in the ne-matic mesophase that makes it particularly favorable for LC/ polymer structures.
Polyacrylonitrile (PAN) was used as an electrospinning host material and purchased from Sigma–Aldrich. The mo-lecular weight of PAN is on average 150,000wt (typical). PAN molecule consists of a strong nitrile group so it could serve polar structure and increase the interaction with other polar molecules. Since PAN becomes rigid into an amor-phous state and shows a very low birefringence (≈ 0.01) [32], it can efficaciously be used as the sheath part of nano-fiber. Owing to be transparent in/ below micron-scale, PAN is quite suitable for LC/polymer fibers as a transpar-ent sheath [27] in nanoscale. Dimethylformamide (DMF) is Reagent Plus grade, purchased from Sigma–Aldrich and used without further purification. DMF is as a strong polar solvent as so as to dissolve PAN.
Solution preparation
5CB/PAN precursors were prepared in five different concen-trations, 8.88%, 19.17%, 42.86%, 49.91%, and 69.36%, and called M1, M2, M3, M4, and M5, respectively, and also tab-ulated in Table1. Firstly, 7.6wt% PAN+DMF solution was prepared and 5CB/PAN precursors were prepared by adding the required amount of 5CB to the PAN+DMF solution in order to have 5CB/PAN ratios such as 8.88%, 19.17%, 42.86%, 49.91%, and 69.36%, and by stirring gently for a day—24 h. In each precursor, the 7.6wt% ratio was kept con-stant in PAN+DMF solution and it is used as a sixth precursor named M0.
Electrospinning system
PAN/5CB precursor was electrospun by using the Inovenso electrospinning device as depicted in Scheme2. It is a com-pact device consisting of a programmable syringe pump with an accuracy of 0.001ml/h, a 0.0–40.0 kV adjustable high volt-age supply, and a needle target set up in a horizontal fashion; the needle is set as a positive pole and the target as a negative pole. The standard deep green syringe needle of 0.8 mm outer and 0.5 mm inner diameter was used as the needle throughout the experiments. After covering the metal target, a 20-μm-thick aluminum foil and glass substrates attached to the foil were used as a collector. The distance between the needle and collector,z, was set and kept at 23.0 cm for all electrospinning processes. The LC/polymer composite was collected under different electrospinning voltages that were 12.0, 15.0, 18.0, 21.0, and 24.0 kV and corresponding E-fields of 521.7, 652.2, 782.6, 913.0, and 1043.5 V/cm, respectively. During the col-lection, in order to obtain a fine-spinning jet, the flow rate of the precursor was adjusted from 0.15 to 3.00 ml/h depending on the concentration and the electrospinning voltage. All pro-cesses were performed at room temperature.
Polarized optical microscopy (POM)
Optical and morphological properties of pure PAN and LC/ PAN nano-fibers were studied by using Olympus BX-51P polarized optical microscopy (POM) which is equipped with
optical retarders. In order to obtain textures of nano-fibers, firstly, samples of electrospun nano-fibers were collected over microscope slides; then, microphotographs of samples were taken by integrated Canon 6D camera between the crossed polarizers of POM in transmission mode.
Scanning electron microscopy (SEM)
The morphology and diameter of the nano-fibers were ob-served using an SEM (JEOL JSM-7600F; JEOL Ltd., Tokyo, Japan). All samples were sputtered for 60 s with a layer of gold under argon inert gas prior to SEM observation to get rid of charging effect and produce better quality images.
Differential scanning calorimetry (DSC)
DSC measurements were performed using a Perkin Elmer, DSC 8000 equipment to determine the temperature-dependent first-order phase transition characteristic of nano-fibers. Samples were sealed in aluminum pans. Empty alumi-num pans with a weight of 0.02 mg were used as a reference for each measurement. Scanning rate of heating in the range of 30 to 50 °C was 5 °C/min. Measurements were carried out under nitrogen gas with a flow rate of 20 ml/min. The mass temperature precision is stated as ±0.008% and the mass tem-perature accuracy is stated as ±0.05%.
Scheme 1 Chemical structure of (a) 5CB and (b) polyacrylonitrile (PAN)
Scheme 2 A schematic drawing illustrating of single-needle electrospinning system
Thermogravimetric analysis (TGA)
TGA was carried out using a Perkin Elmer, TGA 4000 equip-ment in the temperature range from 30 to 900 °C with a heating rate of 10 °C/min. Samples were placed in ceramic sample pans for the measurement. Measurements were carried out under nitrogen gas with a flow of 20 ml/min to determine the thermal properties of the nano-fibers. The initial masses used for measurement were determined as 5 mg for each sam-ple. The mass measurement precision is stated as ±0.01%.
Results
Optical properties of nano-fibers
According to our claim, we expected that LC within the fiber solution should be self-settled inside electrospun nano-fiber as a cylindrical core and should be surrounded by poly-mer sheath. It has been reported in the literature that different techniques are used to determine whether there is LC in the fiber structure and whether the LC is oriented [12,24,33]. Lagerwall et al. [33] produced fibers in core-sheath structure by combining a liquid crystal with TiO2doped PVP polymer by coaxial electrospinning method. Polarized Raman spec-troscopy was used to detect the presence and orientation of the liquid crystal within the fiber. The presence of peaks in Raman spectra of bulk LC at the same wavenumber as also observed in the LC/polymer fiber validated the existence of LC in the fiber structure [33]. As we indicated in“Materials,”
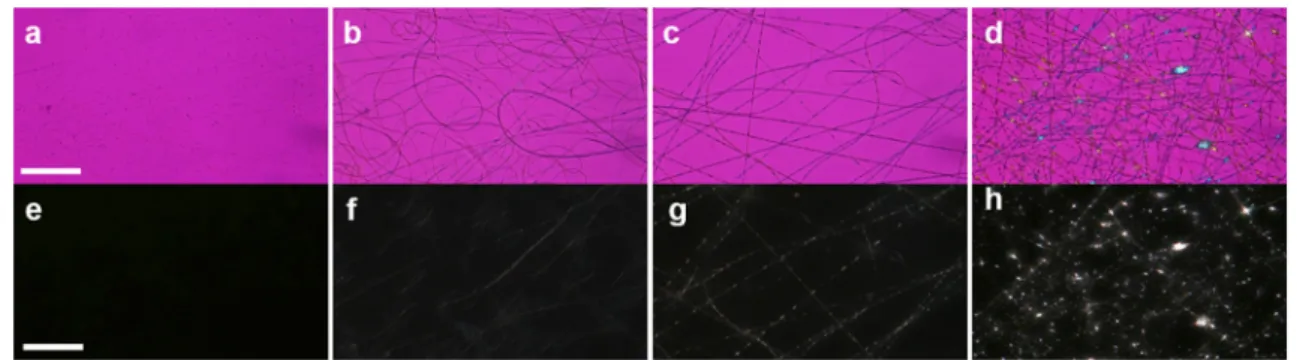
5CB shows high optical anisotropy and birefringence (0.18 at 23°C), whereas PAN shows very low birefringence (0.01 at 23°C). The existence of 5CB in fiber could be determined by considering the comparison of differences between the bire-fringence of PAN and 5CB. In order to prove our claim, we took textures of nano-fibers in various LC concentrations which were stayed between crossed polarizers with an addi-tional 530-nm optical retarder and without any optical retarder under POM (Fig.1). Textures of pure PAN fibers (M0) were also taken with the same method, as seen in Fig.1. Textures in
Fig.1were obtained using POM in transmission mode with ×40 magnification lens and with fixed incident light intensity. Depending on 5CB ratio in solution, birefringence changed. In Fig.1a, the M0 nano-fibers are clearly observed by adding 530-nm retarder; however, they are not appearing under crossed polarizers since pure PAN does not exhibit birefrin-gence (Fig.1e). Figure1bdemonstrates that the M1 sample which has an 8.88% 5CB ratio has apparent electrospun nano-fibers by using optic retarder, but these nano-nano-fibers shadowy appeared under crossed polarizers owing to having low LC concentration as seen in Fig.1f. As the birefringence of PAN and 5CB is considered, it is quite normal that no birefringence could be observed for M0 at ×40 magnification in comparison with the birefringence exhibited by M1 containing 8.88% liq-uid crystal. By increasing 5CB ratio from 8.88 to 69.36%, the brightening of nano-fibers noticeably increased because of high birefringence (Fig.1e–h). With rising LC concentration, globules grew in size up. The reasons behind the formation of globules and their dependence on spinning parameters will be given in detail in“Morphological properties of nano-fibers.”
Hereby, globules which are filled with LC are pretty visible under crossed polarizers (Fig.1h). Additionally, with increas-ing the collection time of nano-fiber, the surface of the micro-scope slide was almost wholly covered by nano-fibers; thus, the samples which stayed between crossed polarizers ap-peared quite bright (SI 1). As a result, it is clear that LC/ p o l y m e r h o m o g e n e i t y p r o c e e d e d t h r o u g h o u t t h e electrospinning process.
The brightness of a birefringent material oriented along a single direction depends on the angle between the crossed polarizers and the optical axis [34]. 5CB has positive birefrin-gence and is uniaxial material. The polarization state of line-arly polarized light coming to the LC, located in between crossed polarizer, changes after passing through LC and be-comes elliptically polarized. Since elliptically polarized light has two components and only one component can pass through the analyzer, LC appears bright when observed by way of POM. The mathematical expression of the intensity of transmitting light from LC is given below:
I ¼ I0sin22φ sin2
δ
2 ð1Þ
whereI0,φ, and δ are the light intensity after the polarizer, the angle between the analyzer and the projection of the optical axis of LC molecules onto the sample plane, and phase differ-ence between ordinary and extraordinary waves, respectively. The first sine term is substantially associated with the variation in the intensity of transmitting light [34]. In order to show the LC orientation in the fiber, one can perform an experiment which is birefringence as a function of the angleφ. In another approach, in Lagerwal’s study, it is proved that LC molecules settled along fiber direction by Raman spectra Table 1 The code of nano-fiber samples according to %5CB
concen-tration in the precursor
The code of sample % 5CB in precursor
M0 0 M1 8.88 M2 19.17 M3 42.86 M4 49.91 M5 69.36
obtained in different polarization directions [33]. In our study, when the LC sample is rotated around the angleφ of 45° and 0° with respect to the analyzer, the first sine term becomes maximum and minimum, i.e., the texture of LC appears brightest and darker, respectively. In Fig.2a, some of the electrospun 5CB/PAN nano-fibers which are oriented 45° with crossed analyzer are observed pretty bright. By counter-clockwise rotating the sample, the brightness of ori-ented nano-fibers decreases (Fig.2b–c) and finally nano-fibers seem completely dark coupled with fiber orientation parallel to the analyzer (Fig. 2d). It reveals that 5CB is planarly self-ordered within the core of PAN sheath because
of the great ordering strength affecting the spinning. The LC-polymer phase separation (core-sheath structure) in fibers spun by different generating technique was observed by Jakli’s and West’s research group [35–38]. In [35], the fibers were spun by single-needle electrospinning as we performed, and the change in the morphology of the fibers depending on relative humidity, solvent parameters, and production param-eters was investigated. The proof of phase separation in fibers was demonstrated by POM analysis by utilizing the anisotro-py properties of the LC [35]. In our study, temperature-dependent optical measurement was carried out to show that the core-sheath structure was formed. As is known, although Fig. 1 POM images of nano-fibers collected on microscope glass are
given in a to d between crossed polarizers with 530-nm optic retarder and e to h without retarder. a and e for sample M0 (pure PAN), b and f for sample M1, c and g for sample M3, and d and h for sample M5. All
nano-fibers were electrospun at 12.0-kV application voltage, 23.0-cm collec-tion distance, one-minute colleccollec-tion duracollec-tion. The scale bar represents 100μm
Fig. 2 Optical textures of M3 sample taken between crossed polarizer and analyzer are given in order to observe the variation of birefringence depending on the angle where LC molecules were oriented with respect to the analyzer. Textures were shot by rotating counter-clockwise at a 45°, b 30°, c 15°, and d 0°, with respect to the analyzer. The posi-tion of the polarizer and analyzer is given at b. Nano-fibers were spun at 24-kV application volt-age, 23-cm collection distance, 1-min collection duration. The scale bar means 40μm
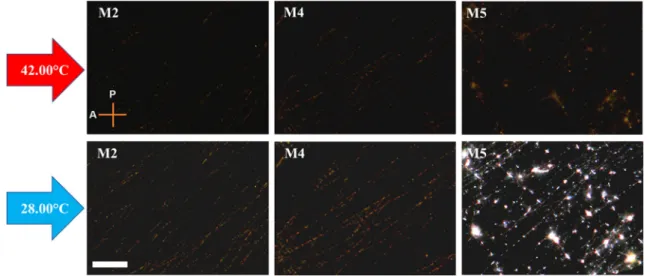
LCs exhibit anisotropy within a certain temperature range, they behave like isotropic liquids above this temperature range [1]. In order to take advantage of the property of LCs, optical textures of the nano-fibers were taken below and above the N-I phase transition temperature (TNI) between crossed polarizers. These temperature values are 28°C and 42° C, respectively. In Fig.3, there are textures of M2, M4, and M5 samples taken at 42° C in the upper row. Nano-fibers with LC in the core do not appear in textures taken above the TNI. Only in areas where the fibers are dense and thick are they very poorly visible due to the weak birefringence of PAN. In Fig.
3, in the lower row, there are textures of the same samples taken at 28°C. In these textures taken below the TNI, the nano-fibers are clearly visible and shine under the cross-polarizer due to the high birefringence of the 5CB. This experiment, which was carried out by making use of the anisotropic be-havior of the liquid crystal, also shows that the 5CB self-embedded in the fiber core. The mechanism of core-sheath formation may have occurred as follows: nematic LCs (such as 5CB that we used) are affected by external electric field [1]. Under high electric field, nematic LC molecules tend to align in the direction of the electric field. Considering this peculiar-ity, by inducing molecular orientation of LC under electric field during electrospinning, continuous LC/polymer nano-fibers through the electric field of electrospinning may be spun. In the electrospinning process, it is well known that the solvent evaporates very quickly in the high-speed electrospinning process with respect to fiber production with traditional drawing method. In this case, experimental studies reported in the literature show that there is not enough time for the molecular organization of liquid crystal molecules, and thus LC-polymer phase separation, revealed in core-sheath structure in our study, does not occur [39]. The DMF we used in our study has a low vapor pressure and the needle-collector distance was kept relatively high asz = 23.0 cm compared to
the distances reported in other studies [10, 40,41]. Thus, either the solvent DMF did not evaporate rapidly or DMF had an enough travel time to move away from the structure by keeping the z distance wide, 23.0 cm. Therefore, 5CB LC might be oriented as a core inside the fiber due to the high elongational forces affecting the spinning jet. The optical bi-refringence study shown in Fig.2 proved that the 5CB was arranged in planar orientation along the fiber. Yao et al. [42] reported that liquid crystal monomers (reactive mesogens) were oriented inside the fiber as a core in the core-sheath structure with the technique we used (single-needle electrospinning). Moreover, several interference colors which are incorporated by birefringence obviously appear within globules in Fig.2. The second sine term in the Eq.1is respon-sible for these colors of the nano-fibers. It is the evidence of the existence of 5CB encapsulated by PAN.
Morphological properties of nano-fibers
In this part, we examined the morphological properties of 5CB/PAN nano-fibers depending on LC concentrations and applied voltages during the electrospinning process. Several factors, e.g., viscosity, surface tension, applied voltage, con-centration of the solution, injection rate, and distance between the needle and collector, may affect the morphology of electrospun nano-fibers [39,43]. We specified 5CB concentration in PAN and applied voltage as 8.88% 19.17% -42.86% - 49.91% - 69.36% by weight percentage and 12.0 kV - 15.0 kV - 18.0 kV - 21.0 kV - 24.0 kV, respectively. All samples were studied by using POM and SEM.
In Fig.4, optical textures of samples in various concentra-tions captured between crossed polarizers and also by using 137-nm optical retarder are shown. During capturing textures in Fig. 4, although applied voltage and distance between collecting plate and electrospinning needle were kept fixed
Fig. 3 Optical textures of M2, M3, and M5 samples taken between crossed polarizer and analyzer are given in order to observe the variation of birefringence depending on temperature. The scale bar means 60μm
12 kV and 23 cm, respectively, the injection rate of the LC/ polymer solution was altered depending on the LC concentration in order to gain fine-spinning jet. The final fiber structure is strongly dependent on how fine is the spinning jet. The final fiber structure is highly dependent on the spinning quality and smoothness of the jet. What the quality and the smoothness meant is non-pulsed and dropletless jet, from Taylor cone, which we call a fine-spinning jet. Also, the collection time of nano-fibers was set to 1 min for each sample. Figure4shows that electrospun nano-fibers generated non-woven fiber mats with random fiber orientation. According to Fig.4, the amount of electrospun nano-fiber per unit surface area increases relatively by raising 5CB concentration in structure. This result may be due to several reasons: as the ratio of 5CB in precursor increased, the viscosity of precursor decreased. The decrease in viscosity in-creased the spinning jet speed [39]. Moreover, regarding the decrease in viscosity, the increase in the injection rate caused the solution to exit the needle faster and the spinning jet speed to increase [44–46]. In our study, the injection rate was increased with the increase of 5CB in order to obtain a fine-spinning jet, as mentioned above. In addition, the viscosity decreased with the increase of 5CB in the precursor. For these reasons, it caused the solution to come out faster from the needle. Thus, in different precursors which had various 5CB concentration electrospun for the same time interval, the fiber density collected in the collector was also different. In addition, experimental results revealed that globules in different shapes existed along pure PAN and 5CB/ PAN nano-fibers in various sizes. The electrospun nano-fibers exhibit discontinuities which are distributed relatively unsystem-atic; also, the 5CB is encapsulated in globules and in the 5CB/ PAN nano-fiber cores. Despite very small globules that were determined at M1 (Fig.4b), as the 5CB concentration increased, bigger globules were seen in the nano-fibers (Fig.4c–f). By increasing the 5CB concentration, globules increase in size and the fiber morphology becomes non-uniform. At M5 sample which has the maximum LC ratio in structure, the LC globules
clustered too much and tear the polymer sheath in some regions, causing the structure to deteriorate (Fig.4f). When the textures taken for different applied voltages were examined, similar re-sults were indicated (SI 2). The authors thought that the increase in the size of globules by increasing 5CB concentration may be due to the decrease of precursor viscosity. In the literature, the formation of beading structures was also dependent on solution viscosity. In the studies conducted, as the viscosity decreased, while the application voltage and needle-collector distance was kept constant, it is concluded that the beading structures formed and grew [39,44,47]. In our study, the solution viscosity de-creased as the 5CB ratio inde-creased in the solution. In this context, globules were expected to increase regularly in size with the increase in 5CB concentration (resulting decrease in viscosity). In Figs.4and5, it is clearly seen that the size of the beading structures increased.
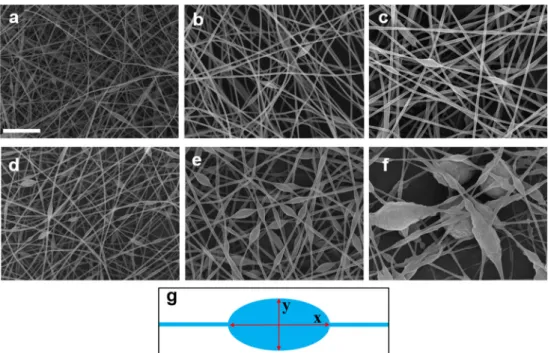
In order to analyze the morphology of nano-fibers, SEM images were taken (Fig.5a–f). Globules located along nano-fibers are clearly observed in both pure PAN nano-nano-fibers and 5CB/PAN nano-fibers with various concentrations. Similar to the POM images, the size of globules was increased by in-creasing the 5CB concentration in the nano-fibers (Fig.5). As we expected, in Fig. 5f which belongs to M5, the largest globules are clearly observed. In addition to this, entangle-ment between the nano-fibers and globules was specified in SEM image of M5 nano-fibers; thus, it supported the results of POM images. Besides, we studied on the mean value of thick-nesses of nano-fibers and aspect ratio (AR) of globules at certain application voltage (12.0 kV) by using SEM images. AR is identified by calculating the width (y)/length (x) ratio depicted in Fig.5g. Variation of nano-fiber thickness and AR of globules versus 5CB (%) in precursor are given in the same graph (Fig.6). AR is a degree for being elongated of globules along the fiber from spherical to oval shape. Although M0 (pure PAN) shows smaller globules, it shows the relatively high AR. As soon as 5CB increases, AR of globules tends Fig. 4 Optical textures of M0 (pure PAN), M1, M2, M3, M4, and M5 are
correlated with a, b, c, d, and e, respectively. Textures were taken by POM equipped with a 137-nm optic retarder, between crossed polarizes.
All samples were spun at 12-kV application voltage, 23-cm collection distance, and 1-min collection duration. The scale bar means 100μm
to decrease. Even though M1 nano-fibers show a slight de-crease of its globules, M2 nano-fibers and M3 nano-fibers have minimum globules with AR. By maintaining 5CB con-centration to rise, AR rapidly increases for relevant fibers and AR of M5 nano-fibers reaches almost the same value as the fiber of pure PAN. Moreover, the thickness of nano-fibers exhibits interesting variation depending on a 5CB% concen-tration in the structure. From M0 to M2, the thickness of nano-fiber properly increases an average from 160 to 320 nm. Then, thickness sharply decreases to an average of 170 nm in M3 nano-fibers; also, it is the minimum value among all LC/ polymer samples. Afterwards, the thickness of nano-fibers properly rises again up to 330 nm in M5 nano-fibers which is the thickest, as a mean value. Regarding the variation of fiber thickness and AR of globules, these are linearly
proportional to increasing the injection rate with constant vis-cosity, application voltage, and needle-collector distance [44]. However, by keeping the application voltage, injection rate, and needle-collector distance constant, they would increase with the increase of viscosity of precursor [44,45]. In our study, solution viscosity decreased with the addition of 5CB to the precursor. At the same time, in order to overcome such a handicap, the injection rate has been increased to obtain a fine-spinning jet with increasing 5CB in the precursor (i.e., de-crease in viscosity). Both the dede-crease in the precursor viscos-ity (expected to decrease the fiber thickness) and increase in the injection rate (expected to increase the fiber thickness) to achieve a fine-spinning jet have been the main factors in the change of fiber thickness and AR of globules. Depending on the dominance of these two factors with each other, fiber thickness and AR may not show a regular change in Fig.6.
The effect of applied voltage on the morphology of the fibers was even studied. The applied voltage between conduc-tive collector and needle during electrospinning is an impor-tant factor in order to get homogenous nano-fibers. By in-creasing voltage, it results in higher conductivity and fine spinning. The higher electrostatic driving force on the fluid jet helps the fiber to be thinner. This driving force is improved by increasing the applied voltage. In addition, if the applied voltage is increased further, the fiber solution leaves the nee-dle more rapidly by spinning jet from the Taylor cone; there-by, it is expected that the thickness of nano-fiber increases [39]. In the literature, it has been determined both theoretically and experimentally that the globules form and are grown with the increase of the applied voltage for a sample whose con-centration, viscosity, and needle-collector distance were kept constant [44–46]. In our study, it was determined that the globules increased with the increase in the application voltage. Fig. 5 SEM images of M0 (pure
PAN), M1, M2, M3, M4, and M5 are presented at a, b, c, d, e, respectively. All nano-fibers were spun at 12-kV application volt-age, 23-cm collection distance, and 1-min collection duration. The scale bar means 5μm. Also, the scheme of how aspect ratio is determined (AR) is shown in g
Fig. 6 Variation of nano-fiber thickness and aspect ratio (AR) vs 5CB ratio in the precursor is plotted
Figure7shows the optical textures of the M5 sample that was taken under POM by adding a 530-nm retarder. Needle-collector distance was kept at 23.0 cm and applied voltage was varied from 12.0 to 24.0 kV by 3.0 kV step. The increase in application voltage gives rise to significant differences in the morphology of nano-fibers. There is a tentative change in glob-ules of nano-fibers which produced under 12.0 kV and 15.0 kV (Fig.7a–b). However, the size of globules obviously increases as the applied voltage continues to rise (Fig.7c–e). The surface tension between the needle and the fluid forces the polymer solution to form droplets. However, the electrical and rheolog-ical forces impel the polymer solution to form fibers. The con-flict between these two is responsible for the variance of glob-ules’ shape with increasing applied voltage [12,45]. By ana-lyzing the textures taken under 21.0 kV and 24.0 kV, it was identified that the size of the globules rose enough to cover neighbor nano-fibers and the nano-fibers became entangled/ distorted in some regions (Fig.7d–e). Furthermore, some glob-ules tore due to disruption of sheath structure and regional LC-islands occurred. This case might be due to high electric field strength. We studied on mean values of AR of globules at a certain concentration depending on the application voltage by using POM images. The change in AR of globules for M0 nano-fibers and M3 nano-fibers is exhibited in Fig.8. It was quite a different behavior in these two samples: although the regime of AR was not directly proportional for M0 (pure PAN) nano-fibers, it almost linearly increased for M3 nano-fibers. SI 3 which was taken under POM with 137-nm retarder supports the change in the size of both globules and aspect ratio depend-ing on the applied voltage for sample M3.
Thermal properties of nano-fibers
Thermal analysis is an important part of the research in com-prehension of a relation between the structure and property of polymer composite materials. Thermal analysis allows for
specifying the volatile compounds and the amount of humid-ity in polymeric materials. Also, the shifting of phase transi-tion temperature of LC in fiber structure can be determined by performing thermal analysis of nano-fibers. In this sense, we performed thermogravimetric analysis (TGA) and differential scanning calorimetry (DSC) studies for nano-fibers and 5CB. Figure 9 shows TGA thermographs of both all nano-fiber samples and bulk 5CB LC. TGA gives us to study the weight loss and thermal deformation of samples. According to Fig.9, there are three main stages of weight loss for all nano-fiber samples (not for bulk 5CB). In the first stage, a slender loss of mass was observed between 90 and 150°C for M0 nano-fiber (pure PAN). This weak decrease might be owing to leaving water which was due to humidity from the atmosphere [28,
40]. A similar case was revealed for other samples in the first stage. In the second stage, remarkable loss of mass which was resulted due to pyrolytic reactions took place from about 300 to 350°C, and the rest of the amount of mass was about 60%; also, it was possible that some volatile gases evolved in this
Fig. 7 POM images of nano-fibers which belong to M4 (49.91%) are given by using POM between crossed polarizers with equipped 530-nm optic retarder. All nano-fibers were spun at various application voltages
as a 12 kV, b 15 kV, c 18 kV, d 21 kV, and e 24 kV; 23-cm fixed collection distance, 1-min fixed collection duration. The scale bar means 100μm
Fig. 8 Variation of and aspect ratio (AR) for M0 (pure PAN) and M3 (42.86%) vs application voltage is plotted
period [48–50]. Further mass diminishing in the second stage was obviously indicated between 350 and 470°C for M0 and this loss might be correlated to the evaporating of NH3, HCN, or some other volatile products [28,48,51]. The third stage tediously took place at about 470 to 900°C which was the process limit; as a result, 25% char mass remained. Weight loss of 5CB depending on temperature increment was dramat-ically different from M0 (pure PAN). There was no important variation in loss of weight until about 200°C. After this point, variation of loss of weight in bulk 5CB sharply dropped to 5% of its total mass, as seen in Fig.9. Then, total mass vanished slowly up to the exhaustion of whole mass. Considering the thermographs of 5CB and pure PAN (M0), by adding 5CB to the structure and increasing its amount, the loss in fiber mass increased from M0 to M5 in the same temperature interval. Although the beginning of the second stage of M1 was almost the same with M0, this initial temperature was negatively shifted from 295 to 245°C for M2 to M5, respectively. At the third stage, all nano-fibers monotonously lost their weight. As the amount of LC in the precursor increased, by consider-ing the thermographs of 5CB and pure PAN (M0), the amount of residual mass expectedly decreased to about 14%, 11%, 9%, 6%, and 3% in the nano-fiber of M1, M2, M3, M4, and M5, respectively.
In order to determine the shift of N-I phase transition tem-perature, we studied on calorimetric measurement of nano-fibers and bulk 5CB. Short-range DSC temperature scan for M0, M3, M4, M5, and bulk 5CB is given in Fig.10. DSC data of M1 and M2 are not given because there was no phase transition peak during scanning for mentioned samples. In the 5CB/PAN fibers, despite that it was explained in “Optical properties of nano-fibers” that almost all of the
DMF used as a solvent left the fiber, a tiny amount of residual DMF (solvent) might exist in the fibers. The absence of N-I transition temperature peak in M1 and M2 might probably result from small quantities of the residual DMF that existed
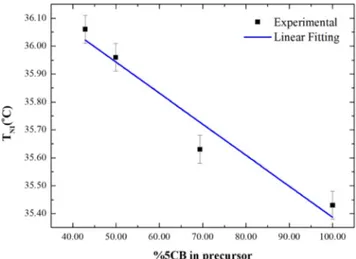
in the nano-fiber. N-I phase transition temperature peak during heating process evidently revealed at 35.43°C for bulk 5CB. We did not detect any phase transition peak for the M0 sam-ple; nevertheless, we gave the scanning data of M0 as a refer-ence line. Relatively small transition peaks were found out for M3, M4, and M5 at 36.06°C, 35.96°C, and 35.63°C, respec-tively. It supports that 5CB might be completely phase-separated and self-ordered in the core of PAN sheath. By increasing 5CB in PAN precursor, N-I phase transition tem-perature almost linearly approached the transition temtem-perature of bulk 5CB (Fig.11). Lagerwall et al. [33] reported that N-I phase transition temperature shifted upper temperatures by a large number. The reason behind was evaluated as the change in composition of the precursor. The causes finding the tran-sition temperature so high might be coaxial electrospinning technique and confinement of LC in the fiber core due to the technique. Another study by Buyuktanir et al. [12] stated no shift in transition temperature in the LC/polymer fiber which was electrospun with a similar technique as we used. The shifting on N-I phase transition temperature that we also ob-served was compatible with phase-separated polymer-dis-persed liquid crystals (PDLC) which had high liquid crystal ratio in LC/polymer mixtures [52–54]. It has been thought that Fig. 9 TGA thermograph for all samples is plotted
Fig. 10 Short-range DSC thermograph of M0 (pure PAN), M3 (42.86%), M4 (49.91%), M5 (69.36%), and also bulk 5CB is plotted. Due to any transition peak not observed, curves of M1 (8.88%) and M2 (19.17%) are not presented
the very weak decrease in N-I phase transition temperature with the increase of 5CB ratio might be due to two different reasons. First, it is because of the growth of globules in the fiber structure. Second, it is because of the existence of a tiny amount of undesired residual solvent (impurity) in fibers. This undesired solvent which was DMF might suppress the N-I phase transition.
Conclusion
In this article, we generated 5CB/PAN composite nano-fibers as a core/sheath structure by using electrospinning technique and investigated optical, structural, and thermal properties of nano-fibers. We expected that 5CB should be self-settled inside electrospun nano-fiber as a core and that PAN should surround the 5CB as a polymer sheath after spinning. This expectation was proved by benefiting the anisotropic properties of 5CB under POM (Fig.2). Also, taking advantage of the ability of liquid crystals that change the polarization direction of the in-cident light, we indicated that 5CB was planarly self-ordered within the core of PAN sheath. Considering the results in Fig.2, 5CB/PAN nano-fibers may be a good candidate in potential applications such as light-modulating devices and optical actu-ators or in different optical device applications. Morphological properties of 5CB/PAN nano-fibers were studied depending on 5CB concentration and applied voltage. As a consequence of concentration-dependent analyses, optical textures taken by POM showed that oval-shaped globules existed along all nano-fibers and they increased in size by increasing the 5CB ratio in the precursor. Similar to the optical results of POM, the size of globules was increased by increasing 5CB concentration in the nano-fibers as seen in SEM images. Additionally, SEM images revealed that when the concentration increased almost above 50% nano-fibers and globules were entangled, so, electrospun nano-fiber became quite non-uniform. As regards to the shape of globules, i.e., aspect ratio, M2 and M3
nano-fibers had the most elongated shape globules depending on LC ratio for 12-kV certain application voltage. In our study, very thin LC/PAN nano-fibers with 170–330 nm thickness were obtained statistically. The thickness of nano-fibers changed be-tween almost 160 nm of M0 and 330 nm of M5. The statisti-cally minimum thickness of LC/polymer was 170 nm which was observed in M3. Applied voltage crucially affected the morphology of nano-fibers; i.e., the size of globules obviously increased as the application voltage was raised. Eighteen-kilovolt application voltage may be regarded as threshold volt-age in order to prevent the globules to get entangling and cov-ering neighbor nano-fibers. Thermal analysis was performed and it gave quite important consequences. TGA results showed that the loss in fiber mass increased from M0 to M5 in the same temperature interval, by adding 5CB to the structure and in-creasing its amount. Moreover, since the existence of a tiny amount of undesired residual solvent in the fiber structure might suppress the N-I phase transition, N-I phase transition temper-ature weakly approached the transition tempertemper-ature of bulk 5CB. Since the existence of the first-order N-I phase transition peak of 5CB was apparently observed starting from 42.86% LC/polymer ratio in DSC study, it is proved that 5CB could be exactly phase-separated in nano-fibers.
Supplementary Information The online version contains supplementary material available athttps://doi.org/10.1007/s00396-021-04842-5. Acknowledgements The authors would like to thank The Center of Research Laboratories, Mugla Sitki Kocman University and also Dr. Nejmettin AVCI for technical support.
Code availability Not applicable.
Author contributions A.E.M. designed research; A.E.M., Ç.K., and Ç.E.D.D. performed research and analyzed data; A.E.M. and Ç.K. wrote the paper.
Data availability The data that support the findings of this study are available from the corresponding author upon reasonable request.
Declarations
Conflict of interest The authors declare no competing interests.
References
1. Demus D, Goodby J, Gray GW et al (1998) Handbook of liquid crystals. Wiley
2. Dicker KT, Ratchford D, Casalini R, Thum MD, Wynne JH, Lundin JG (2020) Surfactant modulated phase transitions of liquid crystals confined in electrospun coaxial fibers. Langmuir 36:7916– 7924.https://doi.org/10.1021/acs.langmuir.0c01066
3. Özden P, Mamuk AE, Avcı N (2019) Investigation of the visco-elastic properties of 4-propoxy-biphenyl-4-carbonitrile. Liq Cryst 46:2190–2200.https://doi.org/10.1080/02678292.2019.1614236
4. Zappone B, Mamuk AE, Gryn I, Arima V, Zizzari A, Bartolino R, Lacaze E, Petschek R (2020) Analogy between periodic patterns in thin smectic liquid crystal films and the intermediate state of super-conductors. Proc Natl Acad Sci U S A 117:17643–17649.https:// doi.org/10.1073/pnas.2000849117
5. Avci N, Hwang SJ (2017) Electrically tunable polarisation-independent blue-phase liquid crystal binary phase grating via phase-separated composite films. Liq Cryst 44:1559–1565.
https://doi.org/10.1080/02678292.2017.1303094
6. Misra AK, Tripathi PK, Pandey KK, Pandey FP, Singh S, Singh A (2019) Electro-optic switching and memory effect in suspension of ferroelectric liquid crystal and iron oxide nanoparticles. Mater Res Express 6.https://doi.org/10.1088/2053-1591/ab42c3
7. Kiani S, Zakerhamidi MS, Tajalli H (2016) Hydrogen bonding intermolecular effect on electro-optical response of doped 6PCH nematic liquid crystal with some azo dyes. Opt Mater (Amst) 55: 121–129.https://doi.org/10.1016/j.optmat.2016.03.019
8. Liang HL, Enz E, Scalia G, Lagerwall J (2011) Liquid crystals in novel geometries prepared by microfluidics and electrospinning. Mol Cryst Liq Cryst 549:69–77. https://doi.org/10.1080/ 15421406.2011.581140
9. Li MH, Keller P, Antonietti M et al (2006) Artificial muscles based on liquid crystal elastomers. Philos Trans R Soc A Math Phys Eng Sci 364:2763–2777.https://doi.org/10.1098/rsta.2006.1853
10. Sharma A, Lagerwall JPF (2018) Electrospun composite liquid crystal elastomer fibers. Materials (Basel) 11:393.https://doi.org/ 10.3390/ma11030393
11. Finkelmann H, Kim ST, Muñoz A, Palffy-Muhoray P, Taheri B (2001) Tunable mirrorless lasing in cholesteric liquid crystalline elastomers. Adv Mater 13:1069–1072
12. Buyuktanir EA, Frey MW, West JL (2010) Self-assembled, opti-cally responsive nematic liquid crystal/polymer core-shell fibers: formation and characterization. Polymer (Guildf) 51:4823–4830.
https://doi.org/10.1016/j.polymer.2010.08.011
13. Büyüktanir EA, Gheorghiu N, West JL, Mitrokhin M, Holter B, Glushchenko A (2006) Field-induced polymer wall formation in a bistable smectic-a liquid crystal display. Appl Phys Lett 89:3–6.
https://doi.org/10.1063/1.2221887
14. Stephenson SW, Johnson DM, Kilburn JI, Mi XD, Rankin CM, Capurso RG (2004) Development of a flexible electronic display using photographic technology. SID Symp Dig Tech Pap 35:774.
https://doi.org/10.1889/1.1821394
15. Guan Y, Agra-Kooijman DM, Fu S, Jákli A, West JL (2019) Responsive liquid-crystal-clad fibers for advanced textiles and wearable sensors. Adv Mater 31:1–5.https://doi.org/10.1002/ adma.201902168
16. Kim DK, Hwang M, Lagerwall JPF (2013) Liquid crystal functionalization of electrospun polymer fibers. J Polym Sci B Polym Phys 51:855–867.https://doi.org/10.1002/polb.23285
17. Enz E, Baumeister U, Lagerwall J (2009) Coaxial electrospinning of liquid crystal-containing poly(vinylpyrrolidone) microfibres. Beilstein J Org Chem 5:1–8.https://doi.org/10.3762/bjoc.5.58
18. Enz E, Lagerwall J (2010) Electrospun microfibres with tempera-ture sensitive iridescence from encapsulated cholesteric liquid crys-tal. J Mater Chem 20:6866–6872. https://doi.org/10.1039/ c0jm01223h
19. Kye Y, Kim C, Lagerwall J (2015) Multifunctional responsive fi-bers produced by dual liquid crystal core electrospinning. J Mater Chem C 3:8979–8985.https://doi.org/10.1039/c5tc01707f
20. Reyes CG, Sharma A, Lagerwall JPF (2016) Non-electronic gas sensors from electrospun mats of liquid crystal core fibres for de-tecting volatile organic compounds at room temperature. Liq Cryst 43:1986–2001.https://doi.org/10.1080/02678292.2016.1212287
21. Luzio A, Canesi EV, Bertarelli C, Caironi M (2014) Electrospun polymer fibers for electronic applications. Materials (Basel) 7:906– 947.https://doi.org/10.3390/ma7020906
22. Han D, Steckl AJ (2013) Triaxial electrospun nanofiber membranes for controlled dual release of functional molecules. ACS Appl Mater Interfaces 5:8241–8245.https://doi.org/10.1021/am402376c
23. Xue J, Xie J, Liu W, Xia Y (2017) Electrospun nanofibers: new concepts, materials, and applications. Acc Chem Res 50:1976– 1987.https://doi.org/10.1021/acs.accounts.7b00218
24. Bertocchi MJ, Ratchford DC, Casalini R, Wynne JH, Lundin JG (2018) Electrospun polymer fibers containing a liquid crystal core: insights into semiflexible confinement. J Phys Chem C 122:16964– 16971.https://doi.org/10.1021/acs.jpcc.8b04668
25. Beevers RB (1964) Dependence of the glass transition temperature of polyacrylonitrile on molecular weight. J Polym Sci A Gen Pap 2: 5257–5265.https://doi.org/10.1002/pol.1964.100021221
26. Li J, Gauzia S, Wu S-T (2004) High temperature-gradient refractive index liquid crystals. Opt Express 12:2002–2010.https://doi.org/ 10.1364/OPEX.12.002002
27. Mashchenko VI, Goponenko AV, Udra CA, et al (2001) Use of polyacrylonitrile as promising material for matrix of liquid crystal composite. In: Belyaev VV, Kompanets in (eds) Advanced display technologies: basic studies of problems in information display. Proceedings of SPIE, Moscow, 4511, pp 127–132.
https://doi.org/10.1117/12.431273
28. Salim NV, Jin X, Razal JM (2019) Polyacrylonitrile/liquid crystal-line graphene oxide composite fibers– towards high performance carbon fiber precursors. Compos Sci Technol 182:107781.https:// doi.org/10.1016/j.compscitech.2019.107781
29. Chino M, Kitano K, Tanaka K, Akiyama R (2008) Electro-optical properties of liquid crystal-polyacrylonitrile fibre composites. Liq Cryst 35:1225–1235.https://doi.org/10.1080/02678290802509418
30. Bogi A, Faetti S (2001) Elastic, dielectric and optical constants of 4′-pentyl-4-cyanobiphenyl. Liq Cryst 28:729–739.https://doi.org/ 10.1080/02678290010021589
31. Rozanski SA, Stannarius R, Groothues H, Kremer F (1996) Dielectric properties of the nematic liquid crystal 4-fi-pentyl-4 ’-cyanobiphenyl in porous membranes. Liq Cryst 20:59–66 32. An N, Xu Q, Xu L, Wu S (2006) Orientation structure and
mechan-ical properties of polyacrylonitrile precursors. Adv Mater Res 11– 12:383–386. https://doi.org/10.4028/www.scientific.net/amr.11-12.383
33. Lagerwall JPF, McCann JT, Formo E et al (2008) Coaxial electrospinning of microfibres with liquid crystal in the core. Chem Commun:5420–5422.https://doi.org/10.1039/b810450f
34. Dierking I (2003) Textures of liquid crystals. Wiley
35. Wang J, Jákli A, West JL (2016) Morphology tuning of electrospun liquid crystal/polymer fibers. ChemPhysChem 17:3080–3085.
https://doi.org/10.1002/cphc.201600430
36. West JL, Wang JR, Jákli A (2016) Airbrushed liquid crystal/ polymer fibers for responsive textiles. Adv Sci Technol 100:43– 49.https://doi.org/10.4028/www.scientific.net/AST.100.43
37. Wang J, Jákli A, West JL (2015) Airbrush formation of liquid crystal/polymer fibers. ChemPhysChem 16:1839–1841.https:// doi.org/10.1002/cphc.201500096
38. Buyuktanir EA, West JL, Frey MW (2011) Optically responsive liquid crystal microfibers for display and nondisplay applications. Emerg Liq Cryst Technol VI 7955:79550P.https://doi.org/10. 1117/12.880076
39. Wu Y, An Q, Yin J, Hua T, Xie H, Li G, Tang H (2008) Liquid crystal fibers produced by using electrospinning technique. Colloid Polym Sci 286:897–905. https://doi.org/10.1007/s00396-008-1845-7
40. Zhang W, Wang Y, Sun C (2007) Characterization on oxidative stabilization of polyacrylonitrile nanofibers prepared by electrospinning. J Polym Res 14:467–474. https://doi.org/10. 1007/s10965-007-9130-x
41. Enculescu M, Evanghelidis A, Busuioc C et al (2014) Dependence on the dye’s type and concentration of the emissive properties of
electrospun dye-doped beaded nanofibers. Dig J Nanomater Biostruct 9:809–816
42. Yao J, Picot OT, Hughes-Brittain NF, Bastiaansen CWM, Peijs T (2016) Electrospinning of reactive mesogens. Eur Polym J 84:642– 651.https://doi.org/10.1016/j.eurpolymj.2016.08.037
43. Lin J-D, Chen C-P, Chen L-J, Chuang YC, Huang SY, Lee CR (2016) Morphological appearances and photo-controllable colora-tion of dye-doped cholesteric liquid crystal/polymer coaxial microfibers fabricated by coaxial electrospinning technique. Opt Express 24:3112–3126.https://doi.org/10.1364/oe.24.003112
44. Cramariuc B, Cramariuc R, Scarlet R, Manea LR, Lupu IG, Cramariuc O (2013) Fiber diameter in electrospinning process. J Electrost 71:189–198.https://doi.org/10.1016/j.elstat.2012.12.018
45. Jacobs V, Anandjiwala RD, Maaza M (2010) The influence of electrospinning parameters on the structural morphology and diam-eter of electrospun nanofibers. J Appl Polym Sci 115:3130–3136.
https://doi.org/10.1002/app.31396
46. Haider A, Haider S, Kang IK (2018) A comprehensive review summarizing the effect of electrospinning parameters and potential applications of nanofibers in biomedical and biotechnology. Arab J Chem 11:1165–1188.https://doi.org/10.1016/j.arabjc.2015.11.015
47. Okutan N, Terzi P, Altay F (2014) Affecting parameters on electrospinning process and characterization of electrospun gelatin nanofibers. Food Hydrocoll 39:19–26.https://doi.org/10.1016/j. foodhyd.2013.12.022
48. Khan WS (2017) Chemical and thermal investigations of electrospun polyacrylonitrile nanofibers incorporated with various nanoscale inclusions. J Therm Eng 3:1375–1390.https://doi.org/ 10.18186/journal-of-thermal-engineering.330180
49. Lee S, Kim J, Ku B-C, Kim J, Joh HI (2012) Structural evolution of polyacrylonitrile fibers in stabilization and carbonization. Adv Chem Eng Sci 02:275–282.https://doi.org/10.4236/aces.2012. 22032
50. Suzuki M, Wilkie CA (1995) The thermal degradation of acrylonitrile-butadiene-styrene terpolymei as studied by TGA/ FTIR. Polym Degrad Stab 47:217–221. https://doi.org/10.1016/ 0141-3910(94)00122-O
51. Aslan S, Bal Altuntaş D, Koçak Ç, Kara Subaşat H (2020) E l e c t r o c h e m i c a l e v a l u a t i o n o f t i t a n i u m ( I V ) o x i d e / polyacrylonitrile electrospun discharged battery coals as supercapacitor electrodes. Electroanalysis 33:120–128.https://doi. org/10.1002/elan.202060239
52. Smith GW, Ventouris GM, West JL (1992) A calorimetric deter-mination of fundamental properties of polymer-dispersed liquid crystals. Mol Cryst Liq Cryst Sci Technol Sect A Mol Cryst Liq Cryst 213:11–30.https://doi.org/10.1080/10587259208028713
53. Smith GW (1990) Study of formation, phase behavior, and microdroplet size of a polyurethane-based polymer-dispersed liq-uid crystal. Mol Cryst Liq Cryst Inc Nonlinear Opt 180:201–222.
https://doi.org/10.1080/00268949008042203
54. Russell GM, Paterson BJA, Imrie CT, Heeks SK (1995) Thermal characterization of polymer-dispersed liquid crystals by differential scanning calorimetry. Chem Mater 7:2185–2189.https://doi.org/ 10.1021/cm00059a029
Publisher’s note Springer Nature remains neutral with regard to jurisdic-tional claims in published maps and institujurisdic-tional affiliations.