https://doi.org/10.1177/0265532219826604 Language Testing 2019, Vol. 36(4) 505 –526 © The Author(s) 2019 Article reuse guidelines: sagepub.com/journals-permissions DOI: 10.1177/0265532219826604 journals.sagepub.com/home/ltj /$1*8$*( 7(67,1*
The impact of pre-task planning
on speaking test performance
for English-medium university
admission
Stefan O’Grady
Bilkent University, TurkeyAbstract
This study investigated the impact of different lengths of pre-task planning time on performance in a test of second language speaking ability for university admission. In the study, 47 Turkish-speaking learners of English took a test of English language Turkish-speaking ability. The participants were divided into two groups according to their language proficiency, which was estimated through a paper-based English placement test. They each completed four monologue tasks: two picture-based narrative tasks and two description tasks. In a balanced design, each test taker was allowed a different length of planning time before responding to each of the four tasks. The four planning conditions were 30 seconds, 1 minute, 5 minutes, and 10 minutes. Trained raters awarded scores to the test takers using an analytic rating scale and a context-specific, binary-choice rating scale, designed specifically for the study. The results of the rater scores were analysed by using a multifaceted Rasch measurement. The impact of pre-task planning on test scores was found to be influenced by four variables: the rating scale; the task type that test takers completed; the length of planning time provided; and the test takers’ levels of proficiency in the second language. Increases in scores were larger on the picture-based narrative tasks than on the two description tasks. The results also revealed a relationship between proficiency and pre-task planning, whereby statistical significance was only reached for the increases in the scores of the lowest-level test takers. Regarding the amount of planning time, the 5-minute planning condition led to the largest overall increases in scores. The research findings offer contributions to the study of pre-task planning and will be of particular interest to institutions seeking to assess the speaking ability of prospective students in English-medium educational environments.
Keywords
Multifaceted Rasch analysis, pre-task planning, rating scales, speaking assessment, Turkey
Corresponding author:
Stefan O’Grady, Bilkent Universitesi, East Campus, Ankara, 06800, Turkey. Email: [email protected]
The current study investigates the impact of pre-task planning time on test scores in an English-medium instruction (EMI) university entrance test in Turkey. It explores the role of the rating scale in this process and examines test scores for interactions between planning time, language proficiency and task type. The widespread adoption of EMI in national contexts such as Turkey has necessitated the development of language tests that provide evidence that prospective students have the English language skills neces-sary to participate in EMI higher education. Such tests typically seek to assess stu-dents’ ability to comprehend and produce the language of instruction in a way that replicates conditions in undergraduate study. To replicate these conditions in tests of speaking, researchers have argued that tests of academic English should account for the degree to which planning is typically permitted before a speaking task (e.g. aca-demic presentations) at the undergraduate level (Skehan, 1998; Wigglesworth & Elder, 2010). It follows that the inclusion of planning may enhance content coverage, in turn leading to informed and defensible decisions regarding prospective students’ ability to study in EMI.
A recent British Council report on the state of EMI in Turkish higher education identi-fies major shortcomings in students’ English speaking skills specifically (British Council, 2015). Instruction in high schools falls short of developing students’ communicative competence in L2 English and the experience of having speaking ability assessed in a high-stakes language test is naturally stressful. It is well recognized that developers of language tests should create conditions that allow test takers to produce their best pos-sible performance: to “bias for the best” (Swain, 1985, p. 42). Research findings in instructed second language acquisition consistently demonstrate that planning before a language task is beneficial to the process of second language speech production (Ellis, 2005; O’Sullivan, 2012; Robinson, 2005; Skehan, 2016). There is thus a compelling argument for planning to be included as part of speaking tests to bias for the best and for test takers to demonstrate their full capabilities: “if we add it, performance improves; remove it or reduce it, and performance worsens” (O’Sullivan, 2012, p. 235).
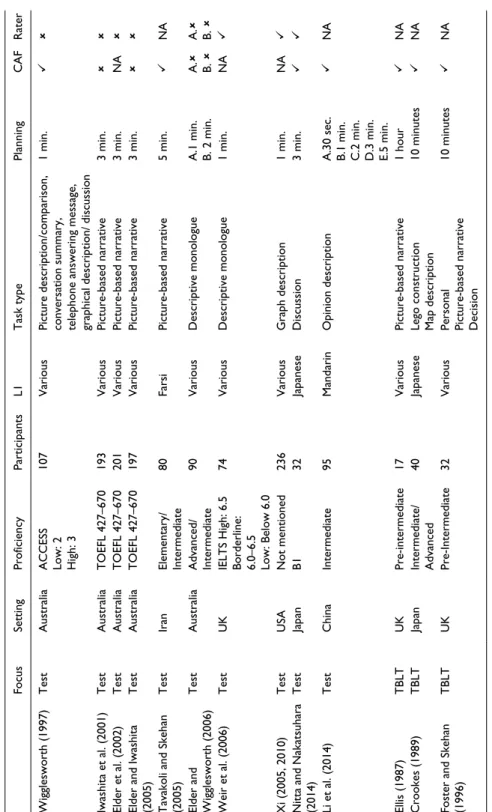
Despite the proposed benefits to test takers, research is yet to provide a clear account of the impact on test scores of including a period of pre-task planning. Empirical research findings in language testing are inconsistent but generally indicate that planning may not substantially influence test results (Elder & Iwashita, 2005; Elder & Wigglesworth, 2006; Wigglesworth, 1997). This is in stark contrast to findings reported in task-based language teaching (TBLT), where pedagogically oriented research has consistently dem-onstrated the impacts of pre-task planning on task performance. An overview of the conflicting findings between the fields is provided in Table 1.
Table 1 reveals that the effect of pre-task planning varies substantially between stud-ies with a TBLT focus and studstud-ies with a language testing focus. Inconsistencstud-ies between the research findings raise the important question of whether it is in an institution’s best interests to increase the time and cost involved in admission tests by including pre-task planning. It is the purpose of this study to answer this question. The following review therefore examines the literature and posits that the effect of pre-task planning may be attributable to four factors: measurement, planning time, task type, and participant profi-ciency in the target language.
Table 1.
The impact of pre-task planning in language testing and TBLT.
Focus Setting Proficiency Participants L1 Task type Planning CAF Rater Wigglesworth (1997) Test Australia
ACCESS Low: 2 High: 3
107
Various
Picture description/comparison, conversation summary, telephone answering message, graphical description/ discussion
1 min. Iwashita et al. (2001) Test Australia TOEFL 427–670 193 Various Picture-based narrative 3 min. Elder et al. (2002) Test Australia TOEFL 427–670 201 Various Picture-based narrative 3 min. NA
Elder and Iwashita (2005)
Test Australia TOEFL 427–670 197 Various Picture-based narrative 3 min.
Tavakoli and Skehan (2005)
Test Iran Elementary/ Intermediate 80 Farsi Picture-based narrative 5 min. NA
Elder and Wigglesworth (2006)
Test Australia Advanced/ Intermediate 90 Various Descriptive monologue
A.1 min. B. 2 min.
A. B. A. B. Weir et al. (2006) Test UK
IELTS High: 6.5 Borderline: 6.0–6.5 Low: Below 6.0
74 Various Descriptive monologue 1 min. NA Xi (2005, 2010) Test USA Not mentioned 236 Various Graph description 1 min. NA
Nitta and Nakatsuhara (2014)
Test Japan B1 32 Japanese Discussion 3 min. Li et al. (2014) Test China Intermediate 95 Mandarin Opinion description
A.30 sec. B.1 min. C.2 min. D.3 min. E.5 min.
NA Ellis (1987) TBLT UK Pre-intermediate 17 Various Picture-based narrative 1 hour NA Crookes (1989) TBLT Japan Intermediate/ Advanced 40 Japanese
Lego construction Map description
10 minutes
NA
Foster and Skehan (1996)
TBLT
UK
Pre-Intermediate
32
Various
Personal Picture-based narrative Decision
10 minutes
NA
Focus Setting Proficiency Participants L1 Task type Planning CAF Rater
Skehan and Foster (1997)
TBLT
UK
Pre-Intermediate
40
Various
Personal Picture-based narrative Decision
10 minutes
NA
Foster and Skehan (1999)
TBLT UK Intermediate 66 Various Discussion 10 minutes NA
Yuan and Ellis (2003)
TBLT China TOEFL 373–520 42 Mandarin Picture-based narrative
10 minutes and online planning
NA
Kawauchi (2005)
TBLT
Japan and UK
Low/High/ Advanced TOEFL 420–610
40 Japanese Picture-based narrative 10 minutes NA Sangarun (2005) TBLT Thailand Intermediate 40 Thai Instruction Argument 15 minutes NA
Skehan and Foster (2005)
TBLT UK Intermediate 61 Various Discussion 10 minutes NA Gilabert (2007) TBLT Spain Low intermediate 48 Spanish Picture-based narrative 10 minutes NA
Mochizuki and Ortega (2008)
TBLT
Japan
STEP results equivalent to TOEFL 360–420
56 Japanese Picture-based narrative 5 minutes NA Guara-Tavares (2009) TBLT Brazil Intermediate 25 Portuguese Picture-based narrative 10 minutes NA
Sasayama and Izumi (2012)
TBLT Japan “generally limited” (2012, p. 29) 23 Japanese Picture-based narrative 5 minutes NA Genc (2012) TBLT Turkey Low intermediate 60 Turkish Picture-based narrative 10 minutes NA
Geng and Ferguson (2013)
TBLT
UK
Upper intermediate
32
Various
Decision making Information exchange
10 minutes NA Nielson (2013) TBLT USA Intermediate 40 Various Picture-based narrative 10 minutes NA
Pang and Skehan (2014)
TBLT
Macao
Low/High intermediate
48
Mandarin and Cantonese
Picture-based narrative
10 minutes
NA
Bui and Huang (2016)
TBLT Hong Kong Upper Intermediate (B2) 58 Cantonese Description 10 minutes NA
* In CAF (complexity, accuracy, and fluency) and rater columns, ticks refer to improvement
s in scores after planning and crosses indicate that planning had no effect.
Table 1.
Literature review
Measurement
In TBLT, the effect of pre-task planning is assessed exclusively with measures of com-plexity, accuracy, and fluency (CAF), an “objective, quantitative and verifiable” measure of L2 proficiency and use (Housen, Kuiken, & Vedder, 2012, p. 2). In contrast, language testing studies typically involve examiners (referred to as raters) and rating scales to assign scores to test takers. The addition of planning time to a language task has pre-dominantly affected CAF measures; planning time effects are more difficult to observe at the test score level.
It follows that gains in CAF may not transfer directly to gains in test scores. This is corroborated by findings reported in Wigglesworth (1997), where planning improved CAF, but made no difference to rater scores. Wigglesworth suggests that this may be for the following reasons:
•
• increases in CAF were too minor to be noticed; •
• increases were not considered sufficiently important to affect scoring; •
• the rating instrument did not draw raters’ attention toward the elements of the speech that improved with planning.
Conclusions regarding the limited impact of planning on test scores have largely been based on scores derived from an analytic scale developed by Iwashita et al. (2001). The scale describes five levels of CAF, encompassing complete beginner and advanced lev-els. Iwashita et al. (2001), Elder et al. (2002) and Elder and Iwashita (2005) assessed test takers after increases in planning time and found no difference in scores on the scale. Nitta and Nakatsuhara (2014) reported minor increases in scores after planning but this may be due to the researchers’ adaptation of the scale to increase the levels from five to nine. In these studies, the range of test-taker proficiency was from 427 to 670 on the TOEFL scale (see Table 1) and the intended range of the scale seems too broad to judge planning time effects: references to complete beginners and advanced levels are largely irrelevant.
It seems clear that some accounts of the impact of planning on test scores may be undermined by mismatches between the language learners under investigation and the nature of the scale. This limitation may be resolved by improving sampling procedures. However, better-designed scales more suitably matched to test-taker populations will also help to capture planning-time effects more precisely. To varying degrees, research-ers have suggested that language use is contextually dependent and scale developresearch-ers should aim to describe language production in specific contexts (Fulcher, 2003; Turner & Upshur, 1996). This can best be achieved with empirical, “data-based” scale develop-ment, whereby the “key features of performance” within a specific test-taking population are observed and referenced in the scale (Fulcher, 2003, p. 92). Turner and Upshur’s (1996, pp. 60–61) EBB method (“empirically derived, requires binary choices by raters, and defines the boundaries between score levels”) is an approach to rating scale develop-ment designed to resolve these issues. Research has shown that the use of EBB scales
leads to high levels of test reliability in terms of inter-rater agreement and high discrimi-nation between test takers’ levels of speaking proficiency (Hirai & Koizumi, 2013; Turner & Upshur, 1996). For current purposes, aligning scale contents to language use in the test taking population means that test scores are more representative of test perfor-mance and meaningful conclusions can be drawn regarding the impact of pre-task plan-ning on the university admission test results.
Planning time
An important distinction between the language testing and TBLT studies shown in Table 1 is the amount of planning time involved before the task. Whereas the most common amount of planning time in TBLT research is 10 minutes, studies with a language testing focus generally involve less planning time, typically from 1 minute to 5 minutes. In cases where comparable tasks have been used in studies with a TBLT focus and studies with a language testing focus (e.g. picture-based narratives: Elder et al., 2002; Elder & Iwashita, 2005; Foster & Skehan, 1996; Iwashita et al., 2001; Nielson, 2013), planning for 10 minutes has proved consistently effective, whereas less planning time has produced con-flicting results. Despite the obvious indication that more planning time seems to lead to better performance, relatively few studies have compared task performance after differ-ent amounts of pre-task planning time.
Elder and Wigglesworth (2006) found no difference between test scores on the speaking section of the IELTS exam after no pre-task planning, under a 1-minute plan-ning condition, and under a 2-minute planplan-ning condition. However, in a questionnaire about their use of pre-task planning time, test takers expressed a preference for plan-ning. The researchers suggest that as 2 minutes did not benefit the test takers in terms of test scores, extending planning time on the IELTS exam beyond 1 minute would be redundant.
Li et al. (2014) used measures of CAF to compare the effect of five periods of plan-ning time: 30 seconds, 1 minute, 2 minutes, 3 minutes, and 5 minutes. Overall, increases in planning time led to progressively more accurate language. The largest gains were made between the 30-second and 1-minute planning conditions, where the number of error free AS-units increased from .48 to .60. Fluency was measured with mean length of run (mean number of syllables supplied between pauses above 0.28 seconds), and speech rate A (syllables per minute) and speech rate B (meaningful syllables per minute). Mean length of run and speech rate A showed incremental increases with every addition of extra planning time up to 3 minutes. The researchers suggest that this is evidence of an optimal planning condition for fluency (i.e. 3 minutes) which, if exceeded causes the effect of pre-task planning to decrease. This conclusion was not confirmed by speech rate B results, which increased with every addition of extra planning time; that is, 5 minutes led to the highest results when only the “meaningful” syllables were calculated (Li et al., 2014, p. 46). Complexity results showed that 30 seconds of planning led to the highest levels of syntactic complexity and 1 minute led to the highest level of lexical complexity. This was a surprising result. The researchers do not explain the results of the lexical analysis. However, based upon the results of previous research findings (e.g. Crookes, 1989; Yuan & Ellis, 2003), Li et al. (2014) suggest that their planning conditions did not
provide sufficient time to raise syntactic complexity, and that 10 minutes of pre-task planning may be necessary for increases in syntactic complexity to occur. Li et al. (2014) demonstrate the potential for planning to affect CAF under test conditions; however, the relationship between CAF measures and human evaluation of language production is questionable (Fulcher, 2015; Pallotti, 2009) and it is not immediately clear from the lit-erature that changes in CAF influence test scores (Wigglesworth, 1997) or correlate with human judgements of L2 ability (Kormos & Denes, 2004; Lambert & Kormos, 2014). The implication of this is that accounts of the impact of planning in TBLT may have little relevance for the field of language testing.
Task type and language proficiency
Planning may facilitate task completion by creating opportunities for language learners to (a) begin cognitive processes that would normally take place during the task (e.g. generat-ing information, retrievgenerat-ing lexis, encodgenerat-ing syntax; Levelt, 1989), and (b) rehearse planned speech. In TBLT, pre-task planning is generally assumed to be most effective for tasks that make substantial demands on limited attentional resources (Ellis, 2009; Robinson, 2005; Skehan, 2009). If relevant cognitive processes can be instigated before the task begins, attentional resources are available to focus on form during the task. One important factor in this process is the degree to which test takers are free to determine the language they produce (Lambert, 2017; Lambert, Philp, & Nakamura, 2017; Skehan, 2009). Picture-based narrative tasks commonly feature in the pre-task planning literature and have the effect of obliging the test taker to discuss specific content and produce specific lexico-grammatical forms (e.g. describing cause-and-effect relationships and relativization to distinguish between characters). Picture-based tasks are likely to make demands on atten-tional resources as the test taker strains to generate requisite language that may be beyond his or her capacity. In contrast, non-picture-based tasks have no such effect, the content is “learner-generated” (Lambert et al., 2017, p. 675) and the test taker is free to determine the forms they use, and perhaps more importantly, the forms they avoid.
A factor of task challenge is the absence of necessary language to discuss obligatory task content; it follows that test takers in possession of this language will naturally find the task less challenging. This indicates that the focus during planning may vary accord-ing to the test taker’s level of language proficiency. Relatively few studies have investi-gated proficiency as an independent variable in the planning research. In Kawauchi (2005), high-level language learners (TOEFL group mean = 545, range = 510–580) benefited more from the opportunity to plan than low-level learners (TOEFL-equivalent group range = 420–480). Kawauchi speculates that although planning did lead to minor gains in accuracy and fluency at lower levels, complex L2 forms had not been acquired and increasing planning made no difference to this aspect of the speech. This observation is supported in the literature (Genc, 2012; Mochizuki & Ortega, 2008; Wigglesworth, 1997). Genc (2012) suggests the limited proficiency participants in her study were preoc-cupied with the generation and organization of ideas during pre-task planning leaving minimal resources available to focus on form. As Wigglesworth (1997, p. 102) suggested, “It may be that at different levels of proficiency candidates undertake different activities during planning time and focus on the different requirements of the task”.
Research questions
The review of literature demonstrated that gaps exist in the research on planning time in testing contexts with respect to the measurement approach taken, the role of proficiency, and the nature of the task. In order to address these gaps, the research questions to be answered in this study are as follows.
1. How does the amount of planning time test takers are provided with impact test scores?
2. Does the impact of planning on test scores vary between an analytic scale and an EBB scale?
3. Does the impact of planning on test scores vary between groups of test takers who have different levels of language proficiency?
4. Does the impact of planning on test scores vary between picture-based narrative tasks and non-picture-based description tasks?
Method
The study involved four independent variables: three within-subjects variables and one between-subjects variable. The within-subjects variables were planning time (four lev-els: 30 seconds, 1 minute, 5 minutes, and 10 minutes), rating scale (two levlev-els: the EBB scale and the analytic scale) and task (four levels: Task 1 and Task 2, non-picture-based description tasks; and Task 3 and Task 4, picture-based narrative tasks). Proficiency was a between-subjects variable and contained two levels (ability levels A, n = 28, and B, n = 12).
Participants
The number of test taker participants was 47 (mean age = 18.9, SD = 1.01). All partici-pants were receiving six hours daily tuition in the English preparatory programme in the university. The participants’ level of exposure to English was restricted to the educa-tional environment and any English they encountered through popular culture. Upon successful completion of the programme, students are able to begin EMI courses in the arts and humanities, social sciences, and technical areas. At the time of the study, over 10,000 students were enrolled in the university.
Sixteen raters, divided into two groups, also took part in the study. The first group contained seven participants and used an EBB scale. Five raters in this group were native speakers of English and two were native speakers of Turkish. Teaching experience ranged from one to 20 years (mean = 10, SD = 5.9). The other group consisted of 10 participants who used an analytic rating scale. Teaching experience ranged from five to 15 years (mean = 10.1, SD = 3.1). Five of the raters were native speakers of English and five were native speakers of Turkish. All rater participants were English instructors in the university’s English preparatory programme, regularly acted as examiners in institu-tional speaking assessment for both formative and summative purposes, and were famil-iar with test tasks and rating procedures. With the exception of rater 1 (R1: the researcher),
who awarded scores using both the EBB scale and the analytic scale, the raters in the two groups were different.
Materials
The speaking test consisted of two non-picture-based description tasks that had been used in the university admission test, but had since been retired and two picture-based narrative descriptive tasks taken from Inoue (2013). The non-picture-based description tasks were as follows:
Task 1: Tell me about something interesting you have recently heard in the news. Task 2: Tell me about an event that has changed your life.
The two narrative tasks (see Appendix 1) depict a pair of children playing a practical joke on a caregiver. In the analysis, the Balloon Task is referred to as Task 3 and the Baby Task is referred to as Task 4. The four tasks were selected to elicit spoken samples involving similar amounts of language but with the distinction that content was either test taker generated or determined by the images (Lambert et al., 2017).
The analytic scale developed by Iwashita et al. (2001) was used with no modifica-tions. The scale contains five levels of CAF (see Appendix 2). The EBB scale (Figure 1) was constructed following procedures outlined in Turner and Upshur (1996). At the ini-tial stage of development, the researcher holistically identified three samples of test per-formance (a high-, a mid- and a low-ability level sample) on each of the four tasks. This
resulted in a number of 12 test samples. During scale construction, the raters rank ordered the 12 test samples through a series of paired comparisons. The raters discussed the ordering of the samples and agreed that the 12 samples represented five broad levels of spoken proficiency. In the next stage, the raters compared samples at the low levels 1 and 2 with samples at the higher levels 3, 4, and 5 to formulate criteria to distinguish the levels: Satisfactory task completion with minimal strain for the listener. Following this, the group compared samples at levels 1 and 2: Sufficient lexis to complete the task despite
disfluency. This process was repeated until the five levels could be identified in the scale
(O’Grady, 2018).
Procedures
To obtain a measure of test taker language proficiency, the Oxford Quick Placement Test (QPT; UCLES, 2001) was administered to the test takers before the speaking test. The QPT is a multiple-choice, paper-based test comprising a series of labelling and cloze activities that test knowledge of lexis and grammatical forms. Although the QPT does not directly measure spoken ability, the test was deemed an appropriate independent measure of language proficiency. The QPT yields both raw test scores, and scores reported in terms of Common European Framework of Reference levels (Council of Europe, 2001). Seven participants did not arrive in time to sit the QPT and went directly to the speaking test (the scores provided to these test takers were excluded from the analysis of proficiency and planning; see Research Question 3). The total number of completed QPT tests was 40. The average score was A2 (mean = 26.9, SD = 4.28, range = 17: A1, 36: B1). The test takers were categorized as low-ability A level (n = 28: A1 n = 3, A2 n = 25) and intermediate ability B level (n = 12).
Based on frequency in the literature, four planning conditions were investigated in the research: 30 seconds, 1 minute, 5 minutes, and 10 minutes (see Table 1). All 47 test tak-ers completed the four tasks under the four planning conditions; to compensate for any influence of task order and planning time order, the sequence of tasks and planning con-ditions was altered for each test taker by clustering participants into groups that com-pleted the same tasks under the same conditions (see Table 2). During the planning stage, participants were provided with a pen and paper and instructed that they could take notes on the task but that their notes would be removed before beginning the task. In addition, participants were informed that they had an unlimited amount of time in which to com-plete the task. The test performances were recorded using the Audacity program (Version 2.0.6; Audacity Team, 2014) and saved as MP3 files.
Given the small number of EBB scale raters and the large pool of samples, multiple matches between the raters were not possible. Therefore, to enhance connectivity between the raters, a scoring session was completed in which raters individually awarded scores to 13 samples of test performance and discussed their grades. Following this, the raters were supplied with 20 different test samples in MP3 format and asked to use the EBB scale to award grades. In addition, Rater 1 awarded grades to each test sample (n = 188) to ensure that each sample was graded once and to yield further overlap between the raters. The 10 analytic scale raters took part in a standardization session in which three test samples that were used during the EBB scale construction were discussed and assessed by the group.
Table 2. Number of participants per task and planning condition.
Task 30 sec. 1 min. 5 min. 10 min.
1 8 17 5 17
2 5 17 8 17
3 17 6 17 7
4 17 7 17 6
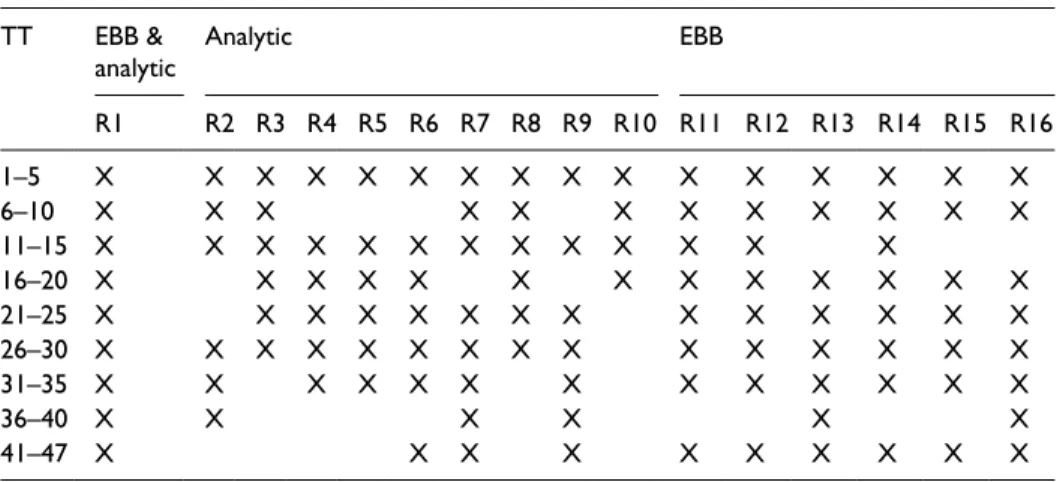
The researcher identified three samples for standardization to represent the high-, mid-, and low-ability levels of the database. Following standardization, the raters were each assigned 20 different samples to grade independently. Following the procedure adopted in the EBB rating process, Rater 1 provided grades for each sample (n = 188). To provide an indication of the degree of overlap between the raters, Table 3 presents the samples that each rater scored.
Analysis
The results of the EBB scale and analytic scale were analysed by using Facets (3.71.4, 18 January 2014, www.winsteps.com), an application of many-facets Rasch measure-ment (MFRM). The facets under investigation were the test taker’s ability, the difficulty of the task, the severity of the rater, the difficulty of the rating scale, the proficiency group to which the test taker belongs (the low-level A group or the higher level B group), and the amount of planning time the test taker was given. The inclusion of a common rater (R 1) allowed for the results of the EBB and analytic scales to share a common measure on the logit scale. The common logit scale provides an overall measure of the impact of pre-task planning impacted on test scores across scales and raters.
Table 3. Overlap between raters. TT EBB &
analytic Analytic EBB
R1 R2 R3 R4 R5 R6 R7 R8 R9 R10 R11 R12 R13 R14 R15 R16 1–5 X X X X X X X X X X X X X X X X 6–10 X X X X X X X X X X X X 11–15 X X X X X X X X X X X X X 16–20 X X X X X X X X X X X X X 21–25 X X X X X X X X X X X X X X 26–30 X X X X X X X X X X X X X X X 31–35 X X X X X X X X X X X X X 36–40 X X X X X X 41–47 X X X X X X X X X X
Logit measure values indicating the effectiveness of each planning condition are sup-plied in the Facets output. Facets also calculates a chi-square test that indicates whether the overall difference in scores awarded under the four planning conditions is statistically significant (Linacre, 2013). However, the chi-square test does not identify precisely where the statistical significance is located (e.g. between the 10-minute condition and every other condition or just between the 10-minute condition and 30-second condition). In order to resolve this problem, Welch’s (1951) t-tests were calculated on the logit values for each planning condition. The analysis used a Bonferroni adjusted alpha level of p = .008 (.05/6) to account for the multiple statistical tests that were completed and effect sizes were calculated using Cohen’s d values (Cohen, 1988). In addition, separate analy-ses were run using Facets to estimate the impact of the planning variable on each task (1, 2, 3, and 4), the two rating scales (EBB and analytic), and the two proficiency levels.
Before presenting the results, it is necessary to evaluate the reliability of the scales and the consistency of the raters. Unlike conventional reliability statistics such as the KR20, which report agreement between raters, Facets reports the degree of replicable difference between raters. Values range from .00, indicating interchangeable raters, to 1.00, indicating very different levels of severity and leniency in the rater population. The reliability statistic was .67, suggesting that the raters demonstrated consistently different levels of severity when awarding scores. Rater consistency was established by examin-ing the rater infit square values provided in the Facets output. The infit mean-square values ranged from .58 to 1.73 (mean = 1.11, SD = .34). Infit values that exceed “2.00” indicate that the scores are unpredictable and distort the measurement (Linacre, 2013, p. 266). According to this standard, rater fit statistics were acceptable and had no distorting effect.
Results
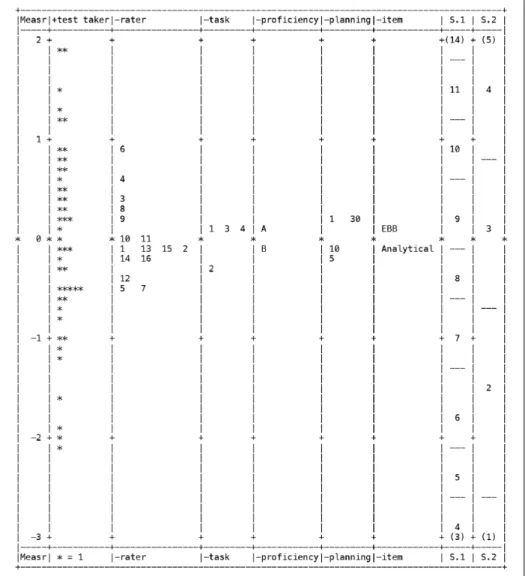
The results of the Facets analysis are presented in the Wright map (see Figure 2) (descrip-tive statistics based on analytic scale and EBB scale scores per task and planning condi-tion are presented in Table 4). The map calibrates the six facets onto the common logit scale, which contains five levels ranging from −3 to 2. The findings are discussed in detail with reference to the MFRM statistics in the following section.
Table 5 presents the measure statistics associated with each planning condition. Negative measure values indicate higher scores on the logit scale and effect sizes for comparisons between planning conditions are reported. Overall, the results demonstrate that the 5-minute planning condition resulted in the highest scores on the tasks used in the present study (−.20), followed by the 10-minute condition (−.12). The difference between having 30 seconds and 1 minute for pre-task planning did not affect the logit measures; the measure value for each condition was .16. Results of the chi-square test indicated that the overall difference between the planning conditions was statistically significant at p < .001.
The results of the Welch’s t-tests demonstrated statistically significant differences
after Bonferroni adjustment (p = .008) between scores under the following planning
conditions: 5 minutes and 1 minute (t(364) = 3.64, p < .001), 5 minutes and 30 seconds (t(329) = 3.64, p < .001), 10 minutes and 1 minute (t(391) = 2.83, p = .005), and 10
Table 4. Descriptive statistics: Scale, task and planning. T1 T2 T3 T4 P30 P1 P5 P10 Analytic 9.03 9.33 8.25 8.43 8.11 8.49 8.92 8.89 (2.13) (1.72) (1.63) (1.68) (1.77) (2.05) (1.46) (1.77) EBB 2.79 3.12 2.89 2.93 2.66 2.86 3.04 3.16 1.10 (.92) (1.06) (.83) (.79) (1.05) (.97) (.85)
T = Task; P = Planning. Standard deviation appears in parentheses below means.
minutes and 30 seconds (t(352) = 2.83, p = .005). Overall, the results indicated that scores were higher when the speaking test included extra pre-task planning time (5
Table 5. Measure and infit statistics and effect sizes between comparisons. Planning
time Measure value Infit mean-square index Fixed (all same) chi-square Cohen’s d
Planning time 30 1 5 10 30 .16 1.22 χ2 = 21.2, p < .001 X 0 .40* .30* 1 .16 1.02 0 X .38* .29* 5 −.20 .78 .40* .38* X .09 10 −.12 1.09 .30* .29* .09 X Analytic Scale 30 .10 1.14 χ2 = 17.3, p < .001 X .14 .40* .26 1 .21 1.04 .14 X .53* .39* 5 −.21 .82 .40* .53* X .14 10 −.10 .99 .26 .39* .14 X EBB Scale 30 .40 1.24 χ2 = 10.5, p = .01 X .23 .46* .43* 1 .08 .69 .23 X .24 .21 5 −.26 1.17 .46* .24 X .02 10 −.23 .75 .43* .21 .02 X Prof A 30 .23 .90 χ2 = 10.3, p = .02 X .19 .38 .40* 1 .05 1.09 .19 X .19 .22 5 −.13 1.24 .38 .19 X .03 10 −.16 .73 .40* .22 .03 X Prof B 30 .01 1.33 χ2 = 3.1, p = .37 X .13 .21 .02 1 .13 .92 .13 X .34 .11 5 −.18 .97 .21 .34 X .22 10 .03 .84 .02 .11 .22 X Task 1 30 −.32 .80 χ2 = 3, p < .001 X .59* .40 .66* 1 .79 1.40 .59* X .99* 1.28* 5 −.27 .89 .40 .99* X .51 10 −.63 1.10 .66* 1.28* .51 X Task 2 30 −.32 1.85 χ2 = 3, p < .001 X 1.08* .02 .09 1 .91 .57 1.08* X 1.16* 1.03* 5 −.34 .86 .02 1.16* X .09 10 −.25 .87 .09 1.03* .09 X Task 3 30 .36 1.33 χ2 = 3, p < .001 X .87 .88* .95* 1 1.20 1.17 .87 X 1.45* 1.55* 5 −.69 .73 .88* 1.45* X .17 10 −.87 1.01 .95* 1.55* .17 X Task 4 30 .07 1.02 χ2 = 3, p < .001 X 1.08* .21 1.45* 1 1.66 1.11 1.08* X .88* 2.49* 5 .37 .98 .21 .88* X 1.64 10 −2.10 .70 1.45* 2.49* 1.64* X
minutes and 10 minutes). The differences in scores between the 5-minute and 10-minute planning conditions did not reach statistical significance.
Scale
To begin with the analytic scale, the 5-minute planning condition resulted in the highest score on the logit scale (−.21 corresponds to 8.83 fair average on the analytic scale), fol-lowed by the 10-minute condition (8.65 fair average), the 30-second condition (8.31 fair average), and the 1-minute condition (8.11 fair average). The result of the chi-square test was significant at p < .001. Welch’s t-tests showed that the differences between scores under the following planning conditions reached statistical significance: 5 minutes and 1 minute (t(199) = 3.71, p < .001), 5 minutes and 30 seconds (t(185) = 2.74, p = .007), and 10 minutes and 1 minute (t(195) = 2.74, p = .007).
Examining the EBB scale results, the 5-minute planning condition resulted in the highest scores (−.26 corresponds to 3.08 fair average on the EBB scale), followed by the 10-minute condition (3.06 fair average), the 1-minute condition (2.92 fair average), and the 30-second condition (2.77 fair average). The result of the chi-square test was statistically significant at p = .01. The Welch’s t-tests demonstrated statistically sig-nificant differences between the scores under the following planning conditions: 5
minutes and 30 seconds (t(142) = 2.75, p = .007), and 10 minutes and 30 seconds
(t(157) = 2.78, p = .006).
Proficiency
To begin with the A level group, the results show that the 10-minute planning condition resulted in the highest scores at −.16 on the logit scale, an increase of .39 over the
30-sec-ond c30-sec-ondition. The result of the chi-square test was statistically significant (χ2 = 10.3, p
= .02). The Welch’s t-tests demonstrated statistically significant differences between the scores awarded under the 10-minute and 30-second conditions (t(193) = 2.76, p = .007). B level proficiency group logit values increased from .13 under the 1-minute planning condition to −.18 under the 5-minute planning condition. However, the chi-square test was not statistically significance.
Task
To begin with the non-picture-based tasks, Task 1 (Tell me about something you have
recently heard in the news) the ordering of the planning conditions by the measure
statis-tics indicated that the 10-minute planning condition resulted in the highest scores. Results of the chi-square test indicate that the impact of planning was statistically significant at
p < .001. The Welch’s t-tests demonstrated that the following differences between the
scores were statistically significant: 10 minutes and 1 minute (t(146)= 7.72, p < .001), 10 minutes and 30 seconds (t(59)= 3.10, p = .003), 5 minutes and 1 minute (t(25)= 3.7,
p < .001), and 1 minute and 30 seconds (t(60)= 2.85, p = .006). On Task 2 (Tell me about
an event that has changed your life), the highest scores were awarded under the 5-minute
condition did lead to higher scores but this was only in relation to the least beneficial, 1-minute planning condition. The chi-square test demonstrates that the impact of plan-ning was statistically significant at p < .001. The Welch’s t-test results demonstrated that the differences between the following scores were statistically significant: 5 minutes and 1 minute (t(73) = 5.48, p < .001), 10 minutes and 1 minute (t(129) = 5.86, p < .001), and 30 seconds and 1 minute (t(24) = 3.93, p < .001).
To evaluate the picture-based task results, on Task 3 (Balloon task), the 10-minute condi-tion recorded a measure value that was higher than the 5-minute condicondi-tion by .18, the 30-second condition by 1.23, and 2.07 logits higher than the 1-minute planning condition. The result of the chi-square test was statistically significant at p < .001. The Welch’s t-test results showed that the differences between the following scores were statistically signifi-cant: 10 minutes and 1 minute (t(45)= 5.41, p < .001), 10 minutes and 30 seconds (t(52)= 4.14, p < .001), 5 minutes and 1 minute (t(32)= 5.79, p < .001), and 5 minutes and 30 sec-onds (t(115)= 4.79, p < .001). Scores on Task 4 (Baby task) demonstrate that the 10-minute planning condition presented a clear advantage over the least beneficial planning condition, 1 minute, where the difference between the measure values was high at 3.76 in logits. The 10-minute condition also resulted in higher scores than the 5-minute condition, a difference of 2.47 logits, and 30-second condition, a difference of 2.17 logits. The results of the chi-square test indicated that the planning impact was statistically significant at p < .001. The results of the Welch’s t-tests demonstrated that the following differences between scores were statistically significant: 10-minute and 5-minute conditions (t(54) = 7.01, p < .001); 10-minute and 1-minute conditions (t(57) = 9.49, p < .001); 10-minute and 30-second conditions (t(52) = 6.26, p < .001); 5-minute and 1-minute conditions (t(61) = 3.84, p < .001); and 1-minute and 30-second conditions (t(59) = 4.82, p < .001).
In order to compare the impact of pre-task planning between the picture-based and non-picture-based tasks, Table 6 reports the most extreme distance in logit measure values between the planning conditions and associated effect sizes. Test takers were most likely to benefit from increased pre-task planning time when completing the picture-based narrative tasks. This is especially true for Task 4 where the 10-minute planning condition made a substantial difference to test taker scores in terms of logit measure values and effect sizes.
Discussion
Research Question 1 asked about the impact of variation in the amount of planning time available to test takers. The results of a many-facets Rasch analysis demonstrated that vari-ation in planning time did influence test scores but the effect was relatively minor. The logit scale contained five logit levels and the maximum difference between the planning
Table 6. Largest differences between the planning conditions by task.
Difference in logits Cohen’s d
Non-picture-based tasks Task 1 10 minutes > 1.42 1 minute 1.28
Task 2 5 minutes > 1.25 1 minute 1.16
Picture-based tasks Task 3 10 minutes > 2.07 1 minute 1.55
conditions was .36 of a logit on the scale. This difference was between scores awarded under the 5-minute planning condition and scores awarded under the 1-minute, and 30-second planning conditions. In both cases the effect size was small to moderate: .38 and .40 respec-tively (Cohen, 1988).
The relatively limited impact of the planning variable contradicts many of the accounts of planning in the literature and thus contributes to the debate regarding the disparity between measures of CAF and human appraisals of language ability (Fulcher, 2015; Kormos & Denes, 2004; Lambert & Kormos, 2014; Pallotti, 2009; Wigglesworth, 1997). Specifically, researchers claim that gains in CAF after planning are indicative of the poten-tial for planning to have a meaningful impact on test results (Li et al., 2014; Tavakoli & Skehan, 2005). However, the results of the current study indicate that the benefits that extra planning may bestow do not lead to important differences in test scores on an analytic scale comprising levels of CAF or a rater-generated, context-specific EBB scale. Ultimately, this finding suggests that accounts of planning in TBLT, based exclusively on measures of CAF, have little immediate relevance for language testing. In this context, gains in CAF after planning may not be sufficiently salient to manifest at the rating scale score level. This is not to argue that speaking tests should not involve planning. In developing a validity argument for the use of the test, it is important to show that test tasks replicate, as much as possible in an assessment context, the cognitive processes that test takers engage when completing comparable tasks in the target situation (O’Sullivan, 2016). Producing speech from a plan is a different process from producing speech spontaneously (Ellis, 2009; Robinson, 2005; Skehan, 2009) and test tasks that are designed to represent EMI contexts that typically involve planning (e.g. academic presentations) need to reflect this.
Research Question 2 concerned the influence of the rating scale in measuring the planning effect. Wigglesworth (1997) discusses the possibility that variation in planning time did not impact the results of her study owing to mismatches between the rating scale content, the changes that planning instigated, and the raters’ own internal criteria. This study attempted to address this issue with the use of an assessor-oriented, EBB scale that was intended to reflect the raters’ own criteria when awarding scores. Comparisons between the analytic scale (describing five levels of complexity, accuracy and fluency corresponding to measures of CAF) and EBB scale results indicated that the 5-minute planning condition resulted in the highest fair average values on both scales (although the difference between scores awarded under the 10-minute and 5-minute conditions did not reach statistical significance). Furthermore, the effect size of the planning variable was comparable on both scales, although there is an indication that planning affected scores on the analytic scale to a larger extent.
The absence of a substantial difference in test scores on the EBB scale may be due to the binary nature of the scale. When raters were required to make binary, holistic distinc-tions, rather than identify a level of competency in one category on the analytic scale, planning may have had little effect on the decision. For example, using the analytic scale a score of 2 on the fluency category indicates that a test taker was less fluent than one who attained a score of 3. In contrast, on the EBB scale, the distinction between a score of 2 and a score of 3 involved a more holistic decision about whether the task had been completed successfully. This is a major difference and the impact of planning needed to be substantial to affect raters’ decisions on this aspect of the EBB scale.
Turning to Research Question 3 and the influence of proficiency, the test-taking popu-lation that this study samples does not have vast experience of using the L2 to
communicate and generally struggles to produce spoken English, especially in high-stakes tests. Evidence of this was provided in the scores on the rating scales, which were particu-larly low. In the literature review, the suggestion was made that in order for test takers to benefit from the opportunity to plan their speech at length, sufficient knowledge of the L2 needed to be available to access and generate task relevant language forms. This implies that advanced-level test takers benefit most from the opportunity to plan because they have access to a wider range of language than low-level test takers (Kawauchi, 2005). However, in the current study the low-level group benefitted from the extra planning time. Presumably, narrating a series of pictures and describing personal experiences in the L2 poses challenges at lower levels because test takers do not have access to relevant lan-guage to discuss task content. The low-ability test takers seem to have used the planning time to compensate for limitations in their language knowledge to complete the tasks. At the higher level, there may be less need to engage in planning because relevant language forms may be more available. This claim is supported by three studies that used the same analytic rating scale (Elder et al., 2002; Elder & Iwashita, 2005; Iwashita et al., 2001). In these studies, the average level of L2 ability was substantially higher than the current test taking population and planning had no impact on test scores. In short, extra planning time seems to benefit low-ability speakers. Second language speaking tests developed specifi-cally for low-level test takers may therefore involve a period of planning to meet Swain’s (1985, p. 42) requirement that tests should “bias for the best” performance.
Research Question 4 asked if the planning effect would be different on different task types. Results showed that planning for the picture-based tasks had more of an impact on test scores than on the non-picture-based tasks, where test takers were free to determine the content they discussed. This finding broadly corresponds to claims made by Skehan (2009) that narrating a series of images that contain obligatory content poses specific difficulties during speech formulation. Skehan (2009, p. 524) referred to this obligatory content as “the non-negotiability of the task”. He stated “a narrative is necessarily input-driven, and unforgiving in what needs to be covered” (2009, p. 517). This has implica-tions for the test taker, who must access suitable lexis to meet the task demands: picture-based “narratives seem to push second language speakers … into using less fre-quent lexis” (2009, p. 517). The results of this study indicate that pre-task planning may support performance on tasks that feature obligatory content with the effect that test takers achieve higher scores than are observed when planning is unavailable.
Scores on the picture-based tasks and Task 1 (Tell me about something interesting you
have recently heard in the news) increased most substantially after test takers planned for 10
minutes, whereas scores on Task 2 (Tell me about an event that has changed your life) were highest after test takers planned for 5 minutes. To account for this finding, Iwashita et al. (2001) propose that planning affects speech production most clearly when test takers are provided with long periods of time to plan (e.g. 10 minutes) for tasks that are complicated and elaborate. The findings of the current study support this claim. When test takers dis-cussed a personal topic that was familiar there may have been little need to engage in exten-sive planning. The task information may have been well rehearsed and the test taker may have chosen to describe an event that required familiar language. In their seminal paper, Foster and Skehan (1996) compared the impact of planning on three tasks (a personal infor-mation task, a picture-based narrative, and a decision-making task) and found that the task
involving personal information recorded the highest CAF results, and was least impacted by the addition of extra planning time. Findings reported in Lambert et al. (2017) indicate that language learners also engage more with tasks and provide more elaboration when given the chance to generate their own content. In light of the current findings, planning seems to have a limited impact when test takers discuss personal information and may be better suited for tests that require test takers to discuss topics that are unfamiliar.
A number of limitations need to be acknowledged. First, although there was sufficient connectivity between the raters to run the MFRM, the study had to rely on one rater (R1) to supply a substantial number of scores. Ultimately, this reduces the generalizability of the findings, as the results may not be representative of the wider population of raters in the institution. Planning and proficiency were included as facets in the MFRM model and thus contributed to the overall measurement; however, an alternative approach might have involved treating planning and proficiency as dummy facets with the effect that interactions could have been investigated without impacting on measure and fit statistics (Linacre, 2013). The findings rest primarily on the decision to include planning and pro-ficiency as facets in the model. There are also limitations regarding the reliability of the Oxford Quick Placement Test (QPT). It was important to obtain an independent measure of language proficiency to compare test takers in the MFRM, but the QPT only provides a rough indication of ability and there may have been some overlap between the A and B levels. Additionally, in the absence of data about what participants did with the planning time, questions remain about the reason for the minimal impact of planning on test scores. The study investigated the impact of variation in planning time, proficiency, and task type, but the results may equally reflect inadequate planning by the test takers.
Conclusion
This study sought to determine the impact of variation in planning time in an admission test for an English-medium university in Turkey. Planning before a second language task is widely regarded as advantageous for the speech production process (Ellis, 2005, 2009; Robinson, 2005; Skehan, 2016). However, in language testing contexts the evi-dence for the benefits of pre-task planning is limited (Elder & Iwashita, 2005; Elder & Wigglesworth, 2006; Nitta & Nakatsuhara, 2014; Wigglesworth, 1997). The overall impact of pre-task planning on test scores was minimal. However, on the picture-based tasks, planning did seem to make an important difference to test scores. The inclusion of extra planning time before these language tasks may therefore constitute a way for test developers to bias towards the best performance (Swain, 1985). However, an impor-tant caveat is that language proficiency is a key variable. Test developers should account for the potential interaction between test-taker proficiency, task type and pre-task plan-ning time by trialling different amounts of planplan-ning time on different tasks with repre-sentative members of the test-taking population before including planning in their language tests.
Declaration of Conflicting Interests
The author(s) declared no potential conflicts of interest with respect to the research, authorship, and/or publication of this article.
Funding
The author(s) received no financial support for the research, authorship, and/or publication of this article.
Supplemental material
Supplemental material for this article is available online. References
Audacity Team (2014). Audacity(R): Free Audio Editor and Recorder (Version 2.0.6) [Computer program]. Retrieved from http://audacity.sourceforge.net/.
British Council (2015). The state of English in higher education in Turkey. Retrieved from www. britishcouncil.org.tr/sites/default/files/he_baseline_study_book_web_-_son.pdf.
Bui, G., & Huang, Z. (2016). L2 fluency as influenced by content familiarity and planning: Performance, measurement and pedagogy. Language Teaching Research. Advance online publication. doi:10.1177/1362168816656650.
Cohen, J. (1988). Statistical power analysis for the behavioral sciences. Hillsdale, NJ: Lawrence Erlbaum.
Council of Europe. (2001). Common European Framework of Reference for Languages: Learning,
teaching, assessment. Cambridge: Cambridge University Press.
Crookes, G. (1989). Planning and interlanguage variation. Studies in Second Language Acquisition,
11(4), 367–383.
Elder, C., & Iwashita, N. (2005). Planning for test performance: Does it make a difference? In R. Ellis (Ed.), Planning and task performance in a second language (pp. 219–239). Amsterdam: John Benjamins.
Elder, C., Iwashita, N., & McNamara, T. (2002). Estimating the difficulty of oral proficiency tasks: What does the test-taker have to offer? Language Testing, 19(4), 347–368.
Elder, C., & Wigglesworth, G. (2006). An investigation of the effectiveness and validity of plan-ning time in part 2 of the IELTS speaking test. IELTS Research Reports (Vol. 6, pp. 1–28). Canberra: IELTS Australia and British Council.
Ellis, R. (1987). Interlanguage variability in narrative discourse: Styleshifting in the use of the past tense. Studies in Second Language Acquisition, 9, 1–20.
Ellis, R. (2005). Planning and task based performance: Theory and research. In R. Ellis (Ed.),
Planning and task performance in a second language (pp. 3–36). Amsterdam: John Benjamins.
Ellis, R. (2009). The differential effects of three types of task planning on the fluency, complexity and accuracy in L2 oral production. Applied Linguistics, 30(4), 474–509.
Foster, P., & Skehan, P. (1996). The influence of planning time on performance in task-based learning. Studies in Second Language Acquisition, 18, 299–234.
Foster, P., & Skehan, P. (1999). The influence of source of planning and focus of planning on task-based performance. Language Teaching Research, 3, 215–247.
Fulcher, G. (2003). Testing second language speaking. London: Pearson.
Fulcher, G. (2015). Re-examining language testing: A philosophical and social inquiry. London: Routledge.
Genc, Z. (2012). Effects of strategic planning on the accuracy of oral and written tasks in the performance of Turkish EFL learners. In A. Shehadeh & C. Coombe (Eds.), Task-based
language teaching in foreign language contexts research and implementation (pp. 67–89).
Amsterdam: John Benjamins.
Geng, X., & Ferguson, G. (2013). Strategic planning in task based language teaching: The effects of participatory structure and task type. System, 41, 982–993.
Gilabert, R. (2007). The simultaneous manipulation of task complexity along planning time and (+/− here and now): Effects on oral production. In M. Mayo (Ed.), Investigating tasks in
formal language learning (pp. 44–68). Bristol: Multilingual Matters.
Guara-Tavares, M. (2009). The relationship among pre-task planning, working memory capacity, and L2 speech performance: A pilot study. Linguagem & Ensino, 12(1), 165–194.
Hirai, A., & Koizumi, R. (2013). Validation of empirically derived rating scales for a story retell-ing task. Language Assessment Quarterly, 10, 398–422.
Housen, A., Kuiken, F., & Vedder, I. (2012). Complexity, accuracy and fluency: Definitions, measurement and research. In A. Housen, F. Kuiken & I. Vedder (Eds.), Dimensions of L2
performance and proficiency (pp. 1–20). Amsterdam: John Benjamins.
Inoue, C. (2013). Task equivalence in speaking tasks. Berlin: Peter Lang.
Iwashita, N., McNamara, T., & Elder, C. (2001). Can we predict task difficulty in an oral profi-ciency test? Exploring the potential of an information-processing approach to task design.
Language Learning, 51(3), 401–436.
Kawauchi, C. (2005). The effects of strategic planning on the oral narratives of learners with low and high intermediate L2 proficiency. In R. Ellis (Ed.), Planning and task performance in a
second language (pp. 143–165). Amsterdam: John Benjamins.
Kormos, J., & Denes, M. (2004). Exploring measures and perceptions of fluency in speech of second language learners. System, 32, 145–164.
Lambert, C. (2017). Tasks, affect and second language performance. Language Teaching Research,
21(6), 657–664.
Lambert, C., & Kormos, J. (2014). Complexity, accuracy and fluency in task-based research: Toward more developmentally based measures of second language acquisition. Applied
Linguistics, 35(5), 607–614.
Lambert, C., Philp, J., & Nakamura, S. (2017). Learner-generated content and engagement in sec-ond language task performance. Language Teaching Research, 21(6), 665–680.
Levelt, M. (1989). Speaking: From intention to articulation. Cambridge: MIT Press.
Li, L., Chen, J., & Sun, L. (2014). The effects of different lengths of pretask planning time on L2 learners’ oral test performance. TESOL Quarterly, 49(1), 38–66.
Linacre, J. (2013). A user’s guide to FACETS Rasch-model computer programs. Retrieved from www.winsteps.com/winman/copyright.htm.
Mochizuki, N., & Ortega, L. (2008). Balancing communication and grammar in beginning-level foreign language classrooms: A study of guided planning and relativisation. Language
Teaching Research, 12(1), 11–37.
Nielson, K. (2013). Can planning time compensate for individual differences in working memory capacity? Language Teaching Research, 18(3), 272–293.
Nitta, R., & Nakatsuhara, F. (2014). A multifaceted approach to investigating pre-task planning effects on oral task performance. Language Testing, 31(2), 147–175.
O’Grady, S. (2018). Investigating the use of an empirically derived, binary-choice and boundary- definition (EBB) scale for the assessment of English language spoken proficiency. In S. Hidri (Ed.), Revisiting the assessment of second language abilities: From theory to practice (pp. 49–64). Springer: Cham, Switzerland.
O’Sullivan, B. (2012). Assessing speaking. In C. Coombe, P. Davidson, B. O’Sullivan & S. Stoynoff (Eds.), The Cambridge guide to second language assessment (pp. 234–247). Cambridge: Cambridge University Press.
O’Sulivan, B. (2016). Validity: What is it and who is it for? In Y. Leung (Ed.), Epoch
mak-ing in English language teachmak-ing and learnmak-ing: Evolution, innovation, and revolution (pp.
201–222). Taipei: Crane Publishing.
Pallotti, G. (2009). CAF: Defining, refining and differentiating constructs. Applied Linguistics,
Pang, F., & Skehan, P. (2014). Self-reported planning behaviour and second language reporting in narrative retelling. In P. Skehan (Ed.), Processing perspectives on task performance (pp. 95–128). Amsterdam: John Benjamins.
Robinson, P. (2005). Cognitive complexity and task sequencing: Studies in a componential framework for second language task design. International Review of Applied Linguistics in
Language Teaching, 43, 1–32.
Sangarun, J. (2005). The effects of focusing on meaning and form in strategic planning. In R. Ellis (Ed.), Planning and task performance in a second language (pp. 111–143). Amsterdam: John Benjamins.
Sasayama, S., & Izumi, S. (2012). Effects of task complexity and pre-task planning on Japanese EFL learners’ oral production. In A. Shehadeh & C. Coombe (Eds.), Task-based language teaching in
foreign language contexts research and implementation (pp. 23–43). Amsterdam: John Benjamins.
Skehan, P. (1998). A cognitive approach to language learning. Oxford: Oxford University Press. Skehan, P. (2009). Modelling second language performance: Integrating complexity, accuracy,
fluency and lexis. Applied Linguistics, 30(4), 510–532.
Skehan, P. (2016). Tasks versus conditions: Two perspectives on task research and their implica-tions for pedagogy. Annual Review of Applied Linguistics, 36, 34–49.
Skehan, P., & Foster, P. (1997). Task type and processing conditions as influences on foreign language performance. Language Teaching Research, 1(3), 185–211.
Skehan, P., & Foster, P. (2005). Strategic and on-line planning: The influence of surprise infor-mation and task time on second language performance. In R. Ellis (Ed.), Planning and
task-performance in a second language (pp. 193–219). Amsterdam: John Benjamins.
Swain, M. (1985). Large scale communicative testing: A case study. In Y. Lee, C. Fok, R. Lord & G. Low (Eds.), New directions in language testing (pp. 35–46). Hong Kong: Pergamon Press. Tavakoli, P., & Skehan, P. (2005). Strategic planning, task structure and performance testing. In R.
Ellis (Ed.), Planning and task performance in a second language (pp. 239–277). Amsterdam: John Benjamins.
Turner, C., & Upshur, J. (1996). Developing rating scales for the assessment of second language performance. Australian Review of Applied Linguistics, 13, 55–79.
UCLES. (2001). Quick Placement Test. Oxford: Oxford University Press.
Weir, C., O’Sullivan, B., & Horai, T. (2006). Exploring difficulty in speaking tasks: An intra-task perspective. IELTS Research Reports (Vol. 6, pp. 1–42). Canberra: IELTS Australia and British Council.
Welch, B. (1951). On the comparison of several mean values: An alternative approach. Biometrika,
38(3/4), 330–336.
Wigglesworth, G. (1997). An investigation of planning time and proficiency level on oral test discourse. Language Testing, 14(1), 85–106.
Wigglesworth, G., & Elder, C. (2010). An investigation of the effectiveness and validity of plan-ning time in speaking test tasks. Language Assessment Quarterly, 7(1), 1–24.
Xi, X. (2005). Do visual chunks and planning impact the overall quality of oral descriptions of graphs? Language Testing, 22(4), 463–508.
Xi, X. (2010). Aspects of performance on line graph description tasks: Influenced by graph famili-arity and different task features. Language Testing, 27(1), 73–100.
Yuan, F., & Ellis, R. (2003). The effects on pre-task planning and on-line planning on fluency, complexity and accuracy in L2 monologic oral production. Applied Linguistics, 21(1), 1–27.