ROLE OF MACROECONOMIC DEVELOPMENTS ON TOTAL FACTOR PRODUCTIVITY IN THE TURKISH ECONOMY
(1972-2003) A Master’s Thesis by RAİF CAN Department of Economics Bilkent University Ankara January 2006
ROLE OF MACROECONOMIC DEVELOPMENTS ON TOTAL FACTOR PRODUCTIVITY IN THE TURKISH ECONOMY
(1972-2003)
The Institute of Economics and Social Sciences of
Bilkent University
by
RAİF CAN
In Partial Fulfilment of the Requirements for the Degree of MASTER OF ARTS
in
THE DEPARTMENT OF ECONOMICS BİLKENT UNIVERSITY
ANKARA January 2006
I certify that I have read this thesis and have found that it is fully adequate, in scope and in quality, as a thesis for the degree of Master of Arts in Economics.
--- Prof. Erinç Yeldan Supervisor
I certify that I have read this thesis and have found that it is fully adequate, in scope and in quality, as a thesis for the degree of Master of Arts in Economics.
--- Assist. Prof. Ümit Özlale Examining Committee Member
I certify that I have read this thesis and have found that it is fully adequate, in scope and in quality, as a thesis for the degree of Master of Arts in Economics.
--- Assist. Prof. Ebru Voyvoda Examining Committee Member
Approval of the Institute of Economics and Social Sciences
--- Prof. Erdal Erel Director
ABSTRACT
ROLE OF MACROECONOMIC DEVELOPMENTS ON TOTAL FACTOR PRODUCTIVITY IN THE TURKISH ECONOMY
(1972-2003)
Can, Raif
M.A., Department of Economics Supervisor: Prof. Dr. Erinç Yeldan
January 2006
In this thesis, by using regression analysis method, I investigated the role of macroeconomic variables on Total Factor Productivity (TFP) growth in the Turkish economy over the period of 1972-2003. Empirical findings of this study are that instabilities in foreign exchange and real exchange rate appreciation has negative role on TFP growth, on the other hand, growth of export of goods, imports of intermediate goods as a share of GDP, growth of public real infrastructure investments and current account deficit as a share of GDP have positive impacts on TFP growth. Inflation rates, interest rates, public sector borrowing requirement and foreign direct investment inflow insignificant variables to determine TFP growth in the Turkish economy. Also, in this thesis, the Turkish economy is investigated in the context of import-substituting industrialization period, export-led growth period and post-financial liberalization period.
ÖZET
TÜRKİYE EKONOMİSİNDE MAKROEKONOMİK GELİŞMELERİN TOPLAM FAKTÖR VERİMLİLİĞİ ÜZERİNDEKİ ROLÜ
(1972-2003)
Can, Raif
Yüksek Lisans, İktisat Bölümü Tez Yöneticisi: Prof. Dr. Erinç Yeldan
Ocak 2006
Bu tezde, regresyon analiz yöntemini kullanarak, 1972-2003 dönemi için Türkiye ekonomisinde, makroekonomik değişkenlerin Toplam Faktör Verimliliği (TFV) büyümesi üzerindeki rolünü inceledim. Çalışmanın ampirik bulgularına göre döviz kurundaki istikrarsızlık ve reel kurun değerlenmesi TFV büyümesi üzerinde negatif bir role sahipken, mal ihracatındaki artış, ara malı ithalatının GSYİH’ya oranı, kamu altyapı yatırımlarındaki reel artış ve cari işlemler açığının GSYİH’ya oranı TFV büyümesi üzerinde positif etkiye sahiptir. Enflasyon oranı, faiz oranı, kamu kesimi borçlanma gereği ve doğrudan yabancı sermaye girişi Türkiye ekonomisinde TFV büyümesini belirlemede anlamsız bulunmuştur. Bu çalışmada ayrıca Türkiye ekonomisi, ithal ikameci sanayileşme, ihracata dayalı büyüme ve finansal serbestleşme sonrası dönemler kapsamında incelenmiştir.
Anahtar Kelimeler: TFV, Makroekonomik İstikrarsızlık, Türkiye Ekonomisi, Büyüme
ACKNOWLEDGMENTS
I would like to express my gratitude to my supervisor, Prof. Erinç Yeldan, for his helpful guidance during this study. I have been fortunate to have the opportunity of being under his supervision.
I would like to thank Asst. Prof. Ebru Voyvoda and Asst. Prof. Ümit Özlale for reading my thesis and for their innovative comments.
I would like to thank Cengiz Cihan and other colleagues in SPO for their valuable guidance and support during my thesis.
Last, but not least, I would like to thank my parents, my sisters and Alper, Başar, Bekir, Erbay, Kadir and Mustafa for all their endless support, encouragement and being near me.
TABLE OF CONTENTS
ABSTRACT... iii
ÖZET... iv
ACKNOWLEDGMENTS... v
TABLE OF CONTENTS... vi
LIST OF TABLES... viii
LIST OF FIGURES... ix
CHAPTER 1: INTRODUCTION... 1
CHAPTER 2: LITERATURE REVIEW... 3
2.1 Openness and TFP... 6
2.2 FDI and TFP... 10
2.3 Macroeconomic (In)Stability and TFP... 13
CHAPTER 3: DEVELOPMENTS IN THE TURKISH ECONOMY OVER THE PERIOD OF 1972-2003 ... 19
3.1 Inward-Oriented Import Substituting Industrialization Period (1972-1980)... 24
3.2 Export Led Growth Period (1981-1988)... 30
3.3 Post-Financial liberalization Period (1989-2003) ... 35
4.1 Estimation Method of TFP... 45
4.2 Data Set... 46
4.2.1 Total Value Added... 46
4.2.2 Capital Stock... 47
4.2.2 Labor... 47
4.2 Estimation of TFP... 47
CHAPTER 5: ROLE OF MACROECONOMIC VARIABLES ON TFP GROWTH... 51
5.1 Discussion of Variables... 51
5.1.1 Macroeconomic Instability Variables... 52
5.1.2 Trade-Related Variables... 53
5.1.3 Other Variables... 56
5.2 Data Set... 57
5.3 Model Specification and Estimation... 60
5.3.1 Model Specification... 60
5.3.1 Estimation Results and Discussion... 61
CHAPTER 6: CONCLUSION... 68
BIBLIOGRAPHY... 72
APPENDICES A. DATA SET USED IN THE CALCULATION OF TFP ... 78
B. DATA SET USED IN THE TFP REGRESSION... 79
C.
SCATTER DIAGRAMS OF TFP AND EXPLANATORY VARIABLES... 84LIST OF TABLES
1. Economic Phases of the Turkish Economic History between 1972-2003... 22
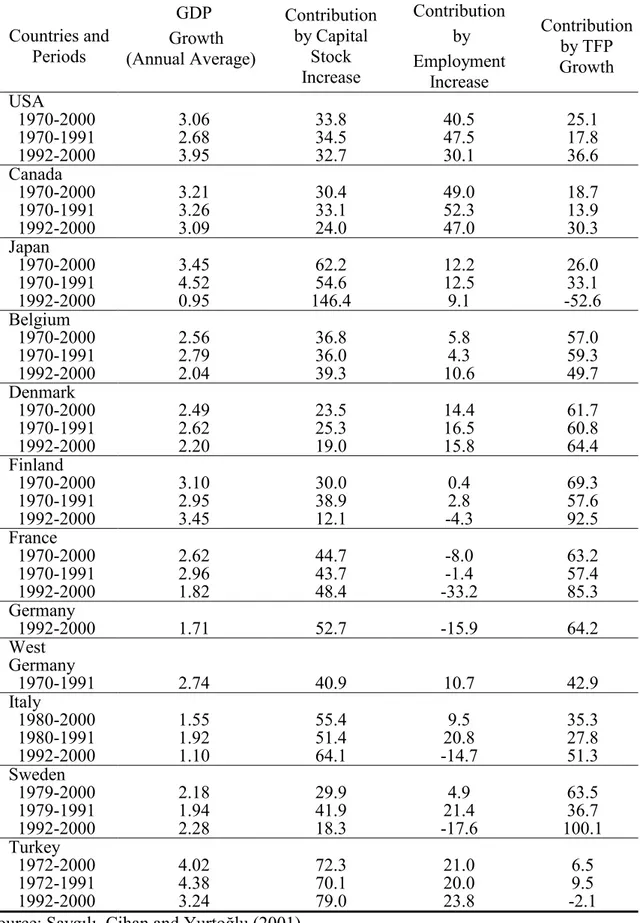
2. Sources of Growth in Some OECD Countries... 27
3. Per-Capita Income for Some Developed Countries of OECD and Turkey in 2003... 28
4. Results of the Production Function Estimation... 48
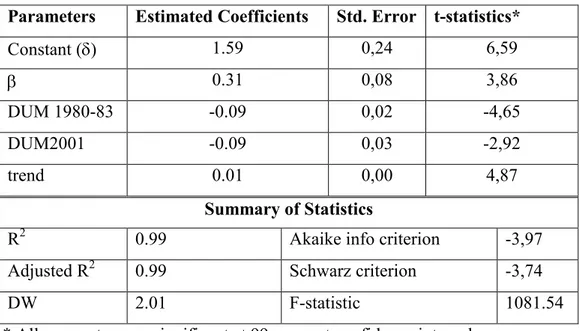
5. Estimation Results of Simple Log-Linear Regression... 61
6. Estimation Results of Multiple Log-Linear Regressions (1)... 62
LIST OF FIGURES
1. Cyclical Movement of Output Around Its Historical Path... 20
2. Private Investments by Sectors as a Ratio of GDP... 25
3. Public Investments by Sectors as a Ratio of GDP... 26
4. Ratio of Interest Payments from Consolidated Budget to Tax Revenues... 37
5. Distribution of Tax Revenues in Turkish Economy... 38
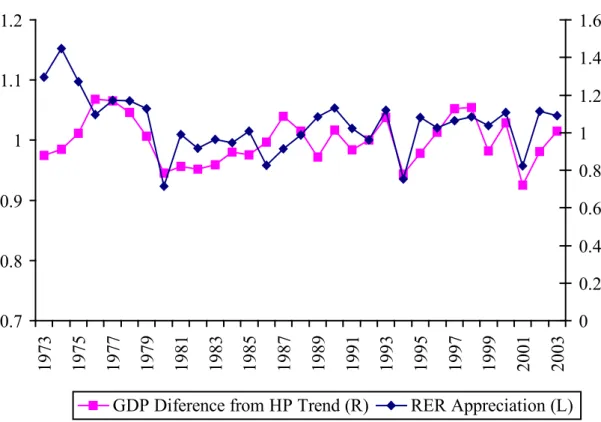
6. GDP Volatility versus Real Exchange Rate Appreciation... 44
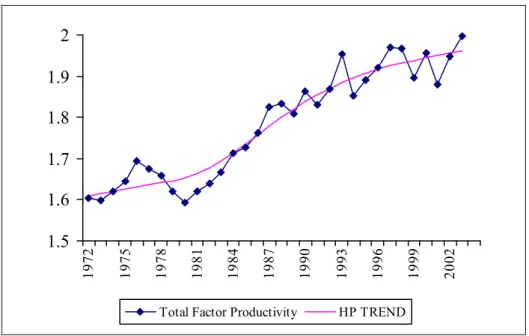
7. Total Factor Productivity of Turkey... 49
8. Developments in TFP and Real Effective Exchange Rates (RER)... 54
9. Developments in TFP and Real Public Infrastructure Investments... 57
CHAPTER 1
INTRODUCTION
Per-capita income gap between Turkey and developed countries is quite large. This gap between developed countries and Turkey shall be investigated in the context of differences in physical capital, labor and total factor productivity (TFP)1. For the Turkish economy, low level of TFP is regarded as a one of the significant factor explaining why Turkish economy fell behind the developed economies (see Table 3.2 and Table 3.3 for country comparisons). In this thesis, I will try to investigate macroeconomic factors to explain the developments in TFP growth performance for the Turkish economy. In Fischer’s (1993) study, for example, it was shown that instabilities in the macroeconomic environment were reported as the major reasons for persistent low level of TFP growth in low and middle-income countries and thus for overall growth performance. However, as it is illustrated in that study for some group of countries, stable macroeconomic environment is a necessary but not sufficient condition to attain sustainable growth. Although many countries of the franc zone in Africa have satisfied the conditions for stable
1
In this study, TFP is defined as the factor contributing to output other than traditional inputs of capital stock and labor. Effectiveness of inputs, technology and other unobserved factors like institutional structure are considered as TFP. For example, in Solow growth model, TFP can be
macroeconomic environment, they are far away from obtaining sufficient rates of growth.
The Turkish economy has experienced significant instability in its macroeconomic environment since the 70s. After the detrimental crisis in 2001, it seems that the Turkish economy has reached some degree of stability since 2002. Now, as inflation and real interest rates are decreasing, more questions are arising about how to sustain the growth performance. For the Turkish economy, historically I try to determine the role of macroeconomic developments on TFP growth. More specifically, effects of openness to international trade, foreign direct investments, infrastructure investments and macroeconomic stability will be analysed in this thesis. Along with these goals, firstly, TFP series are estimated by using growth accounting approach, which was suggested by R. M. Solow (1957). Then, investigation of factors explaining the historical path of TFP is provided to clarify TFP developments in Turkish economy between the years of 1972-2003.
Outline of the thesis is as follows; in Chapter 2, I review the theoretical and empirical literature mostly based on neoclassical and endogenous growth theories. In Chapter 3, I try to draw the picture of the Turkish economy over 1972-2003. In Chapter 4, TFP series are estimated for the Turkish economy covering the period 1972-2003. In Chapter 5, by using regression analysis, I investigate the factors that determine the developments in the TFP series. Finally, in Chapter 6, I conclude after some concluding remarks.
CHAPTER 2
LITERATURE REVIEW
Starting from R. M. Solow’s (1956) seminal study on sources of growth, numerous theoretical and empirical studies have been carried out to explain why some countries are richer than others. In Solow’s growth model, TFP is considered as the technology level of the country. He made two significant observations: First one is that countries are richer than others because of the differences in investment rates, population growth rates and the technological progress and the second observation is that long-run growth rates of the countries are determined by technological progress, which is exogenously determined. Therefore, in Solow’s neoclassical growth model, technological progress, which is TFP growth, has significant importance for countries to be able to attain a sustainable growth path. Also, according to Easterly and Levine (2001), technological change explains 2/3 of cross-country GDP growth differences, while physical and human capital accounts for 1/3 in the variation. In spite of significance of technological change, which is the only determinant of long-run per-capita income growth rate in Solow model, it is left unmodelled.
Romer (1986, 1990) and Lucas (1988) constructed new neoclassical growth models, in which technological progress is determined as an endogenous outcome of
the economic system. Lucas (1988) put human capital in Solow’s production function like a labor-augmenting technology, but human capital increases as workers spend more time to acquire skills. So in contrast to Solow’s random technological progress, policy makers could affect the long-run growth of output per worker via implementing policies that lead to increase in time spent on education to build skills for workers. Lucas (1988) also proposes another point in his model, which is learning-by-doing activity. In this study, dramatic “growth miracles” of the South Korea, Taiwan, Hong Kong and Singapore are associated with successful performance in exports, which is considered as the outcome of the these countries’ comparative advantages by means of learning-by-doing activity. Within the context of Lucas’ (1988) study, countries’ richness can be explained due to the fact that they, comparatively, give more importance on skill acquisition through spending on educational activities and benefiting from trade in the context of learning-by-doing as well as other factors suggested in Solow (1956, 1957).
Romer (1986) proposes that per capita income can grow at a monotonically increasing rate due to the knowledge accumulated by the forward-looking profit-maximizing firms. In this model, technological change, which is the only decisive factor of long-run growth rate, is determined by accumulation of knowledge rather than by means of exogenous factors. Knowledge as an input in aggregate production function presents increasing returns to scale along with the other inputs since the production of new knowledge has positive externalities for other firms. Hence, countries that provide necessary judicial infrastructure for intellectual property rights so as to facilitate creation of profitable new ideas tend to be richer. In another study, Romer (1990) concludes that stock of human capital is a significant factor
determining the growth rates and the integration into world market. Studies continued to elaborate endogenous growth theory by considering the spending on Research and Development (R&D) as a proxy for knowledge accumulation. Hence, these types of models are also called as R&D based models, as well (See for R&D based studies Jones (1995), Grossman and Helpman (1991), Aghion and Howitt (1992) and others).
Based on the endogenous growth models and classical Solow growth models, many empirical studies attempted to explain technological differences among the nations, or to clarify lack of sufficient progress in technological change within the country. Among these studies, Hall and Jones (1996) claim that some countries are more productive because of a good economic environment, which represents infrastructure of the country with respect to the characteristics of government, culture and the climate. According to this study, such kind of favorable economic environment is considered as conducive to innovation, transfer of technology, and investing on physical and human capital. In their findings, countries that are open to trade, sustain private ownership, speak international language and far from the equator are indicated as more productive. Also, in the regression results, it is shown that governments applying anti-diversion policies result in high productivities.
In the next three sections, I will review literature of TFP determinants in the context of openness to international trade, macroeconomic (in)stability and foreign direct inflows (FDI).
2.1 Openness and TFP
In the literature, many studies have been carried out to analyze the effects of country’s openness to international trade on productivity and economic growth.
Rivera-Batiz and Romer (1991a), Rivera-Batiz and Romer (1991b), Grossman and Helpman (1991), Barro and Sala-i-Martin (1995) are among the important studies concluding that countries more open to rest of the world have greater aptitude to transfer and adopt the technology invented in advanced economies. Many other empirical studies investigate whether this assertion holds for developed, semi-developed and less developed countries (see, Mayer, 2001; Edwards, 1998; Coe and Helpman 1995; Ghirmay, Grabowski and Sharma, 2001; Xu and Wang, 1999; Singh 2003; Crespo, Martin and Velázquez, 2002, Weinhold and E. Rauch, 1999, Hoppe, 2005; Keller, 1997 and others). As these studies asserted, trade leads to technology transfer and TFP growth in three different ways. First, imports of capital and intermediate goods affect directly technology transfer and so does TFP. Second, trade helps to benefit from a dynamic effect in production by means of learning by doing process. Last, by means of trade, countries can increase availability of technology and the knowledge stock (Hoppe, 2005).
Coe and Helpman (1995) carried out the empirical study to explain productivity differences among countries in the context of R&D based endogenous growth models. Their findings were that productivity growth is positively contributed both by the domestic R&D capital stock and the foreign trade partner R&D capital stock. Furthermore, for smaller countries foreign R&D capital is as significant as
domestic R&D capital stock compared to the larger countries. Also, Keller (1997) investigated the technology transfer by means of R&D investments made on intermediate goods. As technology embodied in intermediate goods which are used in production process of domestic and foreign sectors, technology is channeled into other domestic sectors and foreign sectors. According to Keller (1997), trade increases technology transfers if foreign R&D investments are made on the same industry with domestic one. Lichtenberg and Pottelsberghe (1996) reviewed the study of Coe and Helpman (1995) in two respects. First, they take Foreign Direct Investment (FDI) outflows into consideration as a source of technology dissemination between the countries in addition to trade. Second, they criticize the functional form of foreign R&D stock, which is inserted in the TFP equation. Empirical findings of Lichtenberg and Pottelsberghe (1996) are that FDI outflows and imports of goods are two simultaneous channels for international technology diffusion. In contrast to general belief, FDI inflows are not found to be a significant determinant for technology dissemination.
Edwards (1998) studied the effects of openness on TFP growth for 93 countries in order to clarify the links between openness and growth connection. By using nine different trade policy indexes, it was empirically showed that countries, which were more open to international trade, observed comparatively rapid TFP growth.
Xu and Wang (1999) investigated the impact of capital-good trade on TFP growth by means of R&D spillovers and evaluated quantitatively effects of international R&D spillovers for OECD countries. In contrast to the other empirical
studies (for example, Coe and Helpman (1995)), Xu and Wang (1999) distinguished total imports into capital goods import and non-capital goods import due to the fact that capital goods are embodied with more technology compared to non-capital goods. Xu and Wang (1999) also differentiated R&D spillovers embodied in trade from disembodied form, which can be created through scientific literature, international conferences, and international students and so on. Xu and Wang (1999) found that through imports of knowledge embodied capital goods leads R&D spillovers for capital goods importer countries so that productivity enhances. However, they also point out the importance of other channels like disembodied form of R&D spillovers through which majority of R&D spillover takes place in OECD countries.
Weinhold and Rauch (1999) point out the lack of sufficient explanation for the question through which openness triggers productivity growth. Weinhold and Rauch (1999) provided empirical evidence for such a mechanism that constructs trade-productivity link for less developed countries (LDCs). They propose that along with the increase in international trade, resources specialize on the sectors in which country has comparative advantage with respect to Ricardian view. According to Weinhold and Rauch (1999), specialization makes human capital more productive in the sector in which production is founded on learning by doing set up2. Weinhold and Rauch (1999) empirically found that for LDCs more open economies become more productive in manufacturing sectors through the mechanism of realizing dynamic economies of scale, and the results are hold even in the case of variables like inflation, openness, government spending and investment controlled for. Also,
2
Ghirmay, Grabowski and Sharma (2001) investigated the impacts of export growth on real gross domestic product growth through the channels of efficiency growth and investment increases driven by export growth.3 By using multivariate causality analysis, they empirically tested growth of 19 LDCs whether driven by export growth. According to empirical analysis, it was found that for 15 LDCs, export growth causes economic growth, among them for 9 LDCs economic growth was caused by both channels, for 3 LDCs economic growth was explained only by increase in efficiency and for 3 LDCs economic growth was caused by an increase in investment level.
Mayer (2001) implemented cross-country growth-accounting framework to analyze the impacts of capital goods import on growth. One of the main findings is that machinery import along with the human capital stock plays an important role in cross-country growth differences.4 As a second significant result, he showed that increase in the unilateral trade between developing countries does not lead to positive effect on technology imports and growth. Crespo, Martin and Velázquez (2002) also investigated the impacts of import on international technology spillovers for OECD countries, and conclude that countries benefit from technology spillovers through imports, yet domestic R&D stock and human capital stock are the significant factors determining the success of diffusion of foreign technology.
3
Export affects investment by increasing foreign savings to finance investments and by relaxing constraints on foreign exchange needed to imported intermediate and capital goods, which contribute to capital accumulation.
4
Mayer (2001) signifies the human capital stock for developing countries to be able to adopt technology produced abroad. But government should also apply policy of reducing the cost of technology adoption in coordination with investing human capital. Otherwise, investment only in skill
Singh (2003) analyses the effects of exports on TFP in an industry-based analysis for the Indian economy. In time series analysis, Singh (2003) does not found long-run relationship between TFP and exports for half of the sample industries. Whereas, remaining industries showed significant positive relationship between exports and TFP.
Miller and Upadhyay (2002) investigate the determinants of TFP that consist of human capital, openness to trade, distortions of domestic prices with respect to the world prices, inflation, terms of trade and volatility of export, terms of trade, domestic price deviation from purchasing power parity and inflation for a 30-year panel of 83 countries from all regions of the world and all income groups. In empirical findings of the study, openness defined as ratio of total exports to GDP generally shows positive effect on TFP across the regions and income groups.
2.2 FDI and TFP
Hoppe (2005) summarizes the effectiveness of FDI and joint ventures for technology transfers as follows:
In the context of learning-by-doing and an increasingly integrated world economy, FDI and Joint Ventures are important for the transfer of technology to developing countries. Often, re-imports based on low labor costs are an important reason to invest in a country with low labor costs. Integrated markets can lead to an increase in production in less developed countries increasing TFP directly through the used capital goods as well as through the learning effects of workers. Moreover, the larger the responsibility and control of the domestic firm, the better also the understanding is expected to be as involvement is higher. A better understanding gives a higher incentive for workers to defect and to found independent firms. Therefore, Joint Ventures, which leave more control and
workers to learn and might lead to a more rapid technology diffusion within the host country. Still, sourcing and import- or export-competition give again stronger incentives to domestic firms to innovate and to learn.
However, several studies emprically suggest that effects of FDI inflows on diffusion of technology are ambiguous. Empirical studies of Damijan et al. (2003), Taymaz (2004), Lichtenberg and Pottelsberghe (1996) and Duncan (2002) do not coincide with the assertion offered by Hoppe (2005). On the other hand, Egger and Pfaffermayr (2001) found positive impact of FDI flows on international technology spillover.
Kinoshita (2000) analyzed effects of technology spillovers and R&D aspects of FDI on Czech firms’ productivity growth. Kinoshita (2000) put emphasis on learning effect and innovation effect of R&D, and the learning effect is found to be more important to enhance productivity. Kinoshita (2000) also found that foreign joint venture partner does not provide technology spillovers for local firms. Lastly, positive spillover effects of FDI are realized in the oligopolistic sectors such as electrical machinery and radio&TV sectors, where R&D investments have traditionally a higher rate of return.
Egger and Pfaffermayr (2001) studied the effects of FDI inflows into Austrian manufacturing sector on FDI-receiving firms and the other firms through spillovers. Labor productivity is chosen as dependent variable explained by physical capital stock, labor and FDI inflows. Empirically, it is shown that FDI inflows have positive impact on labor productivity for firms in the manufacturing sector. Mcvicar (2002) implemented a similar study to capture the effects of FDI inflows and imports
widespread belief, Mcvicar (2002) presents that FDI inflows and imports reduce the productivity of manufacturing sectors of UK by means of market stealing effect of FDI and imports on domestic firms.
Sun and Parikh (2001) analyzed the impacts of exports growth, share of domestic and foreign investment to GDP on growth. The findings support the Hoppe’s (2005) propositions, that is, both export and FDI inflows affect growth positively. But, for some regions of the China, export growth and FDI growth have insignificant coefficients to explain growth.
Damijan et. al. (2003) empirically tested the various channels of global technology transfer to transition economies of Central and Eastern Europe Countries (CEEC) between the years 1994-1998 in order to define the determinants of TFP growth. By implementing free trade policies, international trade and FDI flows have become two sources to gain international technology by CEEC. Dmijan et. al. (2003) work on firm-based data for eight transition countries and offer that technology is being transferred to local firms by the way of direct foreign linkages. More importantly, FDI does not lead intra-industry spillovers for domestic firms.
Taymaz and Lenger (2004) carried out the study to examine the impacts of multinational corporations (MNCs) on productivity of the firms in Turkish manufacturing industry. Taymaz and Lenger (2004) shed lights on the size of the recipient firms and the R&D intensity and also timing of spillover effects. They suggest that spillover effects of MNCs on Turkish manufacturing industry over the period of 1983-2000 differ according to the size of the recipient domestic firm and
by time. Taymaz and Lenger (2004) propose that foreign market share makes positive spillover effect for the firms as time lag of partnership increases due to the learning effects of domestic firms. Also, they econometrically show that technological capability of the Turkish manufacturing firms plays crucial role in order to benefit from spillover effects for foreign firms. Results of the study do not reject the negative spillover effects of MNCs on the Turkish manufacturing industry.
2.3 Macroeconomic (In)Stability and TFP
Macroeconomic stability plays an essential role to determine the economic environment in which economic agents take their decisions. According to Fischer (1993), stable macroeconomic framework can be described as follows:
The macroeconomic framework can be described as stable when inflation is low and predictable, real interest rates are appropriate, fiscal policy is stable and sustainable, the real exchange rate is competitive and predictable, and the balance of payments situation is perceived as viable.
According to Fischer (1993), the macroeconomic factors affect growth through the uncertainty in two ways. First, macroeconomic uncertainty induced by government policies threatens the efficiency of price mechanism, which increases the productivity and the rate of increase of productivity. These uncertainties could be brought by high inflation rates, instability in the budget or current account. Second, uncertainty may lead to reduction in investment rates, which could be channeled into sectors contributing to TFP, capital accumulation and human capital and so does growth.
There are many studies in the literature examining the relationship between the growth and macroeconomic variables such as inflation, budget surplus, interest rate, terms of trade, and instabilities in macroeconomic prices like inflation, interest rate and foreign exchange rates.
Fischer (1993) determines effects of macroeconomic factors on growth and TFP in panel data analysis by using growth accounting approach. Accordingly, macroeconomic factors determine the growth through physical and human capital accumulation and TFP. In this framework, cross-country per-capita income differences can be partially explained by macroeconomic stability conditions of countries. Although many rich countries sustain macroeconomic stability, some other underdeveloped countries cannot reach sustainable growth path in spite of low inflation and balanced budget. Hence, macroeconomic stability can be considered as necessary but not sufficient condition for growth (Fischer, 1993). Fischer (1993) uses inflation, inflation volatility, budget balance and black market exchange premium as explanatory variables for growth. Inflation and inflation volatility are expected to affect growth negatively because inflation volatility is considered as proxy for uncertainty and high inflation rates are considered as the indicator of poor governance. Budget deficit reduces growth via two channels: First, increase in public expenditures crowds out private investments. And, second, like inflation rates, it serves as an indicator of the governments’ inability to manage economy. Increase in the black market exchange premium is negatively related to capital accumulation since it conveys the information of possible depreciation in the near future and foreign exchange rationing. Empirical results of this study indicate that growth is negatively related to inflation, large budget deficits and unstable foreign exchange
market. In this study, TFP growth is also regressed on the macroeconomic factors. Findings of the simple regression analysis are as follows: inflation, budget deficit, exchange rate premium and inflation uncertainty are negatively related to TFP growth, but change in the terms of trade positively affects the TFP growth. Edwards (1998) put inflation tax revenues as a share of GDP to explain TFP of 93 countries. Its coefficient is negative but insignificant to determine TFP.
Bitros and Panas (2001) analyze the impacts of inflation on the growth of TFP in two-digit manufacturing industries in Greece over the years of 1964-1980. Bitros and Panas (2001), based on the literature on inflation, presume that inflation hurts productivity by decreasing the ability of prices conveying information. Empirical finding of the study is that there exists negative trade-off between the inflation and TFP growth in Greece manufacturing industry.
Ismihan et al. (2005) studied the impacts of macroeconomic instability on capital accumulation and growth for the Turkish economy over 1963-1999 periods. Ismihan et al. (2005) conclude that the macroeconomic instability reduces the growth performance of Turkey and also it decreases the supportive effect of public investments on private investments in the long-run.
Tharakan (1999) carried out a study to examine the effect of exchange rate uncertainty (ERU) on growth for 21 OECD countries. Tharakan (1999) signify that ERU can be considered as the result of worse or insufficient government policies. In this respect, ERU can be an indicator of the uncertainties generated by the government policies as in the study of Fischer (1993). Within the context of
endogenous growth models, Tharakan (1999) explains impacts of ERU on growth by dividing sectors in the economy into two classifications: those which are confronted with international competition and those which are oriented for domestic markets. First ones tend to be more productive and innovative because of substantially large demand for their product. So, export oriented sector makes much more contribution to growth compared to the other one. In the case of increase in ERU, profitability of export oriented sector would decline and the resources tend to shift from the innovative and efficient sector to less efficient and less innovative sectors, which are oriented to domestic market. This, obviously, threatens the growth. Empirically, Tharakan (1999) regressed TFP on domestic and foreign R&D, human capital and variables stems for two different exchange rate uncertainty measures. Estimation results significantly support that the exchange rate uncertainty reduces TFP and growth for 21 OECD countries.
Bruno and Easterly (1998) also suggest that growth decreases sharply during periods of substantial inflation crisis and increases the above the pre-crisis level for the countries faced with high-inflation crisis. They indicate that TFP follows similar pattern with growth in contrast to capital accumulation. Namely, TFP declines during the inflation crisis, but it recovers and reaches the above pre-crisis level, though inflation does not decrease beyond the pre-crisis level. Bruno and Easterly (1998) also clarify the question whether inflation crises are caused by loss of government control on monetary and fiscal policy or not. They conclude that countries entering into crisis have a large budget deficit ratio as a per cent of GDP before and during the crisis periods.
Miller and Upadhyay (2002) found negative relation between inflation and TFP for the 83 countries over the 30 years period. But, significance of inflation lessens for countries of high-income group. Findings also suggest positive impacts of the terms of trade on TFP. Volatility in export to GDP ratio affects TFP negatively as well.
With respect to fiscal policy, Easterly and Rebelo (1993) find a positive significant relationship between budget surplus and growth. Also, public investment on transport and communication determine growth, positively. Moreover, in the study they find that rich countries tend to spend more on health and social security. Contrary to neoclassical theories, Easterly and Rebelo (1993) refer to new endogenous growth theories, in which fiscal policy is considered as the one of the major determinant of the cross-country differences. In endogenous growth models, fiscal policy stems for long-run determinant of growth via investing on human capital and R&D.
Easterly et al. (1993) investigate whether long-run growth rates are determined by appropriate policies countries implemented or by the exogenous shocks like terms of trade and sudden increase in oil prices. Easterly et al. (1993) notice that country characteristics present a more persistent pattern compared to growth performance of countries, which is highly volatile. Easterly et al. (1993) offer that terms of trade shock plays much more important role on determining the long-run growth rates compared to good government policies like high investment on education.
Easterly and Levine (1997) investigated the reasons behind the Africa’s growth tragedy. Easterly and Levine (1997) offer that economic growth is not satisfied at desired rates in Sub-Saharan Africa, due to low schooling, distorted foreign exchange market, high government deficits, insufficient infrastructure investments and underdeveloped financial system. More profoundly, ethnic diversity plays a crucial role in determining whether the public policies lead to low growth rates.
CHAPTER 3
DEVELOPMENTS IN THE TURKISH ECONOMY OVER THE
PERIOD OF 1972-2003
In this chapter, I offer a brief macro-economic history of Turkey over the period of 1972-2003. This period mainly covers the era of import-substituting industrialization (ISI) over the years 1972-1980, export-led growth (ELG) period of 1980-1989 and post financial liberalization period of 1990-today. Along with the thesis main objective, the main focus will be on growth, TFP, capital accumulation, integration of the Turkish economy into the world market and macroeconomic stability.
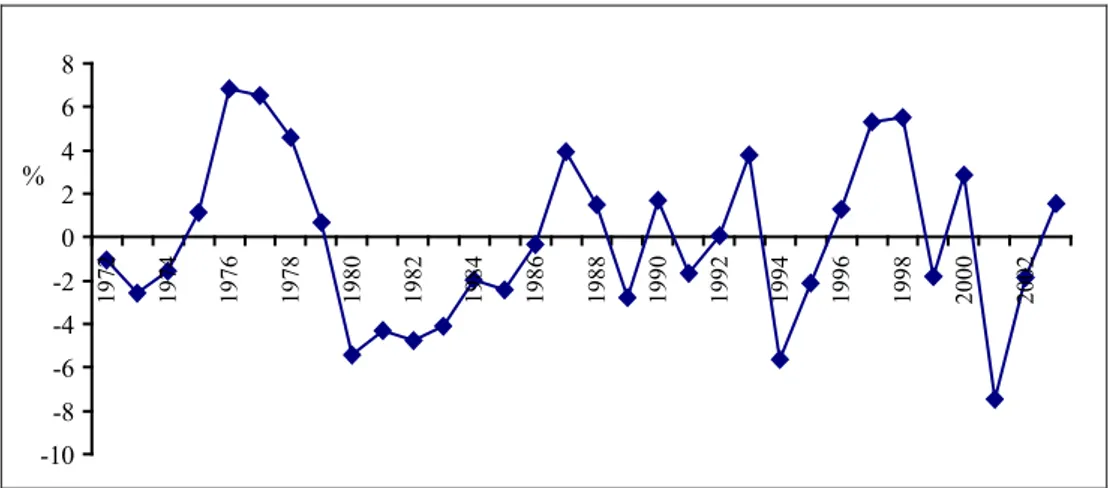
In order to investigate the output growth of the Turkish economy between 1972 and 2003, cyclical volatility of the GDP around its historical trend is estimated by using Hodrick–Prescott filtration method (See Metin-Özcan, Voyvoda and Yeldan (2000) for a similar study for the Turkish economy).
-10 -8 -6 -4 -2 0 2 4 6 8 1 9 7 2 1 9 7 4 1 9 7 6 1 9 7 8 1 9 8 0 1 9 8 2 1 9 8 4 1 9 8 6 1 9 8 8 1 9 9 0 1 9 9 2 1 9 9 4 1 9 9 6 1 9 9 8 2 0 0 0 2 0 0 2
Figure 3.1: Cyclical Movement of Output Around Its Historical Path5
As it is observed from the Figure 3.1, the Turkish economy followed an unstable output growth pattern during the 1972-2003 period when the sample is divided into two part: first one covers the period of 1972-1989, second covers the period of 1989-2003. Especially, post financial liberalization period volatility in output increases over the 1990-2003 period. Also, 1977-1980, 1994 and 2001 were the economic crises periods, in which GDP substantially fell behind its trend (potential) level.
Based on the study of Boratav and Yeldan (2002), the economic history of Turkey can be classified as follows: the second part of ISI period between 1972-1980, export-led growth period between 1981-1988/9 and post capital flow liberalization period between 1989-2003. Over the period of 1972-2003, the Turkish economy experienced detrimental economic and financial crises during the periods of 1977-1980, 1994 and 2001. In addition, Turkey affected negatively from the
5
global financial crises in the period of 1998-1999. Such kind of classification is also supported by the Figure 3.1, in which output reaches above the trend level during the period of ISI and export-oriented growth period, and output declines substantially during the crises periods. It is also observed that the Turkish economy became more fragile after capital account liberalization compared to ISI and ELG periods. More profoundly, the Turkish economy was increasingly faced with the crisis-growth cycle, which prevented possibilities to reach sustainable growth path over the years 1972-2003. Overall summary of the Turkish economy is given in the Table 3.1.
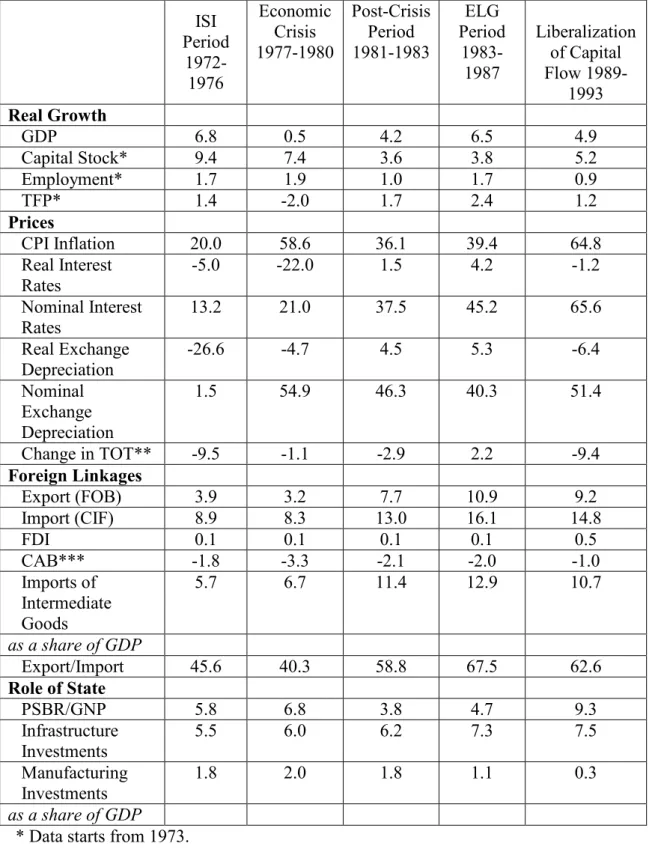
Table 3.1: Economic Phases of the Turkish Economic History between 1972-20036
* Data starts from 1973.
**TOT stands for Terms of Trade and data starts from 1975. ***CAB stands for Current Account Balance.
ISI Period 1972-1976 Economic Crisis 1977-1980 Post-Crisis Period 1981-1983 ELG Period 1983-1987 Liberalization of Capital Flow 1989-1993 Real Growth GDP 6.8 0.5 4.2 6.5 4.9 Capital Stock* 9.4 7.4 3.6 3.8 5.2 Employment* 1.7 1.9 1.0 1.7 0.9 TFP* 1.4 -2.0 1.7 2.4 1.2 Prices CPI Inflation 20.0 58.6 36.1 39.4 64.8 Real Interest Rates -5.0 -22.0 1.5 4.2 -1.2 Nominal Interest Rates 13.2 21.0 37.5 45.2 65.6 Real Exchange Depreciation -26.6 -4.7 4.5 5.3 -6.4 Nominal Exchange Depreciation 1.5 54.9 46.3 40.3 51.4 Change in TOT** -9.5 -1.1 -2.9 2.2 -9.4 Foreign Linkages Export (FOB) 3.9 3.2 7.7 10.9 9.2 Import (CIF) 8.9 8.3 13.0 16.1 14.8 FDI 0.1 0.1 0.1 0.1 0.5 CAB*** -1.8 -3.3 -2.1 -2.0 -1.0 Imports of Intermediate Goods 5.7 6.7 11.4 12.9 10.7 as a share of GDP Export/Import 45.6 40.3 58.8 67.5 62.6 Role of State PSBR/GNP 5.8 6.8 3.8 4.7 9.3 Infrastructure Investments 5.5 6.0 6.2 7.3 7.5 Manufacturing Investments 1.8 2.0 1.8 1.1 0.3 as a share of GDP
Table 3.1: Economic Phases of the Turkish Economic History between 1972-2003 (continued) Economic Crisis 1994 Post-Crisis Period 1995-1997 World Financial Crises Period 1998-1999 Economic Crises Period 2000-2001 Post-Crisis Period 2002-2003 Real Growth GDP -5.5 7.2 -0.8 -0.1 6.9 Capital Stock 4.5 5.6 3.9 3.1 1.2 Employment 8.1 2.0 2.0 -1.2 -0.9 TFP -6.5 2.2 -2.2 -0.3 3.8 Prices CPI Inflation 106.6 82.2 65.6 52.4 36.9 Real Interest Rates 0 11.3 16.5 2.0 9.0 Nominal Interest Rates 110 106.0 98.0 56.5 49.5 Real Exchange Depreciation 24.7 -5.8 -6.1 3.3 -10.1 Nominal Exchange Depreciation 169.9 72.8 66.3 72.5 11.0 Change in TOT -9.4 0.8 -4.9 -5.3 2.5 Foreign Linkages Export (FOB) 13.9 13.1 14.0 17.7 19.6 Import (CIF) 17.9 23.6 22.5 27.9 28.4 FDI 0.5 0.4 0.4 1.4 0.7 CAD 2.0 -1.4 0.1 -1.3 -2.1 Imports of Intermediate Goods 12.8 15.8 14.6 19.2 20.5 as a share of GDP Export/Import 77.8 56.0 62.1 63.3 69.0 Role of State PSBR/GNP 6.2 7.3 12.1 13.5 10.6 Infrastructure Investments 6.0 8.2 9.5 9.6 6.6 Manufacturing Investments 0.2 0.2 0.2 0.2 0.2 as a share of GDP
3.1 Inward-Oriented Import Substituting Industrialization Period (1972-1980)
The Turkish economy was introduced with the state-led ISI strategy along with the comprehensive central planning in 1960 7. The state increased its control over the economy via the State Planning Organization (SPO), which was enrolled to determine the state investments and to guide state economic enterprises. Private sectors were also guided by the five yearly development plans prepared by the SPO (see Şenses 1994, Boratav 2003, Yeldan 2003). Hence, state had a key role in macroeconomic management.
Şenses (1994) summarizes the main feature of the ISI strategy as follows: The ISI process in Turkey bore a close resemblance to that in other developing countries in terms of its pattern as well as its major impact. Overvalued exchange rates, quantitative restrictions and direct prohibition of imports, bilateral trade, a strict system of exchange control, high tariffs and guarantee deposits on imports, together with a variety of tax and credit incentives for manufacturing investment, were used as the main tools of trade and industrialization policy. Other forms of state intervention, such as the maintenance of negative real rates of interest, the tendency of SEEs to assist other sectors and the use of these enterprises as the “employer of last resort” were instrumental in reinforcing this pattern.
As it is seen in Figure 3.2 and Figure 3.3, state was actively involved in the industrialization process during the period of 1972-1977. These policies are discussed at length in Senses (1994). Public investments on industry increased rapidly between 1972 and 1977 from 10.1 per cent to 11.2 per cent, while private sector investments on manufacturing industry and industry as a whole remained stable for the same period (Figure 3.2 and Figure 3.3).
7
In the ISI strategy, the state implemented supportive income policies to increase domestic demand by means of high real wages and high price and input subsidies to agricultural sector. According to Boratav (2003), in this period positive growth in real wages is the significant factor to maintain a necessary level of aggregate demand for the domestic economy. Private sector was able to manage with high real wages due to low cost of inputs provided by SEEs. So, in this framework, all segments of the society were seemed to gain from the “populist” policies.
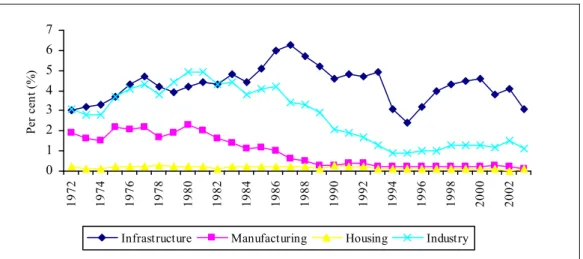
0 2 4 6 8 10 12 1 9 7 2 1 9 7 4 1 9 7 6 1 9 7 8 1 9 8 0 1 9 8 2 1 9 8 4 1 9 8 6 1 9 8 8 1 9 9 0 1 9 9 2 1 9 9 4 1 9 9 6 1 9 9 8 2 0 0 0 2 0 0 2 P er c en t (% )
Infrastructure Manufacturing Housing Industry
Figure 3.2: Private Investments by Sectors as a Ratio of GDP8
Over the 1973-1976 period, average of yearly GDP growth and capital stock growth were 6.6 per cent and 9.4 per cent, respectively (Table 3.1). These substantial developments were the result of significant amount state led investments on industry (Figure 3.3).
0 1 2 3 4 5 6 7 1 9 7 2 1 9 7 4 1 9 7 6 1 9 7 8 1 9 8 0 1 9 8 2 1 9 8 4 1 9 8 6 1 9 8 8 1 9 9 0 1 9 9 2 1 9 9 4 1 9 9 6 1 9 9 8 2 0 0 0 2 0 0 2 P er c en t (% )
Infrastructure Manufacturing Housing Industry
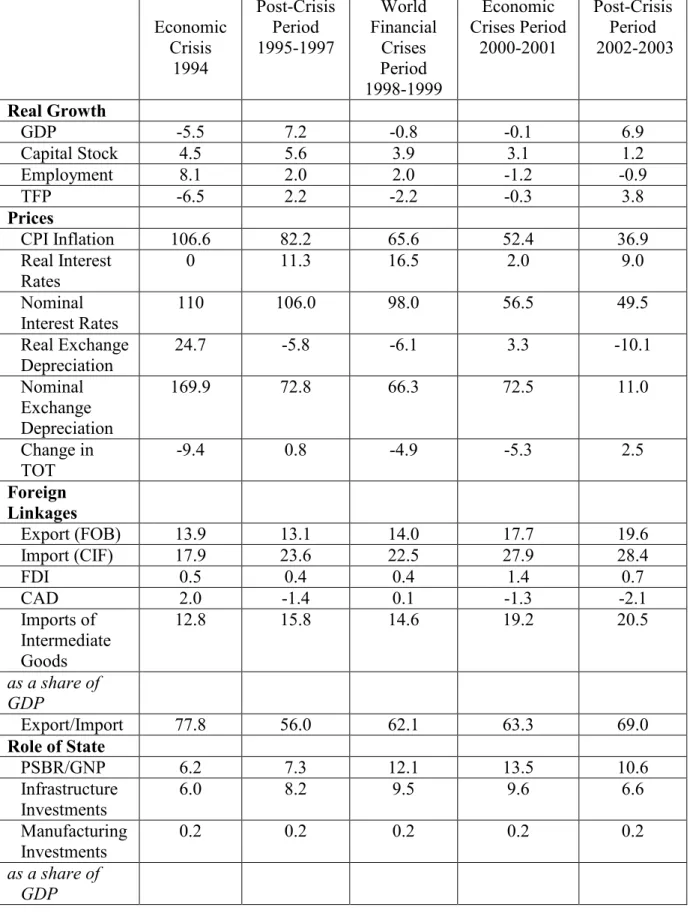
Figure 3.3: Public Investments by Sectors as a Ratio of GDP9
Over the period 1973-1976, the average of yearly TFP growth rates was 1.4 per cent, which was also higher when it is compared to other periods in Table 3.1. Also, Saygılı, Cihan and Yurtoğlu (2005) suggest that TFP went up in services sector but it decreased in industrial and agricultural sectors on the same period. As Saygılı, Cihan and Yurtoğlu (2005) noted, between 1972-1980, growth in industrial sector was mainly driven by capital accumulation rather than TFP increases. As it is illustrated in Figure 4.1, economy wide TFP performance presents an upward trend between 1972 and 1976 and it follows downward a trend until 1980.
Table 3.2. Sources of Growth in Some OECD Countries (Per cent) Countries and Periods GDP Growth (Annual Average) Contribution by Capital Stock Increase Contribution by Employment Increase Contribution by TFP Growth USA 1970-2000 3.06 33.8 40.5 25.1 1970-1991 2.68 34.5 47.5 17.8 1992-2000 3.95 32.7 30.1 36.6 Canada 1970-2000 3.21 30.4 49.0 18.7 1970-1991 3.26 33.1 52.3 13.9 1992-2000 3.09 24.0 47.0 30.3 Japan 1970-2000 3.45 62.2 12.2 26.0 1970-1991 4.52 54.6 12.5 33.1 1992-2000 0.95 146.4 9.1 -52.6 Belgium 1970-2000 2.56 36.8 5.8 57.0 1970-1991 2.79 36.0 4.3 59.3 1992-2000 2.04 39.3 10.6 49.7 Denmark 1970-2000 2.49 23.5 14.4 61.7 1970-1991 2.62 25.3 16.5 60.8 1992-2000 2.20 19.0 15.8 64.4 Finland 1970-2000 3.10 30.0 0.4 69.3 1970-1991 2.95 38.9 2.8 57.6 1992-2000 3.45 12.1 -4.3 92.5 France 1970-2000 2.62 44.7 -8.0 63.2 1970-1991 2.96 43.7 -1.4 57.4 1992-2000 1.82 48.4 -33.2 85.3 Germany 1992-2000 1.71 52.7 -15.9 64.2 West Germany 1970-1991 2.74 40.9 10.7 42.9 Italy 1980-2000 1.55 55.4 9.5 35.3 1980-1991 1.92 51.4 20.8 27.8 1992-2000 1.10 64.1 -14.7 51.3 Sweden 1979-2000 2.18 29.9 4.9 63.5 1979-1991 1.94 41.9 21.4 36.7 1992-2000 2.28 18.3 -17.6 100.1 Turkey 1972-2000 4.02 72.3 21.0 6.5 1972-1991 4.38 70.1 20.0 9.5 1992-2000 3.24 79.0 23.8 -2.1
Krueger and Tuncer (1980) investigated the TFP growth in the Turkish private manufacturing industry during the ISI period over 1960-1976 covering 91 firms in the sector. The annual percentage growth of private manufacturing TFP level was found as 1.84. In the study, it is noted that this rate was very low to reduce the income gap between developed countries and Turkey. Another finding is that TFP growth is negative during the years 1973-1976.
Table 3.3: Per-Capita Income for Some Developed Countries of OECD and Turkey in 2003
Countries GDP-Per Capita, PPP (Current international USD)
GDP-Per Capita, PPP (Constant 2000 international USD) USA 37425 35355 CANADA 30065 28402 JAPAN 28220 26659 BELGIUM 29331 27709 DENMARK 30646 28951 FINLAND 28106 26551 FRANCE 28231 26670 GERMANY 27124 25624 ITALY 27228 25722 SWEDEN 28289 26725 TURKEY 7068 6677
Source: World Bank-World Development Indicator.
convergence point of view, Tables 3.2 and 3.3 provide similar information with Krueger and Tuncer (1980) disclosing that the probability of closing the income-gap between Turkey and developed countries is very low. Also, from the Table 3.2, the contribution of TFP growth to GDP growth was seemed to be highest during the ISI and ELG periods. This is also proven by the Figure 4.1, which presents the level of TFP and its trend.
Over the years 1972-1976, macroeconomic environment was stable except for high inflation rates around 20 per cent. Export and import performance of the Turkish economy in this period was quite low compared to other period listed in Table 3.1. An average of annual growth rates of export and import were 3.7 per cent and 9.3 per cent, respectively.
In the 1970s the increase in manufacturing investments led to increased need for foreign exchange resources, which were financed by partly favorable export performance, emigrant worker remittances, and foreign borrowings. These resources also helped the Turkish economy to overcome the world oil crisis in 1974. But, the Turkish economy became increasingly dependent on the foreign exchange resources to finance new manufacturing investments in the late 1970s. Also, industrialization process was not sustainable due to high degree of protections, populist income policies and high distortions in relative factor prices (see Şenses (1994) for details).
Consequently, Turkey faced with the severe external payment difficulty between 1977 and 1980. Average of annual growth rates of GDP and TFP were to 0.5 per cent and -2.0 per cent, respectively over 1977-1980. Inflation rate increased
from 15.1 to 88.1 between 1976-1980. In addition, exchange rate depreciated by 54.7 on the average. Current account deficit as ratio of GDP also widened from 2.9 per cent to 3.3 per cent during the 1977-1980 period, compared to the 1974-1976 period. So, these were the crisis years, in which within an unstable macroeconomic environment, low growth rates, high public sector borrowing rates (PSBR), external payment problems were persistent. Since public investments on industry increased by 8.2 per cent in real terms between 1976 and 1980, an average of annual growth rate of capital stock did not decline substantially (see Table 3.1). Saygılı, Cihan and Yurtoglu (2005) stated that the TFP of agriculture, services and industry declined during the same period. In this period, macroeconomic instability can be considered as the main reason for low level of the economy wide TFP.
After this crisis period, ISI became unsustainable for the Turkish economy. Then, the stabilization and structural adjustment program introduced in 1980 aimed at converting the Turkish economy into a export-oriented market based economy.
3.2 Export Led Growth Period (1981-1988)
The Turkish economy shifted into outward-oriented growth strategy after facing with unfavorable outcomes of ISI strategy over the years 1977-1980. The 1980 stabilization and structural adjustment program backed by International Monetary Fund (IMF), World Bank (WB) and Organization of Economic Cooperation and Development (OECD) included strategies, which intend to liberalize the Turkish economy steadily (See Aricanli and Rodrik (1990), Şenses
(1994), Celasun (1994) for detailed analysis of export-led growth period). Baysan and Blitzer (1990:10) summarize the specific policy objectives of the program as follows:
(i) the adoption of a realistic and flexible exchange rate policy; (ii) more effective export promotion measures to encourage rapid export-growth; (iii) gradual import liberalization, including the dismantling of quantitative restrictions and the rationalization of the tariff structure; (iv) improved external debt management and information systems; (v) tight monetary controls and discipline to restrain domestic absorption and reduce the rate of inflation; (vi) deregulation of interest rates to encourage private savings; (vii) rationalization of the public investment program; (viii) a greater role for the private sector by encouraging privatization and limiting the range of sectors dominated by public enterprises; (ix) reform of the SEEs to reduce their burden on the budget and improve their efficiency; and (x) steps to improve institutional efficiency in key sectors.
Along with these policy objectives, interest rates were deregulated in July 1980, but determination of interest rates continued to be closely monitored by the Central Bank. In February 1988, commercial banks were allowed to set interest rates freely within the limit of upper-bound determined by the Central Bank. Exchange rate was devalued substantially in 1980 by 48.6 per cent (Baysan and Blitzer (1990)). Then, starting from May 1981, exchange rate was adjusted daily with the objective of maintaining a competitive lira over the years 1981-1988. The annual average of real effective exchange rate depreciation was 5.5 during this period. Also, erosion in real wages was another significant policy objective to restrain domestic demand and to reduce cost of production. Thereby, exportable surplus would be created in the economy via decrease in domestic demand and more competitive export-oriented sectors10. Moreover, intensive subsidies and incentives were provided to liberalize trade by means of tax repayment, export credits at preferential credit rates. Also, import restrictions and the exchange control released steadily.
Because of export promoting policies, an average of yearly export volume as a percentage of GDP increased to 10.8 percent during export-led growth period (1983-1987) and an average of yearly import volume as percentage of GDP increased to 15.7 per cent on the same period (Table 3.1). These rates were 3.9 per cent and 9.3 per cent for ISI period (1973-1976), respectively. An average of GDP growth was also impressive by 6.5 per cent. As far as TFP growth rates performance is concerned, 1980s were the most successful period when compared to 1970s and 1990s (Figure 4.1). In this period a substantial increase in trade volume was seemed to contribute TFP through learning-by-doing and international knowledge spillover effects. Also, an average share in annual imports of intermediate goods with respect to GDP rose substantially from 6.1 to 12.9 between the ISI period and ELG period (1983-1987). Importation of intermediate goods is one of the main mechanisms of technology transfer for the “follower” countries. Another mechanism for technology transfer is the FDI inflow, which was 0.1 per cent of the Turkish GDP as an annual average. So, Turkey was not able to attract desired level FDI inflow in spite of special emphasis given in the structural adjustment programme (see Öniş (1994) for more discussion). With respect to sectoral developments in TFP, industry and services sectors followed an upward trend during 1980s, but agricultural sector did not perform well on the same period.
Another noteworthy aspect of the 1980 transformation was the role of the public and private sectors in the capital accumulation. Public sector was reoriented to shift investments away from manufacturing industry to infrastructure investments, while the private sector was intended to invest on the manufacturing industry. As it is
observed in Figures 3.2 and 3.3, public infrastructure investments increased at an average annual growth rate of 8.7 per cent between 1983-1987, while public investments on manufacturing industry followed a decreasing path. Yet, more interestingly private investments on manufacturing industry did not have an upward trend during 1980s contrary to expectations. Instead, private sector investments were directed to the housing sector, in which real private investment growth was 21.2 per cent as an average of annual growth rates. Yet, private investments on infrastructure and manufacturing industry remained low during the 1980s. Conway (1990) concluded that private investments in 1980s became low due to unstable macroeconomic environment including high inflation, high nominal interest rates and a quickly depreciating nominal exchange rate. Conway (1990) also states that housing investments of private sector was crowded-in by the public investments, but non-housing investments like manufacturing industry investments and infrastructure investments were crowded-out by the public investments. So, capital stock with respect to GDP remained as 3.8 per cent during the ELG period and this indicates the loose performance as compared to the 9.4 per cent of ISI in 1973-1976. Therefore, in 1980s, GDP growth was mainly contributed by the TFP growth rather than the capital stock contribution. Özmucur and Karataş (1994) found that annual average of TFP growth of private manufacturing was -4.6 per cent for the period of 1973-1979, -2.5 per cent for the period 1979-1985, and -3.6 per cent for the period of 1973-1985. Annual average of TFP growth of the public manufacturing industry was -9.0 for the period of 1973-1979, 7.6 per cent for the period of 1979-1985, and -1.0 per cent for the period of 1973-1985. For total manufacturing industry, these rates were -5.4, 1.7 and -1.9 for respective periods. These low levels of TFP growths were caused by insufficient level of capacity utilization due to shortage in foreign exchanges and raw
materials (Karataş and Özmucur, 1994). They also found structural change in the TFP growth during pre- and post-liberalization periods by using Chow test. Uygur (1991) and Foroutan (1991) find positive TFP growth for the post-1980 period. Uygur (1991) found TFP growth in public, private and total manufacturing industry with 1.0 per cent, 2.2 per cent and 1.7 per cent, respectively. Foroutan (1991) find TFP growths of public manufacturing sector and private manufacturing sector as 5.7 per cent and 3.4 per cent, respectively over the 1981-1985 period. Significant contribution of the Foroutan’s study is that trade liberalization improved productivity of private industrial sector.
After the implementation of the stabilization and adjustment programme in 1980, Turkish economy sustained some degree of stability. But, inflation rates and nominal interest rates were still high at rates of 36.1 per cent and 37.5 per cent, respectively, over the 1981-1982 post-crisis period (Table 3.1). Real exchange rate was depreciated as 8.1 per cent annually over the years 1980-1988 in favor of export promoting policies. In the late 1980s, macroeconomic instability has increased (See İsmihan et. al. (2002), Yeldan (2003)). Annual average inflation rates was 48.1 per cent between 1984 and 1988, and nominal interest rates were 50 per cent. Also, public debt stock increased in late 1980s (See Rodrik (1990) and Celasun (1990) for detailed analysis). Ratio of the total interest and principal payments of domestic and foreign debt stock to tax revenues was 12 per cent in 1980, but it increased to 94 per cent in 1988. Ratio of interest payments to GDP was 0.59 per cent, while this ratio rose to 3.85 per cent in 1988. Domestic debt to GDP ratio also increased from 13.6 per cent in 1980 to 22 per cent in 1988 due to the high interest rates. In addition, high
rates of export subsidies and real exchange rate depreciation, which eroded the revenue of the state, brought additional burden on the budget.
After the implementation of trade liberalization policies in goods market to integrate world market in 1980, the Turkish economy entered a new era by implementing the capital account liberalization policy in 1989. During 1980s, the Turkish economy followed export-led growth strategy based on incentives created by state. Although enormous export performance was experienced, industrialization process that was successfully initiated in ISI period could not be completed due to the low investments on manufacturing industry from both public and private sector (see Şenses (1994) for more information)11. At the end of the decade, high inflation rates, high nominal interest rates, debt problem were persistent at the edge of capital account liberalization.
3.3 Post-Financial liberalization Period (1989-2003)
Before the capital account liberalization in 1989, the inflation rates and nominal interest rates were 75.3 per cent and 80 per cent, respectively, in 1988.The Turkish economy with fiscal and macroeconomic instability problems entered to the post financial liberalization period.
By the implementation of financial liberalization policy, it was expected that savings would be channeled towards to the financial sector so that credit volume
11
would increase, and also interest rates would decline, converging to the international rates. Thereby, increase in credit volume and lower cost of capital would encourage fixed capital investments in the Turkish economy (Yeldan 2003). But, outcome of the political shift in 1989 was not as expected. Banking sector credit volume as share of GDP was 21.3 per cent in 1987 and 17.6 per cent in 1988, but this ratio decreased to 16.5 per cent in 1990 as opposed to expectations. Also, as it is observed from Figures 3.2 and 3.3, there was no structural change in expenditures on fixed capital investments. In ELG period, annual average of total fixed capital investment to GDP was 21.8 per cent, and this ratio increased slightly to 23.9 per cent in post-financial liberalization period of 1989-1993. Inflation and nominal interest rates, which were 67.8 and 65.6 per cent, respectively, over the 1989-1993 period, kept increasing after financial liberalization. More importantly, public debt problem became persistent and dangerous in this period. PSBR over GNP hit 9.3 per cent, which was historically highest rate. That increase was mainly caused by “new populist policies” in 1990s like increase in real wages in public sector and delays in price increases of SEEs as well as high interest payments. High PSBR rates, which were sustained through domestic borrowing, led to high real interest rates. Then, high real interest rates encouraged the speculative capital inflows in Turkey after financial liberalization. High real interest rates increased the borrowing requirements of the public sector, which ended up with high real interest rates. So, dilemma of debt-high interest rates was the fact of 1990s. Ratio of total interest payments from consolidated budget to consolidated budget tax revenues increased dramatically in 1990s (Figure 3.5). This deteriorated the flexibility of public expenditure policy and led to requirement of providing the primary surplus on the budget. This led to decrease in expenditures on
public infrastructure investments like education, health, which is crucial for long-term development (Figure 3.3).
0 20 40 60 80 100 120 1 9 8 0 1 9 8 2 1 9 8 4 1 9 8 6 1 9 8 8 1 9 9 0 1 9 9 2 1 9 9 4 1 9 9 6 1 9 9 8 2 0 0 0 2 0 0 2 P er c en t (% )
Figure 3.5: Ratio of Interest Payments from Consolidated Budget to Tax Revenues12
Also, increase in domestic debt stock made the Turkish economy unstable. Hence, domestic savings were not channeled into fixed capital investments. In other words, increase in public spending on interest payments crowded-out the private investment during 1990s since high nominal interest payments on government debt instruments made other instruments in financial sector unattractive. Another problem in public policies with respect to fiscal policies was the high tax rates and lack of enlargement in tax base during 1990s. When distribution of tax revenues were analyzed in Turkey between 1980-2003, it is also observed that rate of indirect taxes revenues were higher than direct taxes during 1990s (Figure 3.6).
0 10 20 30 40 50 60 70 80 1 9 8 0 1 9 8 2 1 9 8 4 1 9 8 6 1 9 8 8 1 9 9 0 1 9 9 2 1 9 9 4 1 9 9 6 1 9 9 8 2 0 0 0 2 0 0 2 P er c en t (% )
Direct Taxes Indirect Taxes
Figure 3.6: Distribution of Tax Revenues in Turkish Economy13
This type of distribution led to unequal allocation of the tax burden on economic agents in the Turkey during 1990s. The gap between direct tax rates and indirect tax rates continued to widen between 1998-2003.
The export performance of the Turkish economy declined after significant increase in 1980s. Between 1989-1993, annual average growth rate of exports was 5.7 per cent, while this rate was 21.5 per cent between 1980-1988. Over the years 1989-1993, real exchange rate appreciated by 6.4 per cent, which deteriorated export growth and increased demand for imports. At the same time, increase in real wages brought upward pressure on the cost of export-oriented firms. During 1980s, export performance of manufacturing sector was quite well in spite of lack of fixed capital investments on manufacturing industry. But, 1990s export capacity of the manufacturing sector could not be enlarged due to insufficient investments on
manufacturing industry14. In 1980s, composition of export changed towards to industrial sector and this trend continued during 1990s. In 1995, share of agricultural exports in total exports decreased to 9. 9 per cent and it further decreased to 7. 1 per cent, in 2000. On the other hand, exports of industrial products in total exports realized as 88.2 per cent, in 1995 and it increased to 91.2 per cent, in 2000.
In 1990s, significant increase in imports realized due the real exchange rate appreciation policies. Since production capacity, which had been created during ISI period, was used during 1980s in order to sustain rapid export performance, starting from 1988 imports of investment goods increased to be able to perform export increase. But most striking increase in import components was the consumption goods during 1990s. In 1988, the share of consumption and investment goods in total imports were 4.3 per cent and 18.6 per cent, respectively. In 1993, these rates increased to 8.6 per cent and 25 per cent, respectively. Also imports of intermediate goods decreased to 10.7 per cent as ratio of GDP over the years when compared to 12.9 per cent realization in ELG period (Tale 3.1). These developments in trade led to increase in trade deficit and current account deficit. In 1988, trade deficit and current account deficit with respect to GDP were 2.0 per cent and 1.8 per cent, while these rates increased to 7.8 and 3.5 per cent pre-crisis year 1993.
High instability in macroeconomic environment, problems to finance balance of payments, and severe troubles in public finance policies caused a detrimental economic crisis in the Turkish economy in 1994. Economy contracted by -5.5 per