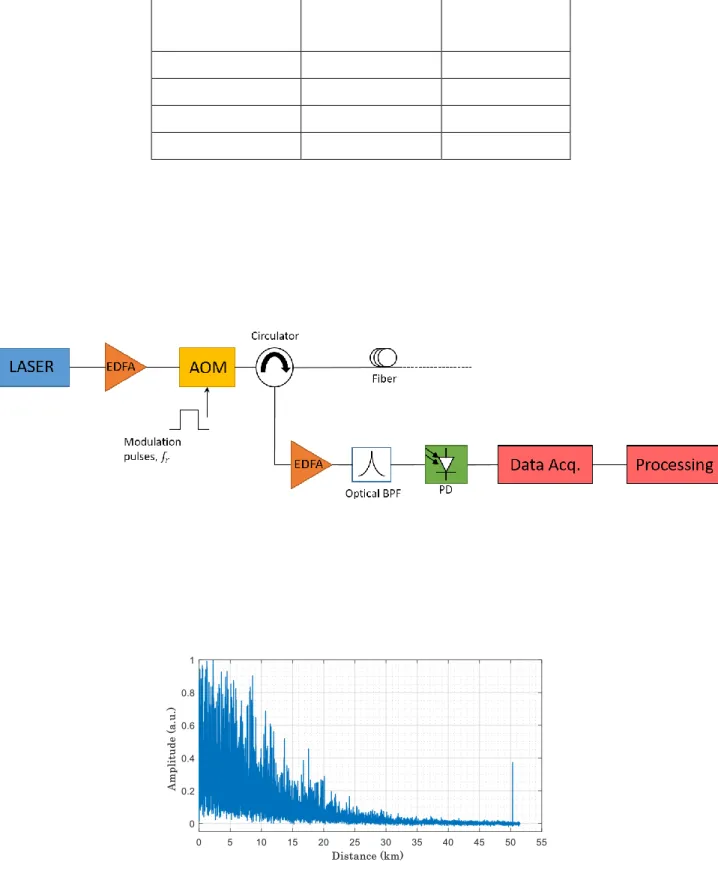
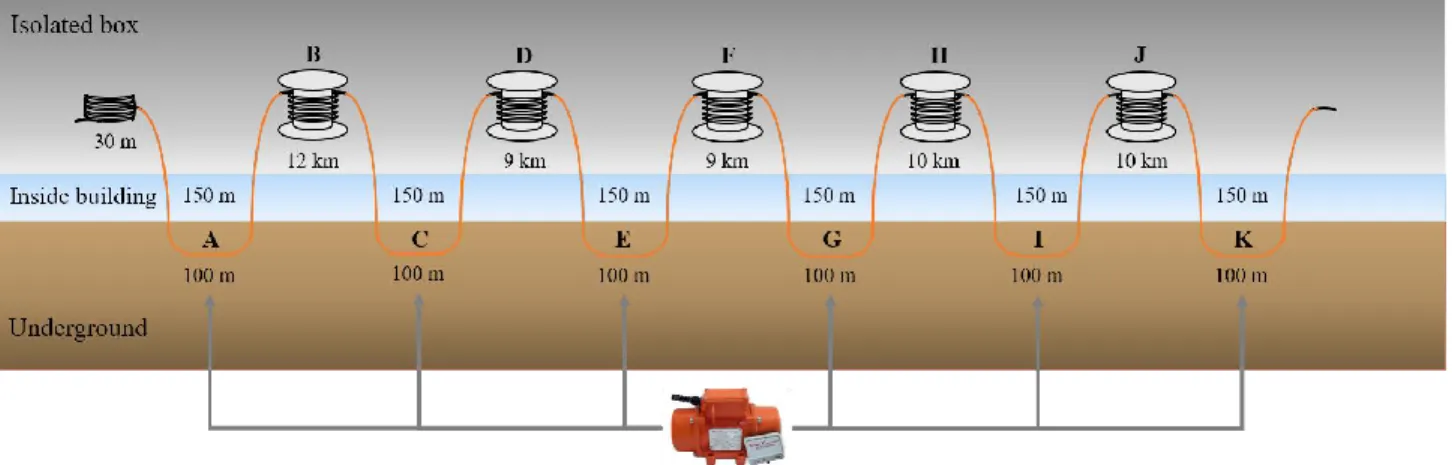
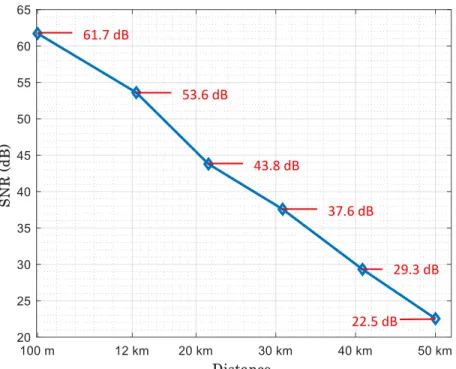
Field test and fading measurement of a distributed acoustic sensor system over a 50 km-long fiber
Tam metin
Şekil
Benzer Belgeler
Multivariate analysis of these variables revealed that age >60, ASA grade ≥3, APACHE II score ≥11, operations performed within on-call hours, and presence of peritonitis were
Cardiac syndrome X (CSX), also called microvascular angina, is defined as patients with angina-like chest pain with detectable ischemia in various tests [such as exercise stress
Then, the production of electrospun nanofibers from CD-ICs of flavour/fragrances without using a polymer matrix was achieved and the release and shelf life of these
It can be observed that for positive gate volt- ages the signal increases and for negative gate voltages it decreases on the entire sensitivity range of PbS.. Similar re- sults
It is shown that in contrast to a purely cohesive or purely elastic interface model that results in a uniform size dependent response, the general imperfect interfaces lead to
Özge ¸S afak, Özlem Çavu ¸s , M. Our model differs from the existing two-stage stochastic models by consider- ing not only flight timing and potential passenger demand, but
Figure 3.7: BER performance of rate 0.78 (28% OH) RS2-Polar code under SC List 4 decoding and 6 iterations on AWGN channel and BPSK modulation.. Figure 3.9 shows the third
The spider genus Zodarion Walckenaer, 1826 includes 138 species, which are distributed throughout the Mediterranean basin (Platnick, 2013) but have limited distribution
