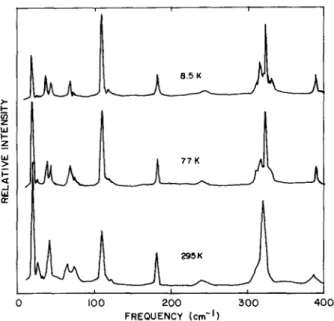
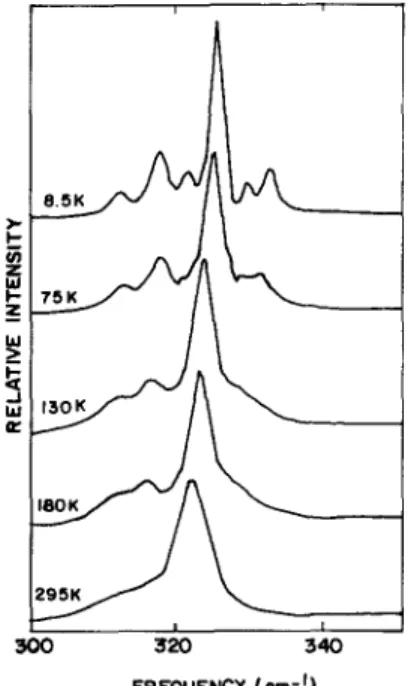
Low-temperature phase transitions in TlGaS2 layer crystals
Tam metin
Şekil
Benzer Belgeler
Kappa and iota carrageenans with monovalent (KCl, NaCl) salt system presented only coil to double helix (c-h) and double helix to coil (h-c) transitions upon cooling
We have calculated collective enhancement factors of level densities as a function of excitation energy and found that the decay of the vibrational and rotational enhancements is
'Avrupa tarihçilerinin ilmi zihniyeti, uzun zaman merkeziyetçilik esas~na dayanm~~t~r. Hegel devrinden beri Avrupa'da ~u kanaat hakimdi: Medeniyetin ilerlemesi, eski Yahu- dilik,
[20] Öztürk, N.S., DeğiĢik Piridin Aldehitler ile Anilinlerden Türeyen Schiff Bazlarının Sentezi ve Bazı GeçiĢ Metal Komplekslerinin Hazırlanması, Doktora
her iki dilde kullanılan sayısız ve karışık kısaltmaların yanlış okunması ve anlaşılması, he- celeri ya da genel kısa kelimeleri gösteren alışıldık işaretlerden
Multiresolution coding techniques have been used for lossy image and speech coding, in this thesis we developed multiresolution techniques for the lossless image
charges of the fermions forming the pairs are different, the magnetic field couples the center-of-mass motion with the relative coordinate.. As pairing is controlled by the
kum içeriği meyve bahçesinde, tarla ve ormandan farklı ve daha düşük, hacim ağırlığı ormanda, meyve bahçesi ve tarladan farklı ve daha düşük, katyon değişim kapasitesi
