Fast Insect Damage Detection
in
Wheat Kernels
Using Transmittance Images
Zehra Cataltepe
Tom Pearson
Enis
CetinSiemens Corporate Research Inc. U S . Department of Agriculture Bilkent University,
Intelligent Vision and Reasoning Dept. GMPRC Dept of E.E. Engineering,
755 College Road East 1515 College Ave TR-06533 Bilkent, Ankara, Turkey,
Princeton, NJ 08540 Manhattan, KS 66502 E-mail: [email protected]
E-mail: [email protected] E-mail: [email protected]
Absfrucf- We used transmittance images and different learn- ing algorithms to classify insect damaged and nn-damaged wheat kernels. Using the histogram of the pixels of the wheat images as the feature, and the linear model as the learning algorithm, we achieved a False Positive Rate (1-specificity) of 0.12 at the True Positive Rate (sensitivity) of 0.8 and an Area Under the ROC Curve (AUC) of 0.90 f 0.02. Combining the linear model and a Radial Basis Function Network in a committee resulted in a FP Rate of 0.09 at the TP Rate of 0.8 and an AUC of 0.93
*
0.03.I. INTRODUCTION
Infested wheat kernels cause loss of quality in the wheat products. They also cause a lot more damage if they are put into storage with other kernels. It is important to be able to identify insect damaged kernels so proper decisions can be made about them.
Current methods of insect detection such as cracking and flotation [ I ] , infrared CO2 analysis [2], immunological meth- ods [3], NIR [4], and x-ray inspection [ 5 ] can be laborious, slow, expensive, and ineffective at distinguishing a sound kernel from a kernel that is internally infested. It is possible
that the use of acoustics [6] to detect insects may serve as an alternative which would allow for recognition of kernels where the insect has already emerged as well as those in which the insect is still living inside the kernel. In this paper we describe a method to identify insect damaged kernels based on transmittance images. This method is fast and inexpensive compared with the other methods.
We first segmented the individual wheat kernels from the original transmittance images. Then we used the histogram of pixel intensities from each kernel to decide if it was insect damaged or not. We used a number of different algorithms, namely the linear model, quadratic model, k-nearest neighbor, linear model with weight decay and Radial Basis Function Network. Linear model was the best of all the algorithms with a False Positive Rate (1-specificity) of 0.12 at the True Positive Rate (sensitivity) of 0.8 and an Area Under the ROC Curve (AUC) of 0.90010.02. Although the radial basis function network performed worse than the linear mode (an AUC of 0.77 i 0.051, a committee of a linear model and a radial basis function resulted in an improved FP Rate of 0.09 at the T P Rate of 0.8 and an AUC of 0.93 i 0.03. We also
experimented with K-nearest neighbor model, quadratic model and linear model with weight decay (ridge regression). All of these learning methods resulted in worse performance than the linear model.
11. WHEAT IMAGES A N D FEATURES
Hard red winter wheat (H2) was used to obtain the images.
The insect damaged kernel images were taken from wheat infested with rice weevil and kept at about a moisture of 1 I%.
Transmittance images were taken as 800 pixelslinch tif images using an Epson Expression 1680 scanner. The exposure was set to 20 and gamma to 1.22.
The original un-damaged and insect damaged wheat kernel images were taken all together in two different shots. First we segmented each single kernel out of the original pictures using the blue component of the RGB. We obtained 355 good and 364 insect damaged kernels. We rotated each image so they had the maximum height and minimum width. Please see figure I for some sample images. The background color was white, so we determined the borders of each wheat image based on the background color. The reflectance along the borders of the image were affecting the features, so we cropped I O pixels from each pixel row on each side of the wheat.
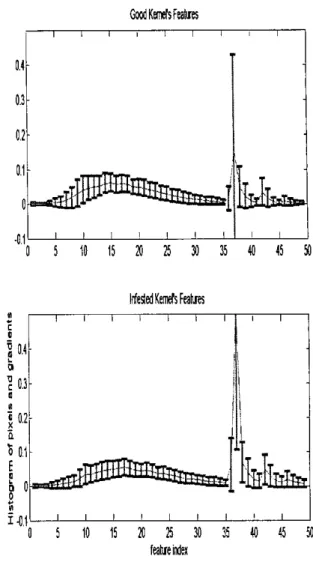
The histogram of red component of the pixels colors over each wheat image was used as the input feature for the learning algorithm. The 256 different Red components were put into bins as follows: If the red value was less than or equal to 80 the pixel was added into bin 0. If it was larger than 250 it was added into the last bin. Otherwise, the pixel was added into a bin in-between, each bin being responsible for 5 different red values resulting with 36 input features. In addition to these histogram values, we also used a feature similar to the gradient and histogram combination feature of [7]. For each horizontal pixel stripe on the kernel image, we counted the pixels that had a gradient on the red component (current point - the 10th previous) greater than a certain value (10,20,40) and red component also greater than a certain value (200,220,240,250). These 3 x 4 = 12 additional features resulted in a final feature set of size 49. Figure 2 shows the mean and standard deviation of features for all the available data. The gradient histogram features
GOOD
WHEAT KERNELS INFESTED WHEAT KERNELS 030,2
Fig. 1 . A sample of good and insect damaged kemel pictures
- -
have more variability than the normal histogram features. We assigned output 0 to the good kernels and I to the insect damaged kernels.
In addition to the histogram features, we tried two other features: the minimum, maximum and majority over 3x3 rectangles and the mean on the center of the wheat. However, the results didn't improve, so we don't report them here.
111. LEARNING ALGORITHMS
We used two different learning algorithms, the linear model and the radial basis function (RBF) network [El. The input features for all the algorithms were g E
R4'
and the corre- sponding outputs were y t {-1,1}.In order to get reliable figures on algorithm performance, we used cross validation. We randomly partitioned all the available data into a training and a test set. The training set used 90% of data from each class and the tes; set used the remaining 10%. We repeated the partitioning I O times.
We estimated the model performance using the ROC (Re- ceiver Operating Characteristics) [9], [IO], [ I l].and the Area
Under the ROC curve (AUC) [I21 on the tesi set. In order to obtain different False and True Positive ratbs on the ROC curve, we varied the threshold of each learning algorithm.
.
Linear Model: Let contain normalized train- ing inputs preceded by 1 andbN,,
contain the outputs yi for all the N training examples. The linear model is obtained by solving for %7x, in the equation A u =b.
In order to solve this equation we need to invert ATA.
0
Fig. 2. The mean and standard deviation of the input features for good and insect damaged kemels.
Since A was not full rank, A T A was not invertible. We used singular value decomposition [13] with E = 0.001. In order to get different points on the ROC curve. we varied the threshold for the output from -2 to 2 in steps of 0.1. If the output for a test case was smaller than the threshold we classified it as good and otherwise we classified it as insect damaged.
.
Radial Basis Function (RBF) Network: We used theRBF network described in [E]. We chose the first layer
weights through K-means clustering of the normalized training data. We computed the basis unit output for basis (first layer) weights 2 and normalized input
z
ase d p - - Z I , where
1.1
denotes the absolute norm of the vector. We computed the output of the RBF network for an input as the linear combination of the basis unit outputs appended by 1. We used singular value decomposition to 1344Alporithm
Linear 0.90 k 0.02 0.77 i 0.05
TABLE I
A R E A UNDER ROC CURVE (AUC) FOR DFFERENT LEARNING ALGORITHMS 0 0 % ~ 0.01- 0.93- 0.92 9 0.91 0.9 0.119- 0.M-
compute the output layer weights.
Since the three parameters of the RBF network, number of basis units, the scaling factor OL of the basis unit function and c of the singular value decomposition made a difference in the performance, we chose the parameters to be used for each training set as follows. We first divided the training set into a new training (90%) and validation (10%) set and we repeated this division 5 times. For each parameter combination, we found the mean AUC over
5 different training-validation partitions. We chose the
parameter combination with the maximum mean AUC to be used for the overall training set.
We used thresholds as in the linear model to get different ROC curve points.
.
Linear Model a n dRBF
Network Committee: We used a linear combination[l4] of the RBF network and the linear model outputs as the output of the committee and the same thresholds to get ROC curve points.IV. RESULTS
For each of the 10 training-test set partitioning of the available data, we used the training set to train the learning algorithm. We then used the test set to compute the ROC (Receiver Operating Characteristics) [9], [IO], [ l l ] curve for each partitioning.
We interpolated the ROC curve for each partitioning and reported the mean and standard deviation of the True Positive Rate (sensitivity) for each False Positive Rate (I-specificity) value for each learning algorithm [IO]. The mean and the standard deviation on the ROC curve gives us a better idea on the performance of an algorithm. In order to get a reliable mean, we discarded the ROC curve with the maximum and minimum AUC and computed the average ROC curve using the 8 remaining ROC curves. Please see table IV and figure 3.
Because of its simplicity and performance linear model seems to be the best single algorithm. The RBF and linear model committee performed the best. In figure 4 we show the AUC performance of the combined classifier for different weights given to the linear model. The weight of the RBF model is always I .
Although we experimented with different implementations of the RBF algorithm, such as determining the input weights one by one according to the training example with the worst error1 using not all the inputs but a portion of them, we could not iAprove the performance of the RBF network. We think
-
-
-
,
Fig. 3. Performance of Different Learning Algorilhms.
I
--
~
that the high correlation of the input features may be the reason and ICA, PCA or another approach, such as [IS] may be helpful.
.
A -- ..
Fig. 4. Model Changes.Performance of the Combined Classifier as the Weight of the Linear '
V.
DISCUSSIONWe used a number of learning algorithms to classify good and insect damaged wheat kernels and we found out that thelinear model performed the best. Additional information about the kernels such as reflectance images or compression force or conductance measurements [6] could be used to 1345
improve performance of a single classifier. Another approach is to train different classifiers with each of these features and then combining them [16].
Since the machines that automatically detect damaged ker- nels must work very fast, it is important to determine which few features are the most important to determine the dam- aged kernels
[7].
Approaches such as Independent Component Analysis (ICA) or Principal Component Analysis (PCA) could be used to select important features. It is worth noting, however, that on a 1.33 GHz Power PC G4 running MacOS X, linear or RBF network models take less than 1 milisecond to classify a sample. Since feature extraction for the samples used in this paper was performed manually, this figure does not include the time required for feature extraction.ACKNOWLEDGEMENTS
The first author would like thank her husband Dr. Tanju Cataltepe, both for computational resources and support. The research for this paper was performed before the author joined Siemens Corporate Research.
REFERENCES
[I] G.E. Russell. "Evaluation of four analytical methods to detect weevils in wheat: granary weevil. sitophilus granxius in soft white wheat," J o u m l
ofFood Pmrection, vol. 51. pp. 547-553, 1988.
[2] W.A. Bruce, M.W. Street, R.C. Semper, and D. Fulk, "Detection of hidden insect infestations in wheat by infrared carbon dioxide gas analysis." ARS bulletin, vol. luly, AAT-S-26, 1982.
131 EA. Quinn, W. Burkhalder, and G.B. Kitto, "Immunological technique for measuring insect contamination of grain," Journal of Economic
Entomology. vol. 85(4), pp. 1463-1470, 1992.
141 F.E. Dowell, I.E. Throne, and I.E. Baker, "Automated nondestructive detection of intemal insect infestation of wheat kernels by using near- infrared spectroscopy:' J o u m l of Economic Entomology, vol. 9 l(4). pp. 899-904. 1998.
[SI R.A. Stemer. "Automated x-ray inspection of grain for insect infesta- tion," Transactions o J t h ASAE.. vol. 15, pp. 1081-1085, 1972. 161 T. Pearson. D.L. Brabec. and C.R. Schwanz, "Automated detection a1
intemal insect infestations in whole wheat kemels usign a pelten skcs 4100." Applied Eqineering in Agriculture, vol. 19(6), pp. 727-733, 2003.
171 T. Pearson and R. Young, "'Automated sorting of almonds with embedded shell by laser transmittance imaging," Applied Engineering
in Agriculture. vol. l8(5). pp. 637441. 2002.
[8] C. M. Bishop. Neural Nerwork for Pottem Recognition, Clarendon Press. Oxford, 1995.
[9] C. E. Mew. "Basic principles of mc analysis,'' Seminors in Nuclem
Medicine, vol. 8. pp. 283-298. 1978.
[IO] F. Provost, T. Fawcett, and R. Kohavi. 'The case against accuracy esti. mation for camparing induction algorithms:' in Pmc. 15th Intemrrriunal
Conf on Mochine LPnming. 1998, pp. 44-453, Morgan Kaufmann. [ l I] M. H. Zweig and G. Campbell. "Receiver-operating characteristic (roc)
plau: a fundamental evaluation tool in clinical medicine:' Clinicol
Chcmirtry. vol. 39, pp. 561-567, 1993.
[I21 A. P. Bradley, ' T h e use of the area under the coc C U N ~ in the evaluation
of machine learning algorithms," Partem Recognition. vol. 30. No. 7. pp. 1145-1159. 1997.
[I31 W, H. Press. W. T. Vetterling. B. P. Flannery, and S. A. Teukolsky,
Numerical Recipes in C ; The Art oJScient@ic Computing. Cambridge University Press, 1992.
1141 G. Fumera and F. Roli, "Performance analysis and wmparison of linear wmbiners for classifier fusion," Lecture Notes in Computer Science,
Strucrurul, Syntactic nnd Statisricol Panem Recognirion, vol. 2396/2002.
pp. 424, 2003.
1151 R.B. Huang, Y.M Cheung. and L.T. Law, "A divide-and-conquer based radial basis function network with application to recurrent function modeling," in Pmceedings of 2003 Inremotional Joint Conference on
Neural Neworkr (IJCNN03). Portland, Oregon, USA, 2003, pp. 512- 516.
1161 J . K i n k M. Hatef. R. P. W. Dui". and 1. Matas, "On combining classifiers," IEEE Tramocriom on Parrern Analysis and Machine
Intelligence. vol. 20(3), pp. 226239. 1998.