The Impact of Financial Liberalization and the Rise of Financial Rents on Income Inequality: The Case of Turkey
Page 1 of 39
PRINTED FROM OXFORD SCHOLARSHIP ONLINE (www.oxfordscholarship.com). (c) Copyright Oxford University Press, 2018. All Rights Reserved. Under the terms of the licence agreement, an individual user may print out a PDF of a single chapter of a monograph in OSO for personal use (for details see www.oxfordscholarship.com/page/privacy-policy). Subscriber: Bilkent University Library; date: 13 December 2018
Inequality Growth and Poverty in an Era of
Liberalization and Globalization
Giovanni Andrea Cornia
Print publication date: 2004 Print ISBN-13: 9780199271412
Published to Oxford Scholarship Online: August 2004 DOI: 10.1093/0199271410.001.0001
The Impact of Financial
Liberalization and the Rise of
Financial Rents on Income
Inequality: The Case of Turkey
A. Erinc Yeldan
DOI:10.1093/0199271410.003.0014
Abstract and Keywords
This is the third of five country case studies on income inequality, and investigates the impact of financial liberalization and the rise of financial rents on income inequality in Turkey. The chapter has five sections:
Introduction; Indicators of Income Distribution: The Evidence —a broad overview, and evidence on the patterns of income distribution in Turkey over the last three decades;
Macroeconomic Adjustment under Financial Liberalization and the Rise of Financial Rents—a discussion of the evolution of functional categories of income that includes an account of the macroeconomic adjustment; The Rising Fiscal Gap and the Role of the State in Regulating the Distributional Structure—a detailed analysis of the rise in public sector deficits and the distributive consequences of the widening fiscal gap; and Concluding Comments and Overall Assessment. Sect. 3 looks at the inherent tensions caused by the macroeconomic
University Press Scholarship Online
disequilibria embodied in the process of integration with world markets under conditions of a poorly supervised banking system and underdeveloped and fragile domestic asset markets; here, it is found to be analytically convenient to decompose the path of Turkish liberalization after 1980 into two major subperiods partitioned by the strategic step of capital account deregulation—which took place in 1989 and was completed by the full integration of the domestic market into global financial markets. This section also studies the patterns of the wage cycle and productivity growth using quantitative filtering techniques, and reports on the
disassociation of labour remunerations from the productivity gains in the real sphere of the economy.
Keywords: banking system, capital account deregulation, capital accounts, case
studies, deregulation, domestic asset markets, financial liberalization, financial rents, Fiscal Gap, income, Income Distribution, income inequality, inequality, integration with world markets, labour remuneration, liberalization,
Macroeconomic Adjustment, productivity gains, productivity growth, public sector deficits, Turkey, wage cycle
14.1. INTRODUCTION
The last two decades have witnessed a fundamental change in the development strategy of most developing economies towards domestic and external liberalization. More recently, however, renewed attention has been placed on the adverse consequences of such public policy changes on income
equality and poverty alleviation. United Nations Conference on Trade and Development's (UNCTAD) 1997 Trade and
Development Report , for instance, reveals that, over a sample
of 124 countries accounting for 93.6 per cent of the world population, the income share of the richest one-fifth of the world population rose from 69 per cent in 1965 to over 83 per cent in 1990 (UNCTAD 1997 : 81). Likewise, the income gap between the richest and the poorest quintiles of the world population widened. The ratio of the average per capita gross national product (GNP) of the richest to the poorest quintile was 31:1 in 1965 but had risen to 60:1 by 1990. Given this evidence, the UNCTAD report presents the following stylized facts about development and income (in)equality during the post-1970 evolution of the global world economy (UNCTAD 1997 : 65). First, taken as a whole, the world economy is growing too slowly to alleviate poverty. Second, finance has been gaining over industry, and rentiers over investors. Similarly, capital has gained in comparison to labour, and the share of profits has risen within the functional distribution of
The Impact of Financial Liberalization and the Rise of Financial Rents on Income Inequality: The Case of Turkey
Page 3 of 39
PRINTED FROM OXFORD SCHOLARSHIP ONLINE (www.oxfordscholarship.com). (c) Copyright Oxford University Press, 2018. All Rights Reserved. Under the terms of the licence agreement, an individual user may print out a PDF of a single chapter of a monograph in OSO for personal use (for details see www.oxfordscholarship.com/page/privacy-policy). Subscriber: Bilkent University Library; date: 13 December 2018
income. And finally, the middle class has been under significant pressure as labour markets have become marginalized and the existing wage inequalities between skilled and unskilled labour have intensified.
While the factors behind these changes constitute the topic of active debate, 1 they are acknowledged to be conceptually part of a broader set of developments of the world economy loosely seen as constituting the process of globalization. This process accelerated during the 1970s with the advent of the
technological innovations in the (p.356) electronics and telecommunications industries. From the point of view of economic relations, the process of globalization requires two major policy changes: (a) the liberalization of domestic commodity and financial markets (the so-called ‘structural adjustment’), and (b) the elimination of all administrative and regulatory norms hindering the free movement of goods and international capital flows. In this sense, economic
globalization considers the profitability of capital as the sole objective of economic rationality and labels all kinds of
national regulations which limit the owners of capital in their quest for maximization of profit as ‘irrational’ or ‘backward ideology’ (Bourdieu 1998 ).
As a result, the international capital benefiting from the integration of world commodity and financial markets has two strategic targets. First, the reduction of the regulatory powers of national states, and second, the weakening of labour's already limited legal rights to collective bargaining and
unionization. Thus, in order to sanctify the power of unfettered market forces in the name of economic efficiency, this ‘infernal machine’ requires the elimination of all administrative or political barriers which limit the profitability of private capital and necessitates ‘a programme for destroying collective structures which may impede the pure market logic’ (Bourdieu 1998 ). The terms ‘globalization’ and ‘financial deregulation’ do, in fact, reflect the ideological underpinnings of these overall processes. It is the purpose of this study to investigate and assess the impact of financial rents on income distribution and the overall marginalization of labour incomes in the
post-1980 Turkish economy.
Turkey initiated its long process of integration in world commodity and financial markets with the 1980 structural adjustment reforms implemented under the auspices of the
International Monetary Fund (IMF) and the World Bank. Since its early inception, the Turkish adjustment programme was hailed as a model by the orthodox international community, and it was supported by generous financial assistance through structural adjustment loans, debt relief, and technical aid. 2 Currently, the Turkish economy can be said to be operating under conditions of a truly open economy: a macroeconomic environment in which its capital account is completely liberalized and the process of financial deregulation is completed. In this setting, many of the instruments of macro and fiscal control have been transformed, and the constraints of macroequilibrium have undergone major structural change.
3 Concurrently, the domestic economy has witnessed drastic
changes in the modes of surplus creation and extraction and in the interplay of distribution and accumulation.
The chapter is organized into five sections. The next section gives a broad overview and presents evidence on the patterns of income distribution in Turkey over the last (p.357) three decades. Section 14.3 turns to the evolution of functional categories of income and offers a panorama of the
macroeconomic adjustments under post-financial liberalization and the rise of financial rents. Here, of particular importance, is the investigation of the inherent tensions caused by the macroeconomic disequilibria embodied in the process of integration with world markets under conditions of a poorly supervised banking system and underdeveloped and fragile domestic asset markets. Thus, it is found to be analytically convenient to decompose the path of Turkish liberalization after 1980 into two major subperiods partitioned by the
strategic step of capital account deregulation which took place in 1989 and was completed by the full integration of the
domestic market in global financial markets. The section further studies the patterns of the wage cycle and productivity growth using quantitative filtering techniques, and it reports on the disassociation of labour remunerations from the productivity gains in the real sphere of the economy. Section 14.4 provides a detailed analysis of the rise in public sector deficits and the distributive consequences of the widening fiscal gap. Section 14.5 summarizes and concludes.
14.2. INDICATORS OF INCOME DISTRIBUTION: THE EVIDENCE
The Impact of Financial Liberalization and the Rise of Financial Rents on Income Inequality: The Case of Turkey
Page 5 of 39
PRINTED FROM OXFORD SCHOLARSHIP ONLINE (www.oxfordscholarship.com). (c) Copyright Oxford University Press, 2018. All Rights Reserved. Under the terms of the licence agreement, an individual user may print out a PDF of a single chapter of a monograph in OSO for personal use (for details see www.oxfordscholarship.com/page/privacy-policy). Subscriber: Bilkent University Library; date: 13 December 2018
Turkey is known to suffer from one of the most skewed income distributions among countries at a comparable level of
development. Partly fuelled by the legacy of prolonged import-substitutionist growth patterns, with excessive quota rents and an oligopolistic industrial and banking structure, the economy suffers further from a relatively stagnant and overpopulated agricultural sector, with loose linkages to domestic industry, high rates of immigration due to both economic and political pressures, and unequal opportunities to access education. With the advent in 1980 of reforms for openness that aimed at commodity trade liberalization and then, in 1989, with the completion of this through financial liberalization, there were renewed orthodox expectations of more equitable forms of distribution of the national product, since, given the signals of efficiency (world) prices, it was thought that import-quota rents would be dissipated and the domestic structure of production would be transformed. It was further argued that, as labour-intensive domestic industries shifted towards export markets, the remuneration of labour would increase in real terms. These orthodox prescriptions failed to function, however, as the economy witnessed sharp changes in the underlying economic polity, with the emergence and administration of new modes and mechanisms of surplus extraction throughout the course of liberalization. First and foremost, the proliberal stance and the integration of the domestic economy with world markets did not lead to a more competitive environment in domestic industry; on the contrary, the concentration rates in most outward-oriented sectors such as food processing, cement, glass production, and ceramics rose sharply. Furthermore, the financing behaviour of
corporations did not show significant change, and the banking sector became increasingly disassociated from credit financing and intermediation and evolved towards the financing of the securitization of the domestic debt.
(p.358) The new outward orientation also opened fresh avenues for wealth accumulation based on a renewed form of rent-seeking, this time towards export promotion subsidies and grants provided by the government. Commercial policies became the leading mechanism for squeezing domestic absorption capacity to generate an exportable surplus for export-oriented manufacturing capital. This exportable surplus was to be obtained through the generation of excess supply by reducing effective domestic demand. This, in turn,
necessitated the suppression of wage incomes. This was in stark contrast with the dual role of wages under the import-substitutionist phase both as a cost element and as a source of effective demand. Under the new export orientation, however, as the sources of effective demand would be expected to emerge not from the home market, but from the external economy, wages came to be regarded only as a cost item which needed to be minimized.
Thus, at a more general level, the post-1980 integration process fostered new, intense distributive tensions as the share of non-wage income in national product rose, the marginalization of labour deepened, the existing wage inequalities between skilled and unskilled labour intensified, and the access to social safety nets became increasingly difficult. All of these conditions favoured more adverse consequences in terms of the condition of the poor. Against this evidence on the functional categories of income
distribution, there are serious problems in the documentation of these processes as regards the size levels of incomes. Despite the availability of official and independent studies on the size distribution of incomes during the critical years of macroeconomic adjustment, direct comparisons are quite hard to make, as the studies have been subject to significant
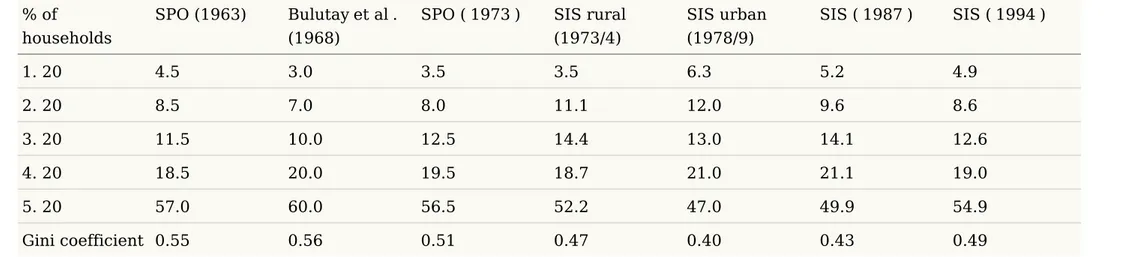
changes in both coverage and design over the years. Even so, it might be useful to lay down the existing evidence in its entirety and caution the reader against strong conclusions. Table 14.1 summarizes the available dataset from studies on the size distribution of income in Turkey over the last three decades.
Over the broad time horizon, the available Gini coefficients seem to show an overall tendency for the improvement of income distribution in the 1970s, followed by a worsening after the 1980s (on this, see Chapter 2 ). The rise in the income share of the richest
The Impact of Financial Liberalization and the Rise of Financial Rents on Income Inequality: The Case of Turkey
Page 7 of 39
PRINTED FROM OXFORD SCHOLARSHIP ONLINE (www.oxfordscholarship.com). (c) Copyright Oxford University Press, 2018. All Rights Reserved. Under the terms of the licence agreement, an individual user may print out a PDF of a single chapter of a monograph in OSO for personal use (for details see www.oxfordscholarship.com/page/privacy-policy). Subscriber: Bilkent University Library; date: 13 December 2018
Table 14.1. Summary of research on the size distribution of income (percentage of income)
% of households
SPO (1963) Bulutay et al .
(1968)
SPO ( 1973 ) SIS rural
(1973/4) SIS urban (1978/9) SIS ( 1987 ) SIS ( 1994 ) 1. 20 4.5 3.0 3.5 3.5 6.3 5.2 4.9 2. 20 8.5 7.0 8.0 11.1 12.0 9.6 8.6 3. 20 11.5 10.0 12.5 14.4 13.0 14.1 12.6 4. 20 18.5 20.0 19.5 18.7 21.0 21.1 19.0 5. 20 57.0 60.0 56.5 52.2 47.0 49.9 54.9 Gini coefficient 0.55 0.56 0.51 0.47 0.40 0.43 0.49
Note : Reference year in parentheses.
The Impact of Financial Liberalization and the Rise of Financial Rents on Income Inequality: The Case of Turkey
Page 9 of 39
PRINTED FROM OXFORD SCHOLARSHIP ONLINE (www.oxfordscholarship.com). (c) Copyright Oxford University Press, 2018. All Rights Reserved. Under the terms of the licence agreement, an individual user may print out a PDF of a single chapter of a monograph in OSO for personal use (for details see www.oxfordscholarship.com/page/privacy-policy). Subscriber: Bilkent University Library; date: 13 December 2018
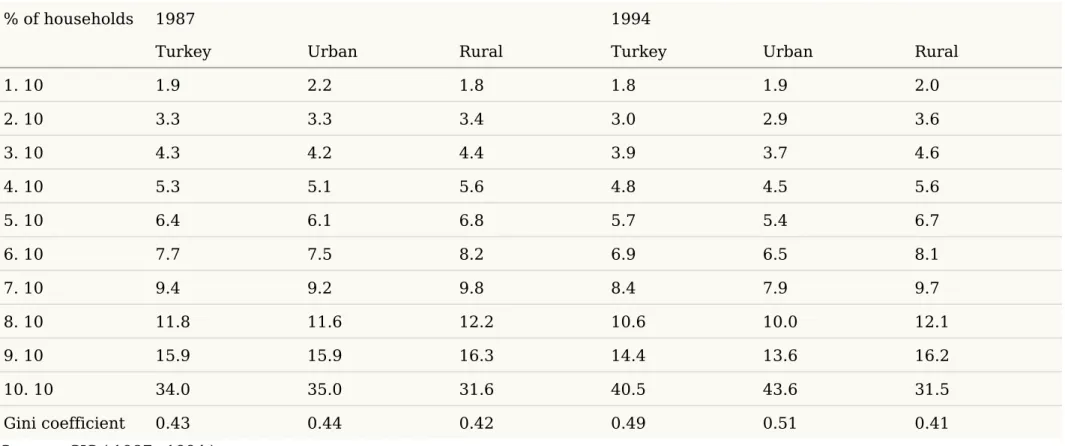
Table 14.2. Comparison of SIS 1987 versus 1994 surveys of income distribution (percentage of income)
% of households 1987 1994
Turkey Urban Rural Turkey Urban Rural
1. 10 1.9 2.2 1.8 1.8 1.9 2.0 2. 10 3.3 3.3 3.4 3.0 2.9 3.6 3. 10 4.3 4.2 4.4 3.9 3.7 4.6 4. 10 5.3 5.1 5.6 4.8 4.5 5.6 5. 10 6.4 6.1 6.8 5.7 5.4 6.7 6. 10 7.7 7.5 8.2 6.9 6.5 8.1 7. 10 9.4 9.2 9.8 8.4 7.9 9.7 8. 10 11.8 11.6 12.2 10.6 10.0 12.1 9. 10 15.9 15.9 16.3 14.4 13.6 16.2 10. 10 34.0 35.0 31.6 40.5 43.6 31.5 Gini coefficient 0.43 0.44 0.42 0.49 0.51 0.41 Source : SIS ( 1987 , 1994 ).
quintile seems to be a concomitant development, along with the fall of the share of the poorest quintile over the post-1978 time horizon. One becomes more confident in this assessment if attention is focused only on the latest two surveys conducted by the State Institute of Statistics (SIS 1987 , 1994 ). It is clear that, over the 1987–94 period, the SIS data suggest an expansion of the richest quintile at the expense of the other groups, coupled with an overall rise of the Gini index. Given the SIS data, Table 14.2 presents a more detailed assessment of the findings, tabulated at 10
percentage intervals across rural versus urban household income categories.
The overall message of the 1987 and 1994 surveys is that, while the income shares of all nine income groups declined over the period, the share of the richest 10 percentile increased. Within the economy-wide average, the richest 10 percentile raised its share by 6.5 percentage points, from 34 to 40.5 per cent. The polarization of income distribution is more acute in urban households in comparison with the rural sector. The rural economy's Gini coefficient is mostly stable at 0.41, and the worsening of the urban income distribution seems to account for almost all of the economy-wide
skewedness in income. In fact, with a Gini coefficient of above 50 per cent in urban centres, the lowest 20 per cent quintile is calculated to receive only 4.8 per cent of national income, in contrast with the share of the richest quintile, which reaches to 57.2 per cent.
The polarization of income is more visible if the comparison is made using purchasing power parity US dollars at constant prices. Such an exercise conducted on the SIS data reveals that the richest quintile consists of 13.9 million individuals with an average gross domestic product (GDP) per capita of $9,878. The per capita income of the top 5 percentile, on the other hand, reaches $22,344 in constant 1997 prices (Table 14.3 ). Comparing these figures with those for the lowest quintile, the extent of the (p.360)
Table 14.3. Average income, richest and poorest quintiles, 1997 (US$) Percentile Number of individuals Per capita disposable income Per capita GNP
The Impact of Financial Liberalization and the Rise of Financial Rents on Income Inequality: The Case of Turkey
Page 11 of 39
PRINTED FROM OXFORD SCHOLARSHIP ONLINE (www.oxfordscholarship.com). (c) Copyright Oxford University Press, 2018. All Rights Reserved. Under the terms of the licence agreement, an individual user may print out a PDF of a single chapter of a monograph in OSO for personal use (for details see www.oxfordscholarship.com/page/privacy-policy). Subscriber: Bilkent University Library; date: 13 December 2018
Percentile Number of individuals Per capita disposable income Per capita GNP First 5 3,406,030 12,927 22,344 Second 5 3,517,388 4,196 7,252 Third 5 3,562,951 3,193 5,519 Fourth 5 3,421,412 2,770 4,787 Average, top 20 13,907,781 5,726 9,898
The lowest 20 percentile
First 5 3,013,322 780 1,349 Second 5 2,926,201 694 1,200 Third 5 2,796,454 597 1,032 Fourth 5 2,155,066 465 803 Average, lowest 20 10,891,043 648 1,119 Source : SIS ( 1994 ).
income gap becomes more apparent: the lowest 20 percentile consists of 10.9 million individuals, with an average income of only $1119 per head. Among this group, 2.15 million individuals (the poorest 5 per cent) are known to have an income per capita of only $803.
Another facet of this income concentration in the urban sector is the increased wage gap between the skilled/organized and the unskilled/marginal segments of the labour force. Köse and Yeldan ( 1998 ) categorize ‘informal/marginal’ labour as that part of the employed labour force which is not officially registered for any social security coverage and also is not entitled under the ‘self employed or employer’ status. Based on the State Institute of Statistics Household Labour Survey data, they report that the ratio of marginal labour to total employment in industry increased from 41 per cent in 1980 to 49 per cent in 1994 and stabilized at around 44 per cent after 1995. This form of employment was found to be very extensive in traditional sectors like food processing, textiles and
clothing, wood and furniture, and metal products, where small enterprises have greater importance.
Wage data strongly suggest that the substantial improvement in average wages during 1989–93 was almost totally due to what was happening in the organized/formal sector. Wage gaps between large/small and public/private enterprises
widened significantly and exceeded the magnitude of the early 1980s. In particular, highly organized mining and electricity/ gas workers improved their relative economic positions significantly. In comparison to averages in manufacturing, wages in the clothing industry, on the other hand, eroded by 20 percentage points over the same period, falling below the 1981 level at the start of the liberalization programme
(Yentürk 1997 ; Köse and Yeldan 1998 ; Boratav et al . 2000 ). Given the extent of polarization indicated by these numbers, it is clear that ‘traditional’ explanations of income inequality, such as unequal access to education, unequal distribution of assets and land concentration, (p.361) and the urban-bias do not suffice to provide a coherent portrait of the
macroeconomic processes which have given rise to the outcome (see Chapter 1 ).
Even though easy generalizations can be misleading, one may nevertheless associate the rising income inequality with the broad tendency towards the marginalization of labour due to informal industrial relations, advances in new technologies which favour skill-intensive production patterns, and an unequivocal trend towards the disassociation of the financial sector from the productive sphere of the economy and the concomitant expansion of financial rents. A careful analysis along these lines necessitates a shift of focus towards the functional categories of income and the underlying processes of macro adjustment. The next section turns to these issues.
The Impact of Financial Liberalization and the Rise of Financial Rents on Income Inequality: The Case of Turkey
Page 13 of 39
PRINTED FROM OXFORD SCHOLARSHIP ONLINE (www.oxfordscholarship.com). (c) Copyright Oxford University Press, 2018. All Rights Reserved. Under the terms of the licence agreement, an individual user may print out a PDF of a single chapter of a monograph in OSO for personal use (for details see www.oxfordscholarship.com/page/privacy-policy). Subscriber: Bilkent University Library; date: 13 December 2018
14.3. MACROECONOMIC ADJUSTMENT UNDER FINANCIAL LIBERALIZATION AND THE RISE OF FINANCIAL RENTS
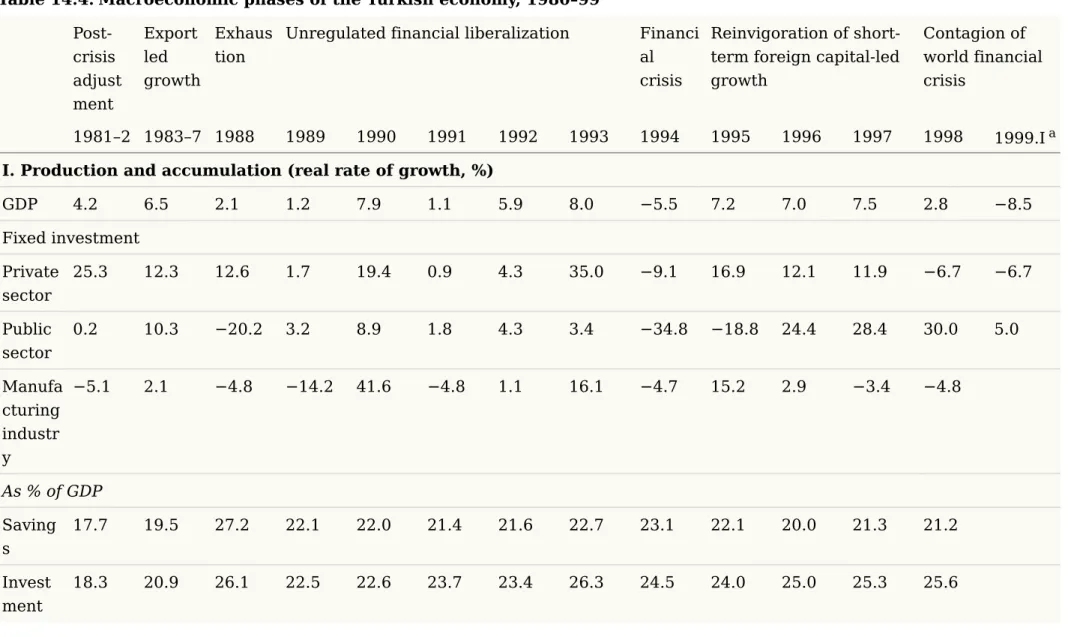
The Turkish economy experienced two distinct phases along the post-1980 adjustment path. The first covers broadly the period 1981–8, and its main characteristic is structural adjustment with export promotion, albeit under a foreign exchange system of regulated foreign capital inflows. During this period, integration in global markets was achieved mainly through commodity trade liberalization. More importantly, both the exchange rate and direct export subsidies were the main instruments for the promotion of exports and the pursuit of macroeconomic stability. The macroeconomic phases of the post-1980 Turkish economy are sketched in Table 14.4 . The table illustrates the various mechanisms of adjustment that have taken place in the spheres of production, distribution, and internationalization.
Three major cycles of adjustment–growth–recession/crisis are evident in Table 14.4 . First is the cycle of export orientation, 1981–7, followed by the recession of 1988. The second cycle, 1989–93, was generated by foreign capital inflows following the financial deregulation in 1989 and came to an end with the eruption of the 1994 financial crisis. Lastly, the post-1995 growth was short-circuited by the contagion of the East Asian and Russian crises after 1998. The underlying mode of
adjustment in the 1980s was the export orientation of
manufacturing industries. During the decade, export revenues increased at an annual rate of 15 per cent, and GNP rose per annum by 4.2 per cent in 1981–2 and by 6.5 per cent between 1983 and 1987. The depreciation of the currency exceeded the rate of domestic inflation for purposes of export promotion and attaining foreign balances, and the Turkish lira was caught in a declining trend in real terms until 1989.
Yet, the underlying feature of the 1981–8 period was the suppression of wages in an attempt to lower production costs and squeeze domestic absorption capacity. Indeed, one of the first measures of the military regime of 1980 was to regulate the labour market through political authoritarianism and the depoliticization and demobilization of the labour force (Cizre-Sakallioglu 1991 ; Yeldan 1995 ). With the imposition of the 1982 Constitution and new articles in the 1983 Labour Code,
the position of wage labour vis-à-vis capital commenced to erode severely throughout the decade. (p.362)
The Impact of Financial Liberalization and the Rise of Financial Rents on Income Inequality: The Case of Turkey
Page 15 of 39
PRINTED FROM OXFORD SCHOLARSHIP ONLINE (www.oxfordscholarship.com). (c) Copyright Oxford University Press, 2018. All Rights Reserved. Under the terms of the licence agreement, an individual user may print out a PDF of a single chapter of a monograph in OSO for personal use (for details see www.oxfordscholarship.com/page/privacy-policy). Subscriber: Bilkent University Library; date: 13 December 2018
Table 14.4. Macroeconomic phases of the Turkish economy, 1980–99
Post-crisis adjust ment Export led growth Exhaus tion
Unregulated financial liberalization Financi
al crisis
Reinvigoration of short-term foreign capital-led growth
Contagion of world financial crisis
1981–2 1983–7 1988 1989 1990 1991 1992 1993 1994 1995 1996 1997 1998 1999.I a
I. Production and accumulation (real rate of growth, %)
GDP 4.2 6.5 2.1 1.2 7.9 1.1 5.9 8.0 −5.5 7.2 7.0 7.5 2.8 −8.5 Fixed investment Private sector 25.3 12.3 12.6 1.7 19.4 0.9 4.3 35.0 −9.1 16.9 12.1 11.9 −6.7 −6.7 Public sector 0.2 10.3 −20.2 3.2 8.9 1.8 4.3 3.4 −34.8 −18.8 24.4 28.4 30.0 5.0 Manufa cturing industr y −5.1 2.1 −4.8 −14.2 41.6 −4.8 1.1 16.1 −4.7 15.2 2.9 −3.4 −4.8 As % of GDP Saving s 17.7 19.5 27.2 22.1 22.0 21.4 21.6 22.7 23.1 22.1 20.0 21.3 21.2 Invest ment 18.3 20.9 26.1 22.5 22.6 23.7 23.4 26.3 24.5 24.0 25.0 25.3 25.6
Post-crisis adjust ment Export led growth Exhaus tion
Unregulated financial liberalization Financi
al crisis
Reinvigoration of short-term foreign capital-led growth Contagion of world financial crisis 1981–2 1983–7 1988 1989 1990 1991 1992 1993 1994 1995 1996 1997 1998 1999.I a PSBR 3.7 4.7 4.8 5.2 7.4 10.3 10.6 12.1 7.9 5.2 8.8 7.6 8.7 Stock of domest ic debt 3.5 5.7 6.3 7.0 8.1 11.7 12.8 14.0 14.6 18.8 21.4 22.5 Interes t exp. on dom. debt 2.4 2.2 2.4 2.7 2.8 4.6 6.0 6.2 9.0 7.7 10.9
II. Distribution and prices
Inflatio n rate (CPI) 33.2 39.5 75.4 64.3 60.4 71.1 66.1 71.1 106.3 88.0 80.4 85.7 92.6 73.5 Deprec iation of TL/$ b 45.0 39.7 66.0 49.0 23.0 60.0 65.0 59.0 170.0 54.0 77.0 78.0 76.0 54.7
The Impact of Financial Liberalization and the Rise of Financial Rents on Income Inequality: The Case of Turkey
Page 17 of 39
PRINTED FROM OXFORD SCHOLARSHIP ONLINE (www.oxfordscholarship.com). (c) Copyright Oxford University Press, 2018. All Rights Reserved. Under the terms of the licence agreement, an individual user may print out a PDF of a single chapter of a monograph in OSO for personal use (for details see www.oxfordscholarship.com/page/privacy-policy). Subscriber: Bilkent University Library; date: 13 December 2018
Post-crisis adjust ment Export led growth Exhaus tion
Unregulated financial liberalization Financi
al crisis
Reinvigoration of short-term foreign capital-led growth Contagion of world financial crisis 1981–2 1983–7 1988 1989 1990 1991 1992 1993 1994 1995 1996 1997 1998 1999.I a Real interes t rate on GDIs c −5.8 −2.7 24.0 5.3 13.9 9.9 28.6 18.1 31.1 22.1 15.8 32.6
Real wage growth rate (manufacturing)
Private d 0.4 −1.5 −5.7 16.1 22.2 20.2 −5.4 −0.1 −30.1 1.4 −1.4 −8.2 3.3 Public −0.4 −5.9 −7.8 47.5 18.8 37.1 5.8 −0.9 −18.1 −18.0 6.0 Averag e mark-up rate, private manufa cturing (%) 31.0 32.6 38.0 33.5 38.6 39.1 41.5 43.9 47.0 42.0 39.0
Post-crisis adjust ment Export led growth Exhaus tion
Unregulated financial liberalization Financi
al crisis
Reinvigoration of short-term foreign capital-led growth Contagion of world financial crisis 1981–2 1983–7 1988 1989 1990 1991 1992 1993 1994 1995 1996 1997 1998 1999.I a Private manufa cturing 30.0 24.2 20.0 24.0 25.0 27.0 25.0 25.0 20.0 18.0 23.0 Public manufa cturing 27.0 22.2 15.0 20.0 25.0 31.0 37.0 34.0 29.0 20.0 22.0 III. Internationalization Man. export, growth e 19.7 12.5 14.0 −1.0 11.0 4.0 8.0 4.0 18.0 19.0 7.2 6.7 1.3 As % share of GNP Import s f 14.0 15.9 15.8 14.5 14.6 13.8 14.3 16.2 17.8 20.8 23.6 25.2 22.9 Exports f 8.5 10.8 12.8 10.7 8.5 8.9 9.2 8.4 13.8 12.6 17.8 17.1 15.7 Curren t −2.7 −1.9 1.8 0.9 −1.7 0.2 −0.6 −3.6 2.0 −1.4 −1.3 −1.4 1.4
The Impact of Financial Liberalization and the Rise of Financial Rents on Income Inequality: The Case of Turkey
Page 19 of 39
PRINTED FROM OXFORD SCHOLARSHIP ONLINE (www.oxfordscholarship.com). (c) Copyright Oxford University Press, 2018. All Rights Reserved. Under the terms of the licence agreement, an individual user may print out a PDF of a single chapter of a monograph in OSO for personal use (for details see www.oxfordscholarship.com/page/privacy-policy). Subscriber: Bilkent University Library; date: 13 December 2018
Post-crisis adjust ment Export led growth Exhaus tion
Unregulated financial liberalization Financi
al crisis
Reinvigoration of short-term foreign capital-led growth Contagion of world financial crisis 1981–2 1983–7 1988 1989 1990 1991 1992 1993 1994 1995 1996 1997 1998 1999.I a accoun t f Foreign debt 27.1 37.8 44.8 38.8 32.5 33.6 35.2 37.7 49.6 42.8 46.1 47.8 51.7
( a) Annual % rate of change from the same period of the previous year. ( b) According to the $1.5 +1 euro basket.
( c) Annual average compounded interest rate on government debt instruments deflated by the CPI. ( d) Private manufacturing labour data pertain to enterprises employing 10 or more workers.
( e) Annual growth rate in manufacturing exports (millions, $). ( f) Inclusive of the luggage trade after 1996.
Sources : State Planning Organization and Undersecretariat of Foreign Trade and Treasury data on main economic indicators and
(p.363) (p.364) As soon as it assumed power, the military government shut down the major labour union confederations, and trade unions were barred from engaging in political activity and establishing formal and informal links with political parties. With the new Labour Code of 1983, the right to strike was severely restricted and was limited only to collective bargaining disputes. Even then, a strike could be prohibited or postponed, and any dispute could be settled from the outside by a newly formed body called the Supreme Board of Arbitration. Through this body, the state exercised strict control and supervision over labour relations and regulated the evolution of wage demands effectively.
Consequently, the share of wage labour in private manufacturing value added receded from 30 per cent to 20 per cent and in public manufacturing from 27 per cent to 15 per cent between 1980 and 1988. In this process, the average mark-up rate (profit margins) in private manufacturing increased from 31 per cent to 38 per cent (Table 14.4 ).
The other side of this distributional shift was the rise in financial rents. With the advent of the deregulation of
domestic financial markets and the liberalization of the capital account, the Turkish economy had completed its integration with global financial markets by 1989. In this setting, the central bank lost its overall control over the exchange rate and the interest rate as instruments of independent policy-making, as these practically turned into exogenous parameters set by the chaotic changes in financial arbitrage in global markets. Financial liberalization was expected to achieve a more efficient and flexible financial system capable of converting national savings into productive investments at the lowest cost. Contrary to what was expected, however, the reforms were not accompanied by any significant change in the financing behaviour of corporations and did not lead to lower investment costs (Akyüz 1990 ). The state maintained its dominance in both commodity and asset markets through its complex system of price and fiscal incentives. The real rate of interest, in fact, rose to unprecedented levels, and domestic asset markets, impacted by sudden changes in speculative foreign capital flows, became volatile and uncertain.
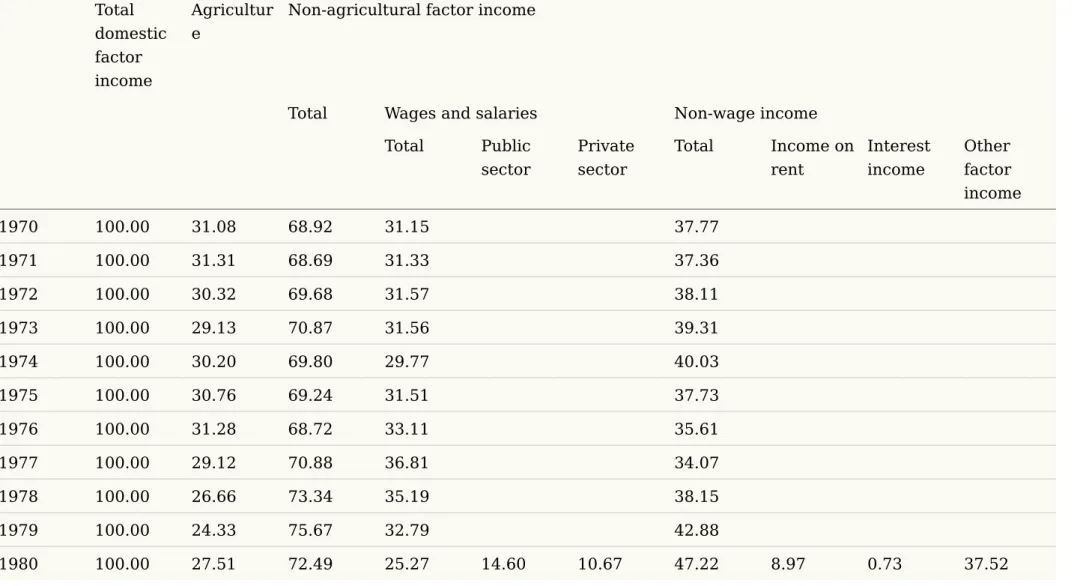
Table 14.5 documents the distributional consequences of the post-1980 financial deregulation. The share of interest income in total domestic income rose from close to zero in 1980 to 15.2 per cent by 1998, a figure similar to the total value added
The Impact of Financial Liberalization and the Rise of Financial Rents on Income Inequality: The Case of Turkey
Page 21 of 39
PRINTED FROM OXFORD SCHOLARSHIP ONLINE (www.oxfordscholarship.com). (c) Copyright Oxford University Press, 2018. All Rights Reserved. Under the terms of the licence agreement, an individual user may print out a PDF of a single chapter of a monograph in OSO for personal use (for details see www.oxfordscholarship.com/page/privacy-policy). Subscriber: Bilkent University Library; date: 13 December 2018
of agriculture—a sector that employs 45 per cent of the civilian labour force.
From a longer time perspective, the overall decline of agricultural and wage income is phenomenal. The share of agricultural income has been reduced by almost half in the course of the last three decades. The wage cycle, on the other hand, displayed a rising trend in the 1970s and followed a declining course during the outward orientation of the domestic economy in the 1980s. The income share of non-agricultural wages reached its lowest level in 1986 at 17.1 per cent from the peak of 36.8 per cent realized in 1977. A fall of such magnitude clearly reflected the faltering employment response of domestic industry to significant reductions in real wages. The implication is that the scope for capital–labour substitution has been greatly limited in the productive sectors of the Turkish economy (Celasun 1989 : 20). Given this
background, it would be illuminating to trace out the dynamics of the real earnings of wage labour (p.365)
Table 14.5. The functional distribution of domestic factor income, 1970–98 (percentage) Total domestic factor income Agricultur e
Non-agricultural factor income
Total Wages and salaries Non-wage income
Total Public sector Private sector Total Income on rent Interest income Other factor income 1970 100.00 31.08 68.92 31.15 37.77 1971 100.00 31.31 68.69 31.33 37.36 1972 100.00 30.32 69.68 31.57 38.11 1973 100.00 29.13 70.87 31.56 39.31 1974 100.00 30.20 69.80 29.77 40.03 1975 100.00 30.76 69.24 31.51 37.73 1976 100.00 31.28 68.72 33.11 35.61 1977 100.00 29.12 70.88 36.81 34.07 1978 100.00 26.66 73.34 35.19 38.15 1979 100.00 24.33 75.67 32.79 42.88 1980 100.00 27.51 72.49 25.27 14.60 10.67 47.22 8.97 0.73 37.52
The Impact of Financial Liberalization and the Rise of Financial Rents on Income Inequality: The Case of Turkey
Page 23 of 39
PRINTED FROM OXFORD SCHOLARSHIP ONLINE (www.oxfordscholarship.com). (c) Copyright Oxford University Press, 2018. All Rights Reserved. Under the terms of the licence agreement, an individual user may print out a PDF of a single chapter of a monograph in OSO for personal use (for details see www.oxfordscholarship.com/page/privacy-policy). Subscriber: Bilkent University Library; date: 13 December 2018
Total domestic factor income Agricultur e
Non-agricultural factor income
Total Wages and salaries Non-wage income
Total Public sector Private sector Total Income on rent Interest income Other factor income 1981 100.00 25.27 74.73 22.28 11.86 10.42 52.45 8.04 3.54 40.87 1982 100.00 23.52 76.48 20.09 10.17 9.92 56.39 8.13 5.35 42.91 1983 100.00 22.14 77.86 22.02 10.98 11.04 55.84 8.15 5.41 42.28 1984 100.00 22.43 77.57 19.37 9.58 9.79 58.20 7.56 7.68 42.96 1985 100.00 21.17 78.83 17.40 8.49 8.91 61.43 7.78 6.74 46.91 1986 100.00 21.03 78.97 17.08 8.32 8.76 61.89 7.24 7.01 47.64 1987 100.00 19.19 80.81 20.39 9.43 10.96 60.42 6.26 7.80 46.36 1988 100.00 18.58 81.42 20.91 9.10 11.81 60.51 4.80 8.89 46.82 1989 100.00 18.20 81.80 24.07 12.37 11.70 57.73 3.92 5.90 47.91 1990 100.00 19.07 80.93 28.11 15.02 13.09 52.82 3.39 5.79 43.64 1991 100.00 16.35 83.65 33.78 18.27 15.51 49.87 3.76 8.44 37.67 1992 100.00 15.97 84.03 34.42 19.43 14.99 49.61 3.84 7.95 37.82 1993 100.00 16.77 83.23 33.29 19.10 14.19 49.94 3.38 6.97 39.59
Total domestic factor income Agricultur e
Non-agricultural factor income
Total Wages and salaries Non-wage income
Total Public sector Private sector Total Income on rent Interest income Other factor income 1994 100.00 16.70 83.30 27.50 15.47 12.03 55.80 3.23 8.62 43.95 1995 100.00 17.18 82.82 24.56 12.68 11.88 58.26 3.24 11.61 43.41 1996 100.00 18.34 81.66 26.81 12.28 14.53 54.85 3.08 14.71 37.06 1997 100.00 15.73 84.27 29.45 13.50 15.95 54.82 3.10 14.40 37.32 1998 100.00 18.51 81.49 27.44 13.83 13.61 54.05 3.38 15.17 35.50
The Impact of Financial Liberalization and the Rise of Financial Rents on Income Inequality: The Case of Turkey
Page 25 of 39
PRINTED FROM OXFORD SCHOLARSHIP ONLINE (www.oxfordscholarship.com). (c) Copyright Oxford University Press, 2018. All Rights Reserved. Under the terms of the licence agreement, an individual user may print out a PDF of a single chapter of a monograph in OSO for personal use (for details see www.oxfordscholarship.com/page/privacy-policy). Subscriber: Bilkent University Library; date: 13 December 2018
against (labour) productivity growth over an extended time horizon. In what follows, recent advances in the business cycle literature are employed, and the variations in the average product of labour and the real wage rate in Turkish industry are decomposed to obtain the underlying long-term trends. Hodrick–Prescott ( 1980 ) filtering methods are used to separate out the cyclical variations in productivity growth and wage rates from their respective historical trends. This exercise enables us to isolate the underlying trend paths of the two variables and to make inferences about the evolution of the wage cycle against the long-term productivity patterns in Turkish industry.
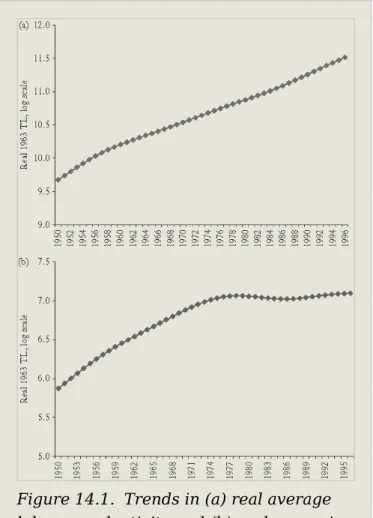
Data for our analysis come from the annual manufacturing industry surveys reported by the State Institute of Statistics. For the ‘wage rate’ series, ‘total wage earnings’ divided by ‘total workers engaged in production’ are used. The average labour (p.366)
Figure 14.1. Trends in (a) real average labour productivity and (b) real wages in Turkish manufacturing, 1950–96
product is derived by dividing ‘total value added’ by the same labour employment magnitude. Both series are deflated by the wholesale price index and are filtered in logarithmic form. The exercise covers the extended time frame, 1950–96. The results of the filter are portrayed in Figs. 14.1(a) and 14.1(b) . The units on the y -axis are in real (p.367) 1963 TL in log scale. In Fig. 14.1(a) , we observe the historical long-term trend of the real average labour product in Turkish manufacturing. The trend has a secular upward slope, with an average rate of annual growth of 3.8 per cent for the whole time horizon (1950–96). This is to be contrasted with the trend in the real wage rate portrayed in Fig. 14.1(b) . The trend in real wages fluctuates along an increasing path until the mid-1970s, enters a deceleration between 1980 and 1988, and recovers after 1989. The observed recovery in the real wage is clearly the result of post-1989 populism, which enabled sharp increases in real wages between 1989 and 1993, as outlined in Section 14.4 . On this record of events, it seems plausible to argue that the post-1989 upswing in manufacturing real wages was, in fact, in line with the real average product of labour as far as the long-term trends of the two series are concerned. 4
Consequently, the fluctuations in the real wage trend document the periodization of the overall political cycle affecting Turkish labour markets. The fundamental
characteristic of this cycle is that it discloses a relatively weak connection between wage remunerations and labour
productivity in manufacturing industries. The trend path of real wages clearly signals a break following 1979/80. This is the era when the domestic economy was subjected to a new transformation in terms of foreign competition and integration with global commodity and asset markets. The ongoing wage suppression as manifested by the downswing in the wage cycle indicates that the adjustments in labour markets had served as one of the main mechanisms to bring forth this transformation. Implemented under a military rule which imposed severe restrictions through the Labour Code on collective bargaining and unionization, the cost savings on wage labour were
instrumental in extracting an economic surplus which, in turn, was oriented towards export markets via a generous export subsidization programme.
Reading from a different perspective, the sharp contrast in the trend in labour productivity against real wage earnings
following the 1980 transformation clearly displays the extent of disassociation between the productive sphere of the
The Impact of Financial Liberalization and the Rise of Financial Rents on Income Inequality: The Case of Turkey
Page 27 of 39
PRINTED FROM OXFORD SCHOLARSHIP ONLINE (www.oxfordscholarship.com). (c) Copyright Oxford University Press, 2018. All Rights Reserved. Under the terms of the licence agreement, an individual user may print out a PDF of a single chapter of a monograph in OSO for personal use (for details see www.oxfordscholarship.com/page/privacy-policy). Subscriber: Bilkent University Library; date: 13 December 2018
commodity and financial markets intensified, the links between the processes of savings generation and the
productive use of these funds for capital accumulation—the so-called ‘process of intermediation’—were severed. With the complete deregulation of financial transactions and the
consequent ascendancy of finance over industry, international capital was able to assume a dominant role so as to act as the sole arbiter, aiming at immediate financial gain rather than at long-term economic development and sustainable growth. As this unbalanced structure failed to generate the necessary accumulation patterns to achieve sustained growth, the impetus for it was exhausted by the end of the decade. The artificial growth path generated through wage suppression and price subsidies reached its economic and political limits by 1988. As summarized in Table 14.4 , all economic indicators for 1988 signal a stagflationary macro environment. The rate of GDP growth was only 2.1 per cent, the rate of growth of fixed investments was negative, and the inflation rate accelerated to 75 per cent. Furthermore, the real exchange rate had started to appreciate for the first time since the inception of export orientation.
(p.368) Commensurate with these events, we observe real wage earnings entering a period of recovery following the gains of the union movement and also the new wave of populist pressures. As can be seen from the data in Table 14.4 , real wages in public manufacturing increased by 47.5 per cent in 1988 and then again by 37.1 per cent in 1991. Similar trends were observed in the private manufacturing sector as real wage costs increased by 16.1 per cent in 1989, 22.2 per cent in 1990, and 20.2 per cent in 1991.
Furthermore, the rural economy witnessed a significant improvement in its terms of trade vis-à-vis the rest of the economy. This occurred despite an ongoing process of worsening agricultural terms of trade in world markets, a contrasting signal in favour of the rural economy. Finally, beginning in 1989, there was a major shift in public expenditure towards more socially desirable activities. An overall increase in both the share and the level of public salaries and investments in social infrastructure enabled the working masses to attain improved living standards.
14.4. THE RISING FISCAL GAP AND THE ROLE OF THE STATE IN REGULATING THE DISTRIBUTIONAL
STRUCTURE
The post-1990 balances in the public sector record an unprecedented rise in the fiscal gap. In contrast, post-1988 populism could evidently be financed by taxing capital incomes and moving towards a fairer tax burden for the working classes. Yet, the strategic preference of the state was the maintenance of its favourable stance towards the evasion of taxable capital incomes and towards surplus transfer
because of a lax attitude towards so-called ‘unrecorded private transactions’. Consequently, the state apparatus turned into a bastion of privilege as it assumed a regulatory role in the creation and absorption of the economic surplus, and fiscal balances took the major brunt of adjustment. The main macroeconomic policy response to increased wage costs and the shift in the rural terms of trade involved the rapid
widening of the fiscal gap and support for the profitability of private capital. As a major indicator of the (functional) distribution of income, for instance, profit margins mark-up rate maintained a rising trend, and, despite the severe jump in real wage costs, reached 47 per cent in 1994, up from 33.5 per cent in 1989. Simultaneous to this development was the rapid rise of the borrowing requirement of the public sector, as the ratio of the PSBR to GDP climbed to 10.3 per cent in 1991 and 12.1 per cent in 1993 (Table 14.4 ).
Given all this, the widening fiscal deficit and the
macroeconomic disequilibria it generated clearly should be understood in the context of the historical role of the state in sustaining capital incomes against the faltering performance of export-led growth patterns along with rapid increases in the costs of wage labour. The fiscal deficit of the Turkish state in the early 1990s does not necessarily imply a chronic problem of bureaucratic mismanagement, but is a reflection of the administrative and socio-economic policies on the part of the public sector that were deemed necessary to sustain the generation of an economic surplus for private capital. The state used its tax and subsidy policies as well as the prices of the goods produced by state enterprises as strategic
instruments to this end and financed its fiscal deficits via forced savings by (p.369) way of price inflation and
increased securitization of domestic debt through short-term capital inflows. 5 With this approach, however, the stock of
The Impact of Financial Liberalization and the Rise of Financial Rents on Income Inequality: The Case of Turkey
Page 29 of 39
PRINTED FROM OXFORD SCHOLARSHIP ONLINE (www.oxfordscholarship.com). (c) Copyright Oxford University Press, 2018. All Rights Reserved. Under the terms of the licence agreement, an individual user may print out a PDF of a single chapter of a monograph in OSO for personal use (for details see www.oxfordscholarship.com/page/privacy-policy). Subscriber: Bilkent University Library; date: 13 December 2018
short time span of a decade, from about 6 per cent of GNP in 1989, just when the liberalization of the capital account was completed, to 22 per cent in 1998.
A key characteristic of the Turkish domestic debt was its short-term maturity. As a ratio of the stock of existing debt, annual cumulative domestic borrowings increased over the 1990s and reached 103 per cent in 1993, indicating that each year the state had to resort to new borrowing which exceeded the stock of debt already accumulated. In 1996, this ratio reached 163.5 per cent. Even though the ratio seems to have declined over 1997, provisional indicators for 1998 and 1999 reveal that it again surpassed the 100 per cent threshold. 6 Thus, the public sector has been trapped in a short-term debt spiral, a phenomenon called ‘Ponzi-financing’. Under these conditions, and given the fragility of the domestic asset markets, real interest rates rose to very high levels and, as a result, interest payments on the public debt rose from 2 per cent of GNP in 1990 to 4.6 per cent in 1993 and 14.1 per cent by the end of 1999.
On the other hand, the obligation to generate a surplus in the primary budget led to severe retrenchment in the remaining public expenditure items. The major brunt of the adjustment fell on public investment expenditure that was reduced to only 4.6 per cent of total budgetary outlays by the third quarter of 1998. By comparison, the interest payments on the domestic debt reached 1010 per cent of public investments and 481 per cent of social security transfers in the same year. In other words, the Turkish central budget lost in the 1990s all its function as an instrument of social infrastructure development and economic growth, and was transformed into a tool of financial sector development, regulating the distribution of the economic surplus in the domestic asset market in ways which favour the financial rentiers and private capital owners.
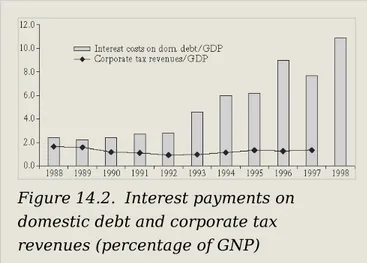
The extent of this regulatory role can be more clearly grasped when account is taken of the amount of income taxes
generated by capital incomes (Fig. 14.2 ). By comparing the interest costs of the state and the tax earnings from capital incomes, one can see the extent of the transfer accruing to the rentier classes through the debt management operations of the treasury. As a ratio of GNP, interest payments on domestic debt had exceeded 10 per cent by the end of the decade.
However, the tax burden on the incomes of the corporate sector had reached a maximum of only 1.7 per cent over the same period.
It can be seen that capital incomes effectively remain untaxed in Turkey, and as the treasury offered sizable premiums on the market yields of its instruments, it became (p.370)
the
dominant agent in the financial economy, enabling the banking system to capture significant returns based on the arbitrage of open positions. Consequently, the current mode of domestic debt management through securitization works as a direct income transfer to the commercial banking sector and the rentier classes, with the state playing an active role in regulating this transfer.
The distribution of the government debt instruments shows that in early 1997 more than 92 per cent of the newly
securitized deficit was purchased by the banking sector, with the private and public sectors absorbing respectively another 4 and 3 per cent each. Thus, the so-called ‘deepening’ of the financial system in the Turkish economy has turned into a process of self-fuelled cycles ready to burst. High real interest rates on the GDIs attract speculative short-term funds, and, through the operations of the banking system, these are channelled to the vaults of the treasury. In this manner, the latter was able to bypass the regulations of the central bank, as well as the limits imposed on foreign borrowing. Capital account liberalization has, thus, served the government by enabling banks to engage in extremely profitable short-term borrowing abroad so as to finance the treasury's bond
Figure 14.2. Interest payments on domestic debt and corporate tax revenues (percentage of GNP)
The Impact of Financial Liberalization and the Rise of Financial Rents on Income Inequality: The Case of Turkey
Page 31 of 39
PRINTED FROM OXFORD SCHOLARSHIP ONLINE (www.oxfordscholarship.com). (c) Copyright Oxford University Press, 2018. All Rights Reserved. Under the terms of the licence agreement, an individual user may print out a PDF of a single chapter of a monograph in OSO for personal use (for details see www.oxfordscholarship.com/page/privacy-policy). Subscriber: Bilkent University Library; date: 13 December 2018
auctions. The major brunt of the costs of this fragile
environment, however, has fallen on the productive sphere of the economy, especially the traded sector.
Indeed, throughout the course of these operations, Turkey's banking sector and financial institutions disengaged from investing in production and became the dominant player in manipulating the overall economy. Initially, it was the collapse in public revenue which led to feverish public sector
borrowing. The consequent high interest rates on government bonds and Treasury bills set the course for the dominance of finance over the real economy. As a result, the economy is now trapped in a vicious circle: commitment to high interest rates and cheap foreign currency (overvalued TL) against the threat of capital flight leads to further increases in real interest rates. When (p.371) the adverse impacts on the current account balance become excessively destabilizing, real depreciation seems imminent, which, however, needs to be matched by further upward adjustment in the interest rate if currency substitution or capital flight is to be restrained. This process, as in the case of Mexico in 1994 and the recent crises in East Asia (on this, see Chapter 7 ), leads to overvaluation of the domestic currency and the cheapening of imports and, thus, to an acceleration of domestic consumption demand at the
expense of exports and the real productive industries in general.
Erratic movements in the current account, a rising trade deficit (from 3.5 per cent of GNP in 1985–8 to 6 per cent in 1990–3) and a drastic deterioration in fiscal balances reveal the unsustainable character of the post-1989 populism
financed by foreign capital inflows. In the words of Boratav et
the post-1990 Turkish experience shows the serious problems confronting a developing economy which decides to move into full external and internal
deregulation in the financial system under conditions of high inflation. The specter of capital flight becomes the dominant motive in policy-making and creates
commitment to high interest rates and expectations for cheap foreign exchange. The links of these two policy variables with the real sphere of the economy, i.e. investment on physical capital and the current account balance of payments, are deeply severed. Instability in the rates of foreign exchange and interest rates creates feedbacks which lead the economy into further
instability.
This prolonged instability reached its climax during the fourth quarter of 1993, when currency appreciation and the
consequent current account deficits rose to unprecedented levels. With the sudden drainage of short-term funds in the beginning of January 1994, production capacity contracted, followed by a continued fall in industrial output throughout that year. Together with this contraction, post-1994 crisis management gave rise to significant shifts in income
distribution and to an intensification of the ongoing process of the transfer of the economic surplus towards the financial sector and away from wage labour and the industrial sectors. Likewise, dollar-denominated wage costs decreased
substantially and enabled export earnings to rise. In this manner, Turkey switched once again to a mode of surplus extraction, whereby the export performance of industrial sectors and the burden of macroeconomic adjustment depended on savings on the wage bill. In fact, the
disequilibrium could only have been accommodated by the massive (downward) flexibility displayed in real remunerations of wage labour.
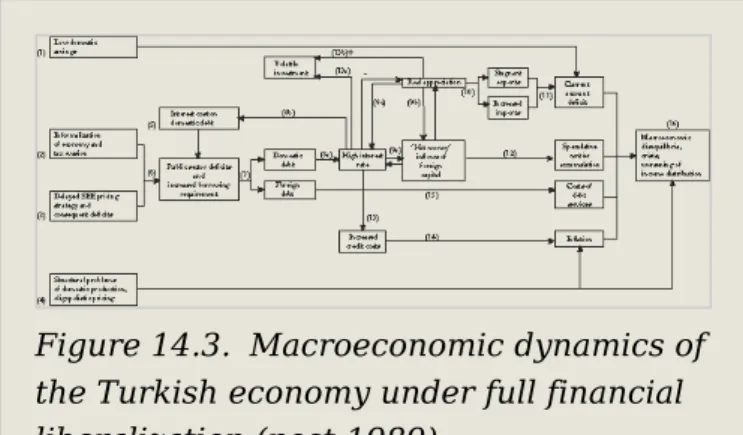
As an overall summary of the dynamics of the post-financial liberalization, Fig. 14.3 characterizes schematically the main mechanisms of macroeconomic regulation in Turkey. Low savings, along with a large fiscal gap, and structural
deficiencies in an oligopolistic production structure set the scene portrayed in Fig. 14.3 . Low savings generation results directly in disequilibrium in the macroeconomic environment along channel (1). An important addition to the features of the
The Impact of Financial Liberalization and the Rise of Financial Rents on Income Inequality: The Case of Turkey
Page 33 of 39
PRINTED FROM OXFORD SCHOLARSHIP ONLINE (www.oxfordscholarship.com). (c) Copyright Oxford University Press, 2018. All Rights Reserved. Under the terms of the licence agreement, an individual user may print out a PDF of a single chapter of a monograph in OSO for personal use (for details see www.oxfordscholarship.com/page/privacy-policy). Subscriber: Bilkent University Library; date: 13 December 2018
populist stance within the background of intensified political struggle. In response to these structural characteristics, we observe that the state assumed an active role in the economic sphere, regulating the distribution of national output.
(p.372) (p.373) The state carried out this task, first, through its enterprise system by way of a mandated policy of delayed price adjustments on
intermediate, wage, and capital goods produced by state enterprises (Fig. 14.3 , box 3). Second, following the full deregulation of the capital account, the state actively
participated in domestic asset markets through the issuance of debt instruments (channels 6 and 7). This, together with the threat of currency substitution in the context of a convertible currency regime, necessitated high interest rates (channels 8a and 8b)—the first vicious circle—and real appreciation
(channel 9b). The second vicious circle surrounding channels (9a), (9b), and (9c) is highlighted by the contradictory
implications of the three variables involved: short-term capital inflows (hot money), real appreciation, and high real interest rates. Real appreciation was the prime cause of the rise in import volumes and the current account deficits. On the other hand, real appreciation had a direct positive effect on
investment demand by reducing the costs of imported capital goods and intermediates (channel 13b). This positive effect was countervailed by the pressures of real interest rates (channel 13a), the result being increased volatility in investment demand. High interest rates gave way to
inflationary pressures through the increased costs of credit (channels 8b and 13) and fed a speculative rentier type of accumulation (channel 12), with the consequent worsening in income distribution. The limits of this bonanza of a short-term
Figure 14.3. Macroeconomic dynamics of the Turkish economy under full financial liberalization (post-1989)
foreign capital-led growth pattern was the eruption of the financial crisis in 1994 and the continued fragility and the severe disequilibria faced by domestic markets in the late 1990s.
Clearly, the reform fatigue and exhaustion of the 1988 crisis and the unsustainability of the post-1989 growth path which culminated in the crisis in 1994 and the current crises have been characterized by the operation of quite different macro dynamics. Throughout all these episodes, however, in spite of the official stance towards a policy of ‘reducing the economic role of the state’, we observe continued use of the state's powers as a regulatory agent, overseeing the distributional conflict over the national product.
14.5. CONCLUDING COMMENTS AND OVERALL ASSESSMENT
This chapter has attempted to investigate and assess the impact of financial liberalization and the ongoing rise of
financial rents on income distribution in the post-1980 Turkish economy. The data on the size distribution of income and on the long-run dynamics of real wages against labour
productivity disclose a worsening in income distribution. They also disclose an overall disengagement of financial institutions from the productive sphere to become the dominant agent in the manipulation of the domestic economy. As financial capital gained supremacy over industry, the links between growth and productivity gains and the channelling of savings to the
accumulation of productive capital were severely hampered, with adverse consequences for wage incomes and the working poor. These findings are in stark contrast with the predictions of the standard theory which argues that the expected
productivity gains associated with increased liberalization and competition in global commodity and financial markets would translate into increased wages within the labour-intensive sectors in which Turkey was said to hold comparative
advantage. Our findings thus underscore that, given the poor vertical integration among industrial sectors typical of
peripheral (p.374) capitalism, the implementation of vigorous export promotion polices and state-led price incentives created sporadic increases in productivity in the 1980s, but failed to generate a sustained increase in economic growth and accumulation.
The Impact of Financial Liberalization and the Rise of Financial Rents on Income Inequality: The Case of Turkey
Page 35 of 39
PRINTED FROM OXFORD SCHOLARSHIP ONLINE (www.oxfordscholarship.com). (c) Copyright Oxford University Press, 2018. All Rights Reserved. Under the terms of the licence agreement, an individual user may print out a PDF of a single chapter of a monograph in OSO for personal use (for details see www.oxfordscholarship.com/page/privacy-policy). Subscriber: Bilkent University Library; date: 13 December 2018
The Turkish adjustment experience throughout the post-1980 period has been a process in which, in a developing market economy trapped by the needs of its domestic industry to integrate into the world markets and the distributional requirements warranted by this reorientation, the state apparatus became a bastion of privilege, regulating income redistribution within society. The elements of this
redistribution involved direct mechanisms to subsidize production and exports, currency depreciation, and wage suppression, as well as indirect mechanisms such as tax evasion on capital incomes and a financial market
development strategy that enabled massive income transfers to the rentier class.
References
Bibliography references:
Akyüz, Y. (1990). Financial system and policies in Turkey in the 1980s. In T. Aricanli and D. Rodrik (eds.), The Political
Economy of Turkey . Macmillan: London.
Atkinson, A. (1998a ). Equity issues in a globalizing world: The experience of OECD countries. Paper prepared for the
Conference on Economic Policy and Equity, June, IMF: Washington, DC.
—— (1998b ). The changing distribution of income: Evidence and explanations. Mimeo, University of Linz: Linz.
Barro, R. J. (1999). Inequality, growth and investment, NBER Working Papers 7038, National Bureau of Economic Research, Cambridge, MA.
Boratav, K. (1991). Social Classes and Distribution in the
1980s . Gerçek Yayinevi, Istanbul, in Turkish.
—— and O. Türel (1993). Turkey. In L. Taylor (ed.), The Rocky
Road to Reform . MIT Press: Cambridge, MA.
——, ——, and E. Yeldan (1995). The Turkish economy in 1981– 92: A balance sheet, problems and prospects. METU Studies in
——, ——, and —— (1996). Dilemmas of structural adjustment and environmental policies under instability: Post-1980 Turkey.
World Development 24(2), 373–93.
——, E. Yeldan, and A. Köse (2000). Globalization, distribution and social policy: Turkey, 1980–1998. Project Papers 20, CEPA-New School: CEPA-New York.
Bourdieu, P. (1998). The essence of neoliberalism. Le Monde Diplomatique December.
Bulutay, T., S. Timur, and H. Ersel (1971). Distribution of
Income in Turkey, 1968 . Ankara University, Ankara, in
Turkish.
Celasun, M. (1989). Income distribution and employment aspects of Turkey's post-1980 adjustment. METU Studies in
Development 16(3–4), 1–31.
—— (1994). Trade and industrialization in Turkey: Initial conditions, policy and performance in the 1980s. In G. K. Helleiner (ed.), Trade Policy and Industrialization in Turbulent
Times . Routledge: London.
—— and D. Rodrik (1989). Debt, adjustment and growth: Turkey. In J. Sachs and S. M. Collins (eds.), Developing
Country Debt and Economic Performance, Country Studies .
University of Chicago Press: Chicago.
Cizre-Sakallioglu, Ü. (1991). Labour: The battered community. In M. Heper (ed.), Strong State and Economic Interest Groups:
The Post-1980 Turkish Experience . de Gruyter: New York.
(p.375) Cornia, G. A., and S. Kiiski (1999). Trends in income distribution in the post-World War II period: Evidence and interpretation. Paper prepared for the WIDER project meeting Rising Income Inequality and Poverty Reduction: Are They Compatible? July, UNU/WIDER, Helsinki.
Ekinci, N. (1998). Dynamics of growth and crisis in the Turkish economy. Toplum ve Bilim 77, in Turkish.
Hodrick, R. J. and E. C. Prescott (1980). Postwar US business cycles: An empirical investigation. Discussion Papers 451. Carnegie-Mellon University: Pittsburgh.
The Impact of Financial Liberalization and the Rise of Financial Rents on Income Inequality: The Case of Turkey
Page 37 of 39
PRINTED FROM OXFORD SCHOLARSHIP ONLINE (www.oxfordscholarship.com). (c) Copyright Oxford University Press, 2018. All Rights Reserved. Under the terms of the licence agreement, an individual user may print out a PDF of a single chapter of a monograph in OSO for personal use (for details see www.oxfordscholarship.com/page/privacy-policy). Subscriber: Bilkent University Library; date: 13 December 2018
Köse, A. H., and E. Yeldan (1998). Turkish economy in 1990s: An assessment of fiscal policies, labor markets and foreign trade. New Perspectives on Turkey 18, 51–78.
Milanovic, B. (1999). True world income distribution, 1988 and 1993: First calculations based on household surveys alone. Mimeo, World Bank: Washington, DC.
Monthly Statistics (various). Undersecretariat of foreign trade
and treasury, Turkish prime ministry, Ankara.
Onaran, O. (1999). The effects of structural adjustment policies on the labour market and income distribution in Turkey. Ph.D. thesis, Istanbul Technical University: Istanbul. Ozmucur, S. (1986). Income distribution in Turkey 1963–85.
Iktisat Dergisi , 258, 26–32, in Turkish.
Rodrik, D. (1997). Has Globalization Gone Too Far? Institute for International Economics: Washington, DC.
—— (1998). Globalization, social conflict and economic growth. The World Economy 21(2), 143–58.
Senses, F. (1994). Labour market response to structural adjustment and institutional pressures: The Turkish case.
METU Studies in Development 21(3), 1–26.
SIS (various). Annual Manufacturing Industry Surveys . State Institute of Statistics: Ankara.
—— (1987). Household Survey of Income Distribution . State Institute of Statistics: Ankara.
—— (1994). Household Survey of Income Distribution . State Institute of Statistics: Ankara.
SPO (1973). Income distribution in Turkey. Mimeo, State Planning Organization: Ankara.
Tansel, A. (1999). Public–private employment choice, wage differentials and gender in Turkey, Discussion Papers 797. Economic Growth Centre, Yale University: New Haven. Temel, A., and associates (1999). Functional distribution of income in Turkey. Mimeo, State Planning Organization: Ankara.
UNCTAD (1997). Trade and Development Report . UNCTAD: Geneva.
Uygur, E. (1993). Financial Liberalization and Economic
Performance of Turkey . Central Bank of Turkey: Ankara.
Voyvoda, E., and E. Yeldan (1999). Patterns of productivity growth and the real wage cycle in Turkish manufacturing. Discussion Paper 99–11. Department of Economics, Bilkent University: Ankara.
Yeldan, E. (1995). Surplus creation and extraction under structural adjustment: Turkey, 1980–1992. Review of Radical
Political Economics 27(2), 38–72.
—— (1996a ). Macroeconomic processes determining the distribution of income in the post-1980 Turkish economy.
Iktisat Dergisi 359, 26–9, in Turkish.
—— (1996b ). Evolution of the crisis in the Turkish economy: A general equilibrium investigation 1990–1993. METU Studies in
Development 23(3), 427–76, in Turkish.
—— (1997). The Turkish experience of financial liberalization.
Petrol Is 1995/96 Almanac 202–18, in Turkish.
—— (1998). On structural sources of the 1994 Turkish crisis: A CGE modeling analysis. International Review of Applied
Economics 12(3), 397–414.
Yentürk, N. (1997). Wages, Employment and Accumulation in
the Turkish Manufacturing Industry , Friedrich Ebert Stiftung,
Istanbul, in Turkish.
Notes:
( 1) See, for example, the contributions by Milanovic ( 1999 ), Cornia and Kiiski ( 1999 ), Barro ( 1999 ), Rodrik ( 1997 , 1998 ), and Atkinson ( 1998a ,b ). See also the 1998, volume 8 issue of The Economic Journal for a compilation of the
theoretical mechanics of income distribution and technological change.
( 2) This financial assistance represented a resource transfer of 4.7 per cent of GDP in 1980. During 1978–80, Turkey alone accounted for nearly 70 per cent of the total volume of debt