2017 4th International Conference on Electrical and Electronics Engineering
Design of a Data Acquisition System for Passive Detection of Buried Explosives
Serkan Giirkan, Mustafa Karapinar
National Defense University, NCO Academy Department of Electrical and Electronics
Bahkesir
e-mail: [email protected]. [email protected]
Abstract-In this study; a system has been designed to detect buried explosives which contains ferromagnetic materials by means of magnetic anomalies caused by these explosives. In order to detect these materials, a passive measurement technique is used differently from conventional one. For this purpose, a sensor network having 32 nodes of TElOO fluxgate magnetic field sensors has been designed. This sensor network has been moved in a mechanism having cartesian motion capability, and data have been taken from 6 different test samples. Two-dimensional-gray scale images have been created for the obtained 32x25 size data.
Keywords-magnetic anomaly detection; magnetic field measurement; remote measurement
I. INTRODUCTION
Land mines used for a certain plan or unplanned are thought as humanitarian problems in many countries [1].
A convention, known as "Ottawa Convention", describing the usage, storage, production and transfer of anti-personnel mines; and also describing the destruction, and the disposal of anti-personnel mines was signed in Ottawa on 4 December 1997 and entered into force on 1 March 1999. Approximately 50 million land mines have been destroyed from the Ottawa Convention till today. "According to "Land Mine Monitoring Report 2013" data; between 1999 and 2013, anti-personnel mine-related events have resulted in loss of 92710 limbs or life. Since the Ottawa Convention entered into force, there has been a significant reduction in limb/organ loss events arising from landmines [2].
Although significant regulation and legislative measures were taken to clean buried explosives in the world, mine cleaning activities continue very slowly. There are still some basic problems existing in front of the slow progression:
• Although mines have been laid out within a certain plan and kept under record as a mapping, they have been displaced due to meteorological and geological events.
• Although mines have been laid out within a certain plan, they can be detected by terrorist groups and trapped against mine detectors.
• There are mines buried randomly by terrorist groups and trapped against mine detectors.
• The used anti-personnel mines are mostly made from plastic materials having low metal content.
978-1-5090-6789-3/ 17/$31 .00 ©20 17 IEEE 338
Seydi Dogan
Bahkesir University, Faculty of Engineering Department of Electrical and Electronics Engineering
Bahkesir
e-mail: [email protected]
• There are difficulties in classification due to the large variety of mines [3].
The performance of conventional mine detection systems is considerably reduced due to the problems given above. Explosives buried by terrorist groups show different characteristics from others. It is well known that some buried explosives hidden by terrorist groups contain switching mechanism that is sensitive to the detector broadcast frequencies to bloke, to slow down or to damage the mobility of security forces. It is known that buried explosives are blowed up by these switching mechanisms stimulated by the detection frequency of the used detector. The method to be used to disable such handmade explosive devices must be passive one. So, the detection system should not broadcast any signal.
11. BURIED EXPLOSIVE DETECTION METHODS Underground detection systems are widely used in researches like geography, archeology, geology, health, military, civil engineering, biology, etc. The characteristics properties of the materials to be detected or investigated play an important role in determining the method to be used. If the material to be investigated is a buried explosive; the issues such as what purpose and by whom it is buried and whether the properties of the explosive are known must be taken into consideration for the choice of the detection method.
Buried object detection methods are classified into two main groups as trace and mass analysis [4]. The trace analysis method is based on the determination the remaining of the molecules of the explosive on air or soil environment. The method of mass analysis is the visual recognition of the explosive. Both methods are based on the analysis of the existence or nonexistence of explosive materials. The mass analysis method having its own specific technique is preferred more frequently detecting buried explosives since it is more suitable for operational use by the security forces. Acoustic-seismic, ground penetrating radar (GPR) , electromagnetic induction (EMI), infra-red (lR) imaging, nuclear quadrupole resonance (NQR) and neutron measurement methods are among the main methods used in detecting buried explosives [5]-[8]. In these methods, a signal is sent to underground, and reflecting form of the signal is measured as a result of the response given by the buried object. So they are active measurement techniques. In
these methods, it is possible that buried object or an electronic switching mechanism located around them may sense the signal sent for detection. If the buried object is an explosive and has been placed by a terrorist group, the signal sent for detection will activate the explosive. This dangerous situation can be avoided if the measurement technique is an inactive one which performs the measurement without sending a signal not to activate the buried explosive.
L - - - vcc L..--- ov
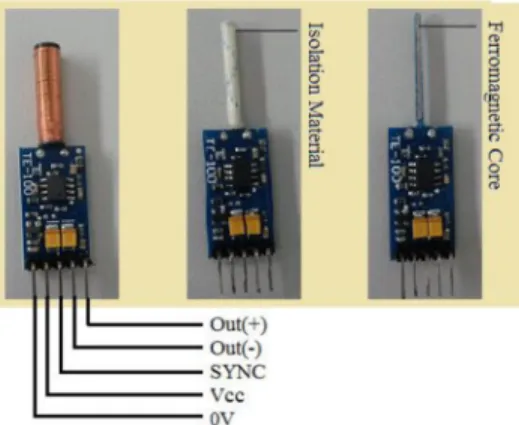
Figure I. TEIOO magnetic field measurement sensor Ill. BURIED EXPLOSIVE DETECTION BY MAGNETIC
ANOMALY METHOD
Buried explosive detection by the magnetic anomaly detection (MAD) method can be performed in two ways.
The first way; the buried object is excited by an externally applied magnetic field. Then, anomalies may be obtained by analyzing data acquired from a sensor or a sensor network. Finally, the character of the anomaly can be examined and information about the buried object can be obtained [9]. However, in this technique there are broadcasting signals to buried objects and an active measurement is carried out.
The second way; there is no broadcasting signal to the buried object, but magnetic field of the Earth is used. When an object is buried just under at any point of the Earth's surface (if it does not have the same magnetic permeability with its environment), the magnetic permeability of the object will cause an increase or decrease on the magnetic field lines and create an anomaly at the point where the object is buried. With the help of these anomalies, it is possible to detect buried explosives and buried objects having ferromagnetic contents [10].
In the passive technique; magnetically inductive (MI), magneto-electric (ME), Hall, SQUIDs, magneto-resistive (MR) and tluxgate sensors may be preferred for magnetic anomaly determinations.
In this study, the TElOO tluxgate sensor has been chosen for the reasons such as low power consumption, small size, low cost, being very light, having a range of 25 to 65 micro Tesla (/IT) which is compatible with the magnetic field of the Earth. Images of the TE 100 tluxgate sensor are shown in Figure 1.
The TEI00 sensor generates a differential voltage at the OUT (+) and OUT (-) outputs, depending on the magnetic
339
field magnitude of environment that sensor is placed in. OUT (-) output generates a reference voltage of 2.5V according to the OV potential line. OUT (+) output generates a voltage between 1.5V and 3.5V according to the OV potential line depending on the magnetic field magnitude. 1.5V and 3.5V are measured for -100 /IT and for 100 /IT respectively at the OUT (+) output of the TElOO tluxgate sensor.
IV. SYSTEM DESIGN
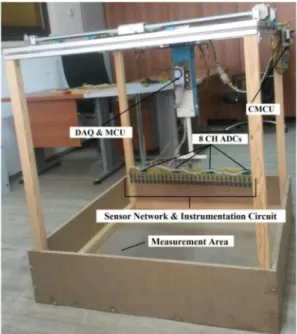
System has been consisted of sensor network & measurement circuit, data acquisition & main control (DAQ&MCU) circuit, cartesian motion control unit (CMCU) and computer interface units. The structure of the designed system is given in Figure 2 and its appearance in Figure 3.
A. Sensor Network and Measurement Circuit
Although there is no magnetic anomaly, changes in the position of the TElOO sensor may cause a change at the differential output voltage. This results in voltage oscillations at the outputs of the moving sensors, depending on the position. This is a big problem encountered to determine whether the voltage oscillation is from anomaly or position change in the data analyzing stage. A measuring system has been designed to minimize the voltage oscillations arising from the sensor positions. The block diagram of the measurement circuit and the scheme for the circuit designed for single channel are shown in Figure 4, and Figure 5, respectively.
Two magnetic field sensors were placed in the same line with opposite directions in order to produce voltages equal in magnitude and opposite in sign. As shown in Figure 4, the output signal of the reference sensor is common for the 32-channel sensor network. In order to distribute this signal to all channels without attenuation and noise, buffer amplifiers with a gain of 1 have been preferred at the channel inputs. The buffer amplifier output and the OUT (+) output of the channel sensor are added to resistors RI and R2. The resistance values of RI and R2 are equal. Thus, a signal which is the half of the signal obtained by adding the OUT (+) outputs of the reference and channel sensors arrives at the (+) input of the instrumentation amplifier. As a result of this, the unwanted signal component arising from the Earth's magnetic field in the signal has been removed. Thus, a voltage of 1 V for 50/lT is obtained regardless of the position of the sensor. However, this voltage is produced on a reference of 2.5V. A differential amplification operation has been performed in the instrumentation amplifier to remove the effect of this reference voltage. At the OUT (-) output of the channel sensor, there is a reference voltage of 2.5V. The difference signal between the signal reaching the (+) input terminal of the instrumentation and 2.5V obtained from OUT (-) output of the channel sensor is amplified. This signal is then passed through the first order passive-low pass filter consisting of R3-Cl elements and directed to the relevant ADC channel. The signal at the passive-low pass filter output is a signal that is originated from a magnetic anomaly occurring only in the environment, showing a change in ± 5V and having an output voltage of 1 V per 1O/lT. An analog to digital converter (ADC) module (AD7606) was used to
digitize the analog voItages obtained for the magnetic field size_ This module has transferred the digitized data to the DAQ&MCU unit.
Motor 1 Motor 2
(x axis) (z axis)
@
...
~
Figure 2. Block diagram of the buried object-explosive detection system developed with MAD method
Figure 3. Appearance of the buried object-explosive detection system developed with MAD m ethod
B. Data Acquisition & Main Control Unit
DAQ&MCU is the unit that establishes a communication between computer, sensor network & measurement circuit and CMCU. Simply, this is a unit that receives commands from computer to determine the coordinates of the cartesian motion mechanism, and then the data acquired from the
340
measuring circuit is sent to computer. An Arduino Mega card, on which there is an ATmega2560 microcontroller, is preferred for the DAQ&MCU.
G =1 G=1/2 G=11 ,5 fc=1026Hz OUT(-) OUT(+) w O UT(+) G =1 G=1I2 G=11 ,5 fc=1026Hz u '" Z o Wu)
"' z
Ww :t u)'"
Figure 4. Block diagram of the designed circuit that prevents position-dependent voltage oscillations
C>--CZ:::J--<] ·v
R3
'0
A DCFigure 5. Circuit designed to prevent position-dependent voltage oscillations u
"
« £ u"
« £Communication between DAQ&MCU and computer is provided wirelessly by Bluetooth modules. The numerical data collected in this unit is transmitted to the computer at 9600 bps in 32x25 data packets.
C. Cartesian Motion Control Unit (CMCU)
Cartesian motion mechanism is a device designed to collect sample data by moving the sensor network in three axial directions. With the help of three different stepper motors and their associated linear motion mechanisms, the sensor network is moved in the desired direction, and the measurement area is scanned. Stepper motor drivers and an ATmega328P based microcontroller connected to these drivers are used to control the motion of the stepper motors.
D. Computer Interface Unit
The interface developed for acquiring sample data sets is called 'MAD Sampling', and Matlab Graphical User Interface (GUI) is used to develop the code (Figure 6). With the interface developed in Matlab GUI, it is possible to perform operations such as transmitting the commands required for Cartesian robot control to DAQ&MCU, starting the measurement process, recording data received from DAQ&MCU via Bluetooth modules, and making graphical analysis of recorded data. This data is recorded in 'txt' format in MAD Sampling interface.
- a x
Sensor NetwOfk
y+ y.
Go 10 !he StaR POSItion
Start Measwemert
Save Ihe Dala
Exoianatlons
Graphic Type---.I
Surface Mesh Conour
,.,
x-y-z
Figure 6. "MAD Sampling" interface image V. EXPERIMENTAL WORK.
Hand grenade Sample7 Sample21
Figure 7. Scanned object images obtained from experimental work
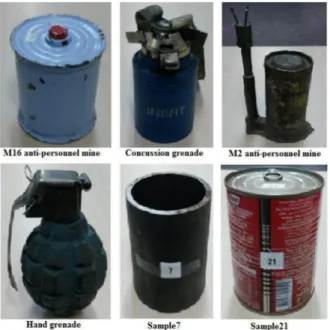
Figure 8. Physical appearances of some samples used in experimental work With the developed data collection system, 6 different samples containing ferromagnetic material were scanned.
341
Each sample was scanned at 5 cm, 10 cm, 15 cm, and 20 cm distances and 32 x 25 acquired data matrices were recorded. These 6 samples; 4 of them are explosives with standard production (MI6 anti-personnel mine, concussion grenade, M2 anti-personnel mine, hand grenade), 1 of them is handmade explosive cover (Sample 7) and the remaining 1 is misleading material with handmade explosive geometries (Sample 21). The gray scale images scanned at 10 cm distance for MI6 anti-personnel mine, bombardment, M2 anti-personnel mine, grenade, sample 1 and sample 21 are shown in Figure 7. Their physical appearances are given in Figure 8.
VI. CONCLUSION
As a result; a prototype of a data acquisition system for the passive detection of buried explosives containing ferromagnetic material has been developed. Magnetic anomaly method was used in the study. After experimental work with the 6 different samples, data from 4 different heights were collected and a database of 24 members was created. Converting the obtained data to a 2-axis gray scale image resulted in the detection of an object entity buried underground. It is evaluated that the results of the study can be used to determine the buried object features by the use of the created data bank in the classification studies.
REFERENCES
[I] L. Monin, L. and Gallimore, A , The Devil 's Gardens:A History of Landmines, London, Pimlico, 2002.
[2] International Campaign to Ban Landmines and Cluster Munition Coalition (lCBL-CMC), "Landmine Monitor", Landmine Report, Report 2014, 2014.
[3] A Muscio and MA Corticelli, MA, "Land Mine Detection by Infrared Thermography Reduction of Size and Duration of the Experiments", IEEE Transaction On Geoscience and Remote Sensing, vol. 42, no.9, p. 1955-1964, 2004.
[4] AA Fatah, R.D. Arcilesi and J.A. Clindock, Guide for the Selection
of Explosives Detection and Blast Mitigation Equipment for Emergency First Responders, Washington, Preparedness Directorate Office of Grants and Training, 2008.
[5] Y. Ege, A. Kakilli, and O. Klh", "Performance Analysis of Techniques Used for Determining Land Mines", International
Journal of Geosciences, vol. 5, no. 10, p. 1163-1189, 2014. [6] C.c. Chen, J.J. Halman and L. Peters, "A Standoff, Focused-Beam
Land Mine Radar", IEEE Transaction On Geoscience And Remote
Sensing, vol. 38, no. I, p. 507-514,2000.
[7] G. Ramachandran,P.D. Gader and N. Wilson, " GRANMAGradient Angle Model Algorithm on Wideband EM! Data for Land-Mine Detection", IEEE Transaction on Geoscience and Remote Sensing
Letters, vol. 7, no. 3,2010.
[8] N.P. Avdelidis, A. Moropoulou and P. Theoulakis, "Detection of water deposits and movement in porous materials by infrared imaging", Iiifrared Phys. Technol., vol. 44, no. 3, p. 183- 190,2003. [9] Y. Ege, O. Kalender, ande S. Nazhbilek, "Direction finding of
moving ferromagnetic objects inside water by magnetic anomaly",
Sensors and Actuators A, vol. 147 ,p. 52-59, 2008.
[10] S. Nazhbilek, Y. Ege, O. Kalender and M.G. $ensoy, "Identification of materials with magnetic characteristics by neural Networks",