Visualization of Human Kidney Embryonic Cells by Acoustic
Microscopy
Bukem Bilen1*, Nural Pastaci Ozsobaci2, Fatma Ates Alkan3, Mehmet Burcin Unlu1
1Department of Physics, Faculty of Arts and Sciences, Bogazici University, 34342, Istanbul, Turkey 2Biophysics Department, Faculty of Medicine, Istanbul University, Istanbul, Turkey 3Biophysics Department, Faculty of Medicine, Beykent University, Istanbul, Turkey
Received: 16 August 2018 Accepted: 11 October 2018 DOI: 10.18466/cbayarfbe.454158
Abstract
The aim of our study is to evaluate the capability of acoustic microscopy with a high frequency transducer for visualization of cells. Human kidney embryonic (HEK293) cells were observed by scanning acoustic microscope (SAM). HEK293 cells cultured on cover glasses were kept in cell culture plates. A transducer with 320 MHz center frequency and a spot size of 4.0 µm was incorporated into SAM. Two-dimensional acoustic images were obtained successfully to identify the morphology and the acoustic properties of HEK293 cells and the acoustic impedance of HEK293 cells was measured as 1.65 0.02 MRayl. The same cells on cover glasses were observed also with inverted microscope. The results in this study indicate that scanning acoustic microscopy can be used for the determination of elastic properties of cells, therefore for cellular mapping and molecular imaging, since it can create very sharp images of HEK293 cells with a high frequency transducer.
Keywords: Scanning acoustic microscopy, kidney cell, acoustic impedance.
1. Introduction
The investigation of viscoelastic properties of cells has
been done by various techniques, including
microrheology [1], micropipette aspiration [2, 3], atomic force microscopy [4] and optical tweezers [5]. However, these require staining and/or special preparation of the specimen, which make these techniques time consuming and expensive. Scanning acoustic microscopy requires no preparation of the living cells and/or tissues and obtains the information in a very short time interval. SAM can acquire the sound speed through the tissues [6, 7, 8] or the acoustic impedance of the specimen [9] and plots two-dimensional images on the screen using these data.
The frequency of the transducer identifies the resolution of acoustic microscopy. Visualization of individual cells and measurement of their acoustic properties are possible by SAM with high frequency transducers [10, 11]. The nucleus and cytoplasm of apoptotic cells were clearly observed, when a very high frequency transducer of 1.2 GHz was used [12]. Similarly, comparison of acoustic images of breast cancer cells with optical images showed higher resolution ultrasonic measurements of cells were obtained with higher frequency transducer [13]. Two-dimensional acoustic microscopy can be employed to visualize the intercellular changes due to aging, cell death and injection of chemical stimuli. The study of cells with SAM was successful in determining the
morphological and acoustic changes due to exposure of endotoxin [14]. The acoustic properties of the same cells of different age groups were also investigated by SAM and differences noticed [15]. The study of glia-glioma brain tumor model using SAM showed the effects of anticancer drugs on the cells without damaging them [16].
The above-mentioned studies were the motivation of our study on HEK293 cells and the main purpose was to see the capability of SAM in cellular modelling and molecular imaging, therefore, the acoustic intensity images together with acoustic impedance distributions obtained by SAM were compared with the images obtained by optical microscope and the results proved the success of SAM as an imaging tool.
2. Materials and Methods 2.1 Growth of Cells
Human kidney embryonic cells (HEK293) were bought from American Type Culture Collection-ATCC and their growth was done in standard culture medium of 89% Dulbecco’s modified eagle’s medium (DMEM), 10% heat-incubated fetal bovine serum (FBS) and penicillin-streptomycin antibiotics (1%). They were incubated in a humified atmosphere at 37 0C containing 5% CO
2 and passaged every 2 days to sustain the exponential growth. The dissociation of the cells was done using trypsin EDTA and then the cells were transferred to cover glasses placed in cell culture plates for microscopic investigations. When the cell density reached an
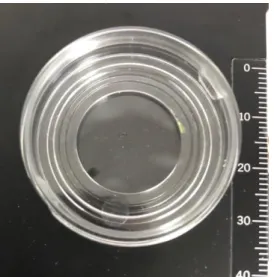
optimum value, the cell culture medium was removed, then they stayed in Tween-20 phosphate buffer saline (PBS) and 4% paraformaldehyde for 20 minutes for fixation. The grown cells were maintained at +4 0C in cell culture plates filled with 1ml PBS (Figure 1).
Figure 1. Human kidney embryonic cells, grown on cover glasses, were kept in phosphate buffer saline within cell culture plates at +4 0C.
2.2 Experimental Setup
SAM, AMS-50SI, developed by Honda Electronics (Toyohashi, Japan) was used in our study. A high frequency transducer of 320 MHz was inserted for imaging HEK293 cells in two dimensions.
The schematic of the measurement system is shown in Figure 2. The acoustic wave is produced by a piezoelectric transducer in contact with a sapphire lens. Distilled water was chosen as the coupling medium, which is responsible for carrying the ultrasound signal between the lens and the substrate. The samples were placed on a polystyrene substrate of thickness of 50 µm. The waves reflected from the substrate, the reference material, PBS, and the sample were collected by the same transducer of central frequency of 320 MHz, focal length of 0.29 mm and bandwidth of 200-400 MHz. The transducer was placed on a stage, which was scanned in two-dimensions by the stage control computer and the pulse obtained at each point was averaged 4 times for reducing the noise. As a result, two-dimensional acoustic intensity and impedance distributions of the samples were visualized with 300 x 300 pixels.
Figure 2. Schematic of the measurement system in acoustic impedance mode. AMS-50SI has 5 major units; a transducer with a lens, a pulser-receiver, X-Y stage, computer and a display. Distilled water is the coupling medium between the transducer and the substrate. Zeiss Axio Observer 7 inverted fluorescence microscope system was used in transmitted light mode for optical imaging of HEK293 cells (Figure 3). It has mainly 5 units: 1) Power supply, 2) focus controller, 3) light– emitting diode (LED) light source with a certain wavelength (385 nm, 430nm, 475 nm, 511 nm, 590 nm, 630 nm), 4) carbon dioxide (CO2) module and 5) objective with a certain magnification (5x, 10x, 20x, 40x and 63x).
Figure 3. Zeiss Axio Observer 7 inverted fluorescence microscope system mainly composed of 5 units: Power supply, focus controller, LED light source, CO2 module and objective.
2.3 Principle of Acoustic Microscopy
Ultrasound signals scattered from the cells and the reference material are collected to study the acoustic properties of the cells in acoustic microscopy. The principle of SAM in acoustic impedance mode is shown in Figure 4. The same transducer is responsible for both
Phosphate Buffer Saline (PBS) Cell Culture Plate
radiating the samples and receiving the signals from them. If we assume perpendicular incidence, then the acoustic impedance of the target is subsequently calculated as 𝑍𝑡𝑎𝑟𝑔𝑒𝑡= 1 +𝑆𝑡𝑎𝑟𝑔𝑒𝑡𝑆 0 1 −𝑆𝑡𝑎𝑟𝑔𝑒𝑡𝑆 0 𝑍𝑠𝑢𝑏 =1− 𝑆𝑡𝑎𝑟𝑔𝑒𝑡 𝑆𝑟𝑒𝑓 [ 𝑍𝑠𝑢𝑏−𝑍𝑟𝑒𝑓 𝑍𝑠𝑢𝑏+𝑍𝑟𝑒𝑓] 1+𝑆𝑡𝑎𝑟𝑔𝑒𝑡 𝑆𝑟𝑒𝑓 [ 𝑍𝑠𝑢𝑏−𝑍𝑟𝑒𝑓 𝑍𝑠𝑢𝑏+𝑍𝑟𝑒𝑓] 𝑍𝑠𝑢𝑏 (2.1) where 𝑆0 is the radiated signal by the transducer, 𝑍𝑠𝑢𝑏 is the acoustic impedance of the substrate, 𝑆𝑡𝑎𝑟𝑔𝑒𝑡 is the scattered signal from the target with an acoustic impedance of 𝑍𝑡𝑎𝑟𝑔𝑒𝑡 and 𝑆𝑟𝑒𝑓 is the scattered signal from the reference with an acoustic impedance of 𝑍𝑟𝑒𝑓 [17].
Figure 4. Principle of SAM in acoustic impedance mode, assuming perpendicular incidence. Reflections from both surfaces of the reference material and the target are collected and compared to obtain acoustic impedance of the target.
The substrate, shown in Figure 5, was polystyrene film of thickness of 50 µm (𝑍𝑠𝑢𝑏= 2.46 MRayl) and the reference was PBS (𝑍𝑟𝑒𝑓 = 1.50 MRayl).
Figure 5. Substrates used in SAM experiments, are polystyrene films of thickness of 50 µm. HEK293 cells on cover glasses were placed onto these substrates and then scanned to obtain two-dimensional intensity and acoustic impedance maps.
3. Results and Discussion
SAM is capable of not only mapping cellular distribution, but also determining the mechanical properties of specimens, simultaneously. SAM has two major advantages over other imaging techniques; it does not require special staining and/or sample preparation and it obtains the image of an area of around 5 mm x 5 mm in a couple of minutes. These pre-mentioned properties of SAM constitute the motivation of our current study. In our study, we aimed to assess the potential of SAM in monitoring cells by comparing this modality with optical microscopy, therefore, we examined HEK293 cells, since they are one of the most widely used human cell lines and their morphology is very well established. HEK293 cells express the neurofilament subunits as well as many other proteins typically found in neurons [18]. They have properties of neuronal lineage cells, therefore, their investigation may constitute a basis for neurological studies.
The HEK293 cells on cover glasses were taken out of cell culture plates and then placed onto the substrates, shown in Figure 5, for SAM experiments. Acoustic impedance microscopy using a high-frequency transducer of 320 MHz enabled us to determine the cellular impedance value of HEK293 cells, which was approximately 1.65 MRayl (Figure 6). The images were obtained by collecting reflections from surfaces of PBS and HEK293 cells and their comparison. Images are the intensity image on the left and the acoustic impedance image on the right, for a region of 2.4 mm x 2.4 mm in Figure 6. The intensity image clearly shows the cell distribution on a cover glass of polystyrene. Grown HEK293 cells are not spread uniformly on top of the cover glasses, instead, they are concentrated on some regions leaving other regions empty, as can be seen in Figure 6. The acoustic
impedance image shows the acoustic impedance distribution of HEK293 cells on a cover glass. A representative point was chosen on the images to show the impedance value of HEK293 cells measured by SAM. The acoustic impedance distribution indicated different acoustic properties due to the variation of elasticity within HEK293 cells, PBS and polystyrene. The acoustic impedance value of the HEK293 cells, PBS and polystyrene substrate were calculated as 1.65 MRayl, 1.50 MRayl and 2.46 MRayl, respectively. During SAM experiments, after cover glasses were placed on top of polystyrene substrates, PBS started to evaporate and therefore, not observed throughout the region of interest, in Figure 6.
Figure 6. SAM images of HEK293 cells on a cover glass of polystyrene, for a region of 2.4 mm x 2.4 mm. Reflections from surfaces of PBS and HEK293 cells on cover glasses were collected and compared to obtain intensity and acoustic impedance maps with 300 x 300 points.
Figure 7 shows the SAM images in a region of 0.3 mm x 0.3 mm. In this figure, we focused on a region of HEK293 cells and PBS, rather than the whole cover glass with some empty regions as shown in Figure 6. Similarly, the images were obtained by combining the reflections of ultrasound signals from surfaces of PBS and HEK293 cells. The intensity image on the left shows the morphology of the cell distribution. A representative point was chosen on the images giving the average acoustic impedance value of HEK293 cells. The acoustic impedance distribution image on the right measures the acoustic impedance of each HEK293 cell and PBS as 1.65 MRayl and 1.50 MRayl, respectively. Region of 0.3 mm x 0.3 mm in these images is the smallest area that the transducer scans in our SAM.
Figure 7. SAM images of HEK293 cells on a cover glass of polystyrene, for a region of 0.3 mm x 0.3 mm. Reflections from surfaces of PBS and HEK293 cells on cover glasses were collected and compared to obtain intensity and acoustic impedance maps with 300 x 300 points. Left image is the intensity image, right image is the acoustic impedance map. A representative point was chosen on the images giving an average acoustic impedance value of 1.65 MRayl.
In Figure 8, optical image was obtained by an inverted fluorescence microscope, operated in transmitted light mode. In a region of 0.3 mm x 0.2 mm, it shows the distribution of HEK293 cells clearly and is quite similar to the images of acoustic microscopy. 40x magnification was chosen for the observation and the resolution of the images was 0.56 µm with this objective. Higher resolution in optical microscopy resulted in clearer images when compared to the SAM images of resolution of 4.7 µm. The resolution of the SAM images can be improved with even a higher frequency transducer rather than a 320 MHz transducer.
Figure 8. Optical image of HEK293 cells obtained by an inverted fluorescence microscope operated in transmitted light mode, with 40x magnification, in a region of 0.3 mm x 0.2 mm. Scale bar is 20 µm.
In this study, acoustic microscopy was performed using SAM equipped with a high-frequency transducer of 320 MHz and we have demonstrated that SAM is capable of obtaining morphological and mechanical properties of HEK293 cells by measuring the acoustic impedance values. SAM has two modes for the determination of acoustic properties of samples; sound speed mode, which requires thin samples of around 10 µm and acoustic impedance mode. In our SAM experiments, acoustic impedance mode was chosen and impedance value of
HEK293 cells was determined. With a high-frequency transducer of 320 MHz and focal length of 0.29 mm, the only requirement is a suitable substrate with a certain thickness. The polystyrene substrates (Menicon Life Science Co., Ltd.), used in this study, have a thickness of 50 µm and they enabled SAM to create very sharp images for HEK293 cells with a resolution of 4.7 µm. High frequency (HF) SAM, operating around 1 GHz, offers a better resolution of 1µm and the use of a higher frequency transducer around that value in SAM will enable resolving of nucleus and some organelles within cells, as in optical microscopy, however, the price goes up tremendously and in some studies that resolution is not a necessity.
The optical images obtained by an inverted fluorescence microscope operated in transmitted light mode, with 40x magnification, had a better resolution of 0.56 µm, however, only morphological information was obtained. The necessity of staining for acquiring detailed images in optical microscopy makes this modality less powerful than SAM, since, SAM requires no special preparation and staining for the samples and obtains both morphological and mechanical information within minutes.
The comparison of SAM images with optical images reveals the capability of SAM in cell visualization. The feasibility of HF SAM, with a 600 MHz transducer, was demonstrated for imaging the plant cell wall by comparing SAM images with optical images [19]. Also, combined SAM with a 0.9 GHz transducer and laser fluorescence microscope was successfully differentiated apoptotic cancerous cervical carcinoma and epithelial non-cancerous kidney cells from other cells by observing the nucleus membrane disruption, which can only be achieved with a resolution of 1µm [12]. However, in some studies, such as anti-cancer drug effects on tumor models [16], very high resolution of 1µm is not necessary, since the observation of acoustic impedance value change will be sufficient, instead of intracellular components. Therefore, a SAM with a 320 MHz transducer can be used in such studies widely in the future, since it is more affordable than a higher frequency SAM and also has a potential to be implemented as a catheter-based imaging tool.
The evaluation of SAM in determining HEK293 cell properties with a 320 MHz transducer has not been done so far. Therefore, these cells were characterized by SAM and optical microscope and the results are presented in this article. Consequently, the consistency of acoustic impedance value of HEK293 cells, measured by SAM as 1.65 0.02 MRayl, with literature [20] and the similarity of the acoustic images obtained by SAM with the optical images obtained by inverted fluorescence microscope, proved that SAM with a high frequency transducer of 320 MHz is useful in visualization and determining the mechanical properties of HEK293 cells and therefore,
will take place widely in studies concerning parameters, effecting the elasticity of the cells.
4. Conclusion
SAM, equipped with a high-frequency transducer of 320 MHz, permits the measurement of acoustic impedance values reflecting the acoustic properties of HEK293 cells. The acoustic impedance distribution corresponded to the elasticity distribution of the cells, which helps to visualize each cell clearly. Comparison of the acoustic images with the optical images shows the capability of SAM in cellular modelling and molecular imaging. Consequently, we can say that SAM with a high-frequency transducer is a useful tool for the visualization of the targeted cells.
Acknowledgement
Our study is supported by Ministry of Development of Turkey. Project Number: 2009K120520.
References
1. Ziemann, F, Radler, J, Sackmann, E, Local Measurements of
Viscoelastic Moduli of Entangled Actin Network Using an Oscillating Magnetic Bead Micro-Rheometer, Biophysical Journal, 1994, 66, 2210–2216.
2. Schmid-Schönbein, GW, Sung, KLP, Tozeren, H, Skalak, R,
Chien, S, Passive mechanical properties of human leukocytes, Biophysical Journal, 1981, 36, 243-256.
3. Hochmuth, RM, Micropipette aspiration of living cells, Journal of
Biomechanics, 2000, 33, 15-22.
4. Van Vliet, KJ, Bao, G, Suresh, S, The biomechanics toolbox:
experimental approaches for living cells and biomolecules, Acta Materialia, 2003, 51, 5881–5905.
5. Laurent, VM, Henon, S, Planus, E, Fodil, R, Balland, M, Isabey,
D, Gallet, F, Assessment of Mechanical Properties of Adherent Living Cells by Bead Micromanipulation: Comparison of Magnetic Twisting Cytometry vs Optical Tweezers, Journal of Biomechanical Engineering, 2002, 124, 408–421.
6. Miura, K, Egawa, Y, Moriki, T, Mineta, H, Harada, H, Baba, S,
Yamamoto, S, Microscopic observation of chemical modification in sections using scanning acoustic microscopy, Pathology International, 2015, 65, 355-66.
7. Miura, K, Nasu, H, Yamamoto, S, Scanning acoustic microscopy
for characterization of neoplastic and inflammatory lesions of lymph nodes, Scientific Reports, 2013, 3, 1255.
8. Brewin, MP, Srodon, PD, Greenwald, SE, Birch, MJ, Carotid
atherosclerotic plaque characterization by measurement of ultrasound speed in vitro at high frequency, 20 MHz, Ultrasonics, 2014, 54, 428-441.
9. Kobayashi, K, Yoshida, S, Saijo, Y, Hozumi, N, Acoustic
impedance microscopy for biological tissue characterization, Ultrasonics, 2014, 54, 1922-1928.
10. Johnston, RN, Atalar, A, Heiserman, J, Jipson, V, Quate, CF,
Acoustic microscopy: Resolution of subcellular detail, Proceedings of the National Academy of Sciences of USA, 1979, 76, 3325–3329.
11. Miura, K, Yamamoto, S, A scanning acoustic microscope
discriminates cancer cells in fluid, Scientific Reports, 2015, 5, 15243.
12. Strohm, EM, Kolios, MC. In IEEE Ultrasonics Symposium, Rome,
Italy, 2009, pp 49-52.
13. Strohm, EM, Czarnota, GJ, Kolios, MC, Quantitative
Measurements of Apoptotic Cell Properties Using Acoustic Microscopy, IEEE Transactions on Ultrasonics, Ferroelectrics and Frequency Control, 2010, 57, 2293-304.
14. Saijo, Y, Sasaki, H, Sato, M, Nitta, S, Tanaka, M, Visualization of
human umbilical vein endothelial cells by acoustic microscopy, Ultrasonics, 2000, 38, 396–399.
15. Shelke, A, Brand, S, Kundu, T, Bereiter-Hahn, J, Blasé, C. In SPIE
Conference on Health Monitoring of Structural and Biological Systems, San Diego, California, USA, 2012, pp 83481T.
16. Soon, TTK, Chean, TW, Yamada, H, Takahashi, K, Hozumi, N,
Kobayashi, K, Yoshida, S, Effects of anticancer drugs on glia-glioma brain tumor model characterized by acoustic impedance
microscopy, Japanese Journal of Applied Physics, 2017, 56, 07JF15.
17. Hozumi, N, Gunawan, AI, Kajima, S, Yoshida, S, Saijo, Y,
Kobayashi, K, Yamamoto, S. In IEEE Ultrasonics Symposium, Prague, Czech Republic, 2012, pp 1212-1215.
18. Shaw, G, Morse, S, Ararat, M, Graham, FL, Preferential
transformation of human neuronal cells by human adenoviruses and the origin of HEK 293 cells, The FASEB Journal, 2002, 16(8), 869-871.
19. Xiaoning, Xi, Xin, Li, Miyasaka, C, Kropf, M, Tittmann, BR, High
Frequency Scanning Acoustic Microscopy as Diagnostic Tool in Tissue Science, Journal of Biotechnology and Biomaterials, 2013, 3, 1000160.
20. Azhari, H, Basics of Biomedical Ultrasound for Engineers;