TURKISH BANKING SECTOR PERFORMANCE ANALYSES AFTER THE 2001 CRISIS
A THESIS SUBMITTED TO
THE INSTITUTE OF SOCIAL SCIENCES OF
YILDIRIM BEYAZIT UNIVERSITY
BY
GİZAY DAVER
IN PARTIAL FULFILLMENT OF THE REQUIREMENTS FOR
THE DEGREE OF DOCTOR OF PHILOSOPHY IN
THE DEPARTMENT OF BANKING AND FINANCE
Approval of the Institute of Social Sciences
Doç.Dr. Mesut Murat ARSLAN Manager of Institute I certify that this thesis satisfies all the requirements as a thesis for the degree of
Doctor of Philosophy in Department of Banking and Finance.
Doç. Dr. Ayhan KAPUSUZOĞLU Head of Department This is to certify that we have read this thesis and that in our opinion it is fully
adequate, in scope and quality, as a thesis for the degree of Doctor of Philosophy.
Yrd. Doç. Dr. Erhan ÇANKAL Supervisor
Examining Committee Members
Prof. Dr. Dilek DEMİRBAŞ (YBU, International Trade and Business) Yrd. Doç. Dr. Erhan ÇANKAL (YBU, Banking and Finance)
iii
PLAGIARISM
I hereby declare that all information in this thesis has been obtained and presented in accordance with academic rules and ethical conduct. I also declare that, as required by these rules and conduct, I have fully cited and referenced all material and results that are not original to this work; otherwise I accept all legal responsibility.
Name, Last name :
Gizay DAVER Signature :
ABSTRACT
TURKISH BANKING SECTOR PERFORMANCE ANALYSES AFTER THE 2001 CRISIS
DAVER, Gizay
Ph.D., Department of Banking and Finance Supervisor : Yrd. Doç. Dr. Erhan ÇANKAL
December 2015, 231 pages
This thesis contributes to the weaknesses and strengths of the banking sector in Turkey. Performance analyses (DuPont analysis, CAMELS rating and Data Envelopment Analysis) are done by using quarterly data from 2001 to 2015. The effects and results of policies implemented after the 2001 crisis are investigated in line with solid banking sector construction for the European Union membership procedure; goals and targets of 10th Development Program and for the Istanbul International Finance Center project. In general, due to financial recovery maintained after the 2001 economic crisis, banking industry has shown improvements and has become stronger from the beginning of the millennium. In order to maintain more solid and sound sustainable system, successful policies must continue, especially in the banking sector asset quality and liquidity
v
crowding out foreign banks out of the system would result in better overall assessment. Although the performance gap between the analyzed units have converged in time. Turkish banks are observed to have a lower performance in managing asset quality as well as vulnerability to market risk than foreign banks.
ÖZET
2001 KRİZİ SONRASINDA
TÜRK BANKACILIK SEKTÖRÜNDE PERFORMANS ANALİZLERİ
DAVER, Gizay
Doktora, Bankacılık ve Finans Bölümü Tez Yöneticisi : Yrd. Doç. Dr. Erhan ÇANKAL
Aralık 2015, 231 sayfa
Bu tez Türk bankacılık sektörünün güçlü ve zayıf yönlerine katkıda bulunmaktadır. 2001 yılından 2015 yılına kadar çeyreklik veriler kullanarak performans analizleri (DuPont analizi, CAMELS reyting analizi ve Veri Zarflama Analizi) yapılmıştır. İstanbul Uluslararası Finans Merkezi Projesi, 10’uncu Kalkınma Planı amaç ve hedefleri ve Avrupa Birliği üyeliği amelleriyle uyumlu olarak 2001 krizi sonrasında uygulanan politikaların sonuçları ve etkileri güçlü bankacılık sektörü oluşturulması açısından incelenmiştir. Analiz edilen birimler arasındaki performans farklılıkları zaman içinde azalmıştır. 2001 ekonomik krizi sonrası finansal düzelme genel olarak sağlanmış ve bankacılık sektörü ilerlemiş ve milenyumun başına göre daha güçlü hale gelmiştir. Daha sağlam ve daha güçlü sürdürülebilir bir sistem için, özellikle bankacılık sektörü varlık kalitesi ve likidite
vii
bankaları rakiplerinden daha iyi performans sergilemekte; ancak sahip olabilecekleri en iyi performans seviyesinde bulunmamaktadır. Bu bulgu sektörün daha iyi duruma getirilmesi için yabancı bankaların sistem dışına çıkarılması gerektiği anlamına gelmemelidir. Türk bankaları varlık kalitesi yönetiminde ve piyasa riskine daha duyarlı olma konusunda yabancı bankalardan daha düşük performans sergilemektedir.
DEDICATION
Kraliçem, Sultanıma
ix
ACKNOWLEDGMENTS
The author wishes to express his deepest gratitude to Prof. Dr. Güray Küçükkocaoğlu, Yrd. Doç. Dr. Erhan Çankal, Doç. Dr. Şenol Altan, Prof. Dr. Dilek Demirbaş, Doç. Dr. Ayhan Kapusuzoğlu, Prof. Dr. Nildağ Başak Ceylan for their guidance, advice, criticism, encouragements and insight throughout the research.
The author would also like to thank Dr. Ahmet Akıncı (BRSA), Prof. Dr. Roman Matousek for their suggestions and comments.
The technical assistance of Doç. Dr. Atilla Gökçe, Volkan Taş (BRSA), Gonca Kılınç (The Bank Association of Turkey) was gratefully acknowledged and appreciated.
TABLE OF CONTENTS PLAGIARISM ... iii ABSTRACT ... iv ÖZET ... vi DEDICATION ... viii ACKNOWLEDGMENTS ... ix TABLE OF CONTENTS ... x
LIST OF TABLES ... xii
LIST OF FIGURES/ LIST OF ILLUSTRATIONS/LIST OF SCHEMES ... xiii
LIST OF SYMBOLS AND/OR ABBREVIATIONS ... xv
1. INTRODUCTION ... 1
2. LITERATURE ... 15
3. RATIO ANALYSES ... 22
3.1. Introduction to Ratios ... 23
3.2. Ratio Analyses Data and Methodology ... 26
3.2.1. Ratio Analyses Findings: ... 32
4. CAMELS RATING ... 48
xi
5.1. DEA Introduction ... 75
5.2. Model and Methodology ... 77
5.2.1. Findings: ... 82
6. CONCLUSION ... 87
REFERENCES ... 91
APPENDICES ... 98
1. APPENDIX A - RATIOS ... 99
2. APPENDIX B – CAMELS RATIO CORRELATIONS ... 147
3. APPENDIX C – CAMELS RATIO CODEBOOK ... 151
4. APPENDIX D – CAMELS RATIO COMPONENT EFFECT RELATIONS ... 153
5. APPENDIX E – DEA RESULTS ... 155
6. APPENDIX F – CAMELS GRAPHS ... 167
7. APPENDIX G – PERFORMANCE MEASUREMENT MODELS ... 174
8. APPENDIX H – DEA SCENARIO GRAPH ... 175
9. APPENDIX I – CAMELS SYSTEM ... 176
10. APPENDIX J – TURKISH BANKING SECTOR ... 186
11. APPENDIX K – CURRENT REGULATIONS ... 190
12. APPENDIX L – STRATEGIC PLANS ... 193
13. APPENDIX M – CURRICULUM VITAE ... 196
LIST OF TABLES
Table 1 Resolution of Banks Transferred to the SDIF ... 7
Table 2 Codebook ... 22
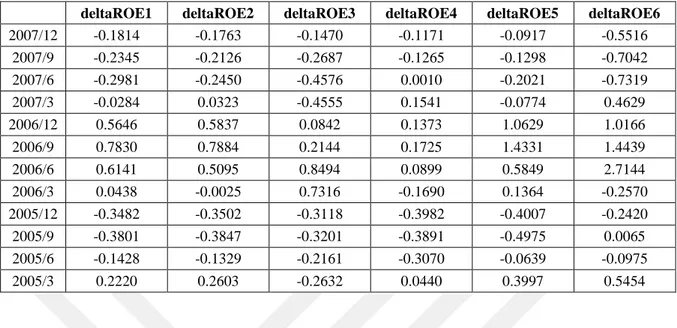
Table 3 Changes in ROE ... 33
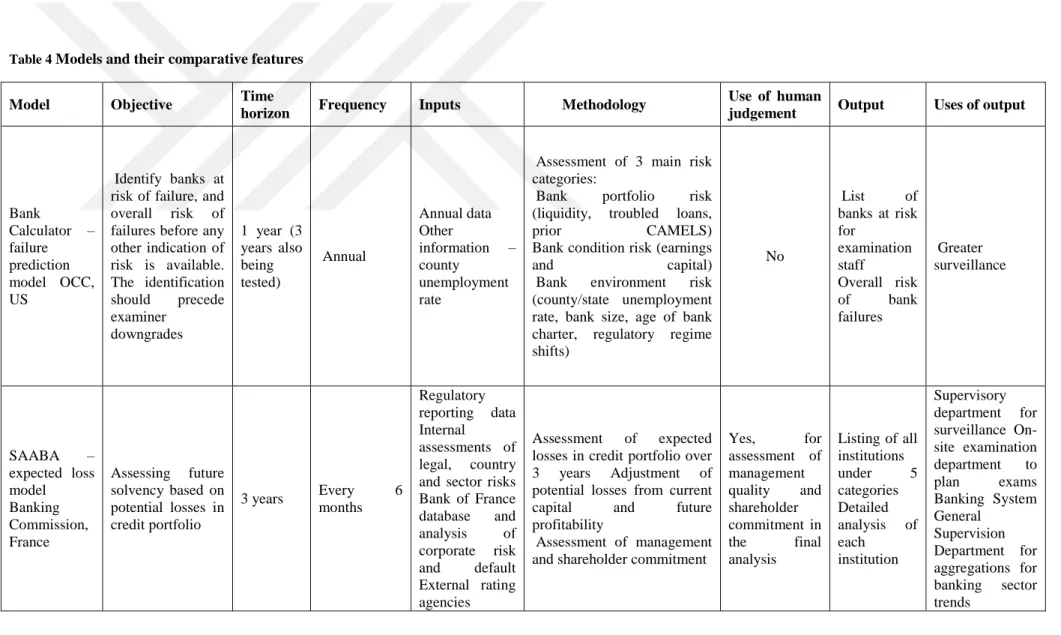
Table 4 Models and their comparative features... 49
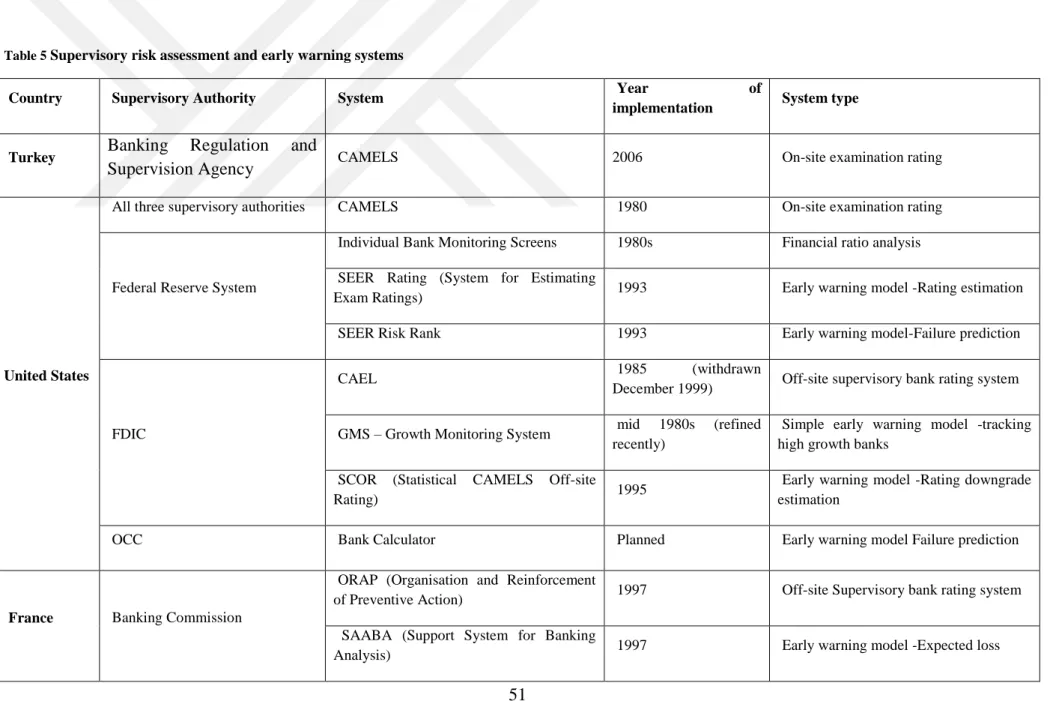
Table 5 Supervisory risk assessment and early warning systems ... 51
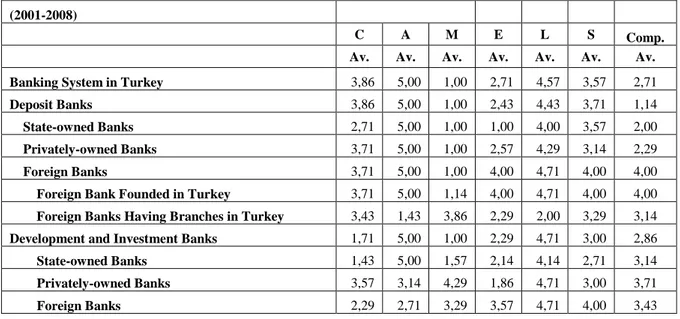
Table 6 Performance Note CAMELS Rating Conversion... 61
Table 7 2001 – 2014 CAMELS Results ... 62
Table 8 2008 – 2014 CAMELS Results ... 63
Table 9 2008 – 2001 CAMELS Results ... 63
Table 10 Yearly Capital Adequacy Ratings ... 64
Table 11 Yearly Asset Quality Ratings ... 64
Table 12 Yearly Management Ratings ... 65
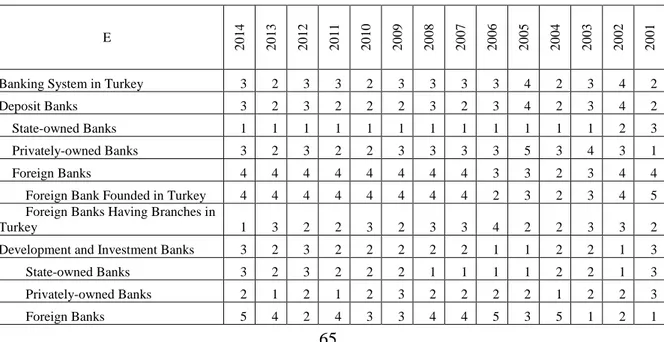
Table 13 Yearly Earnings Ratings ... 65
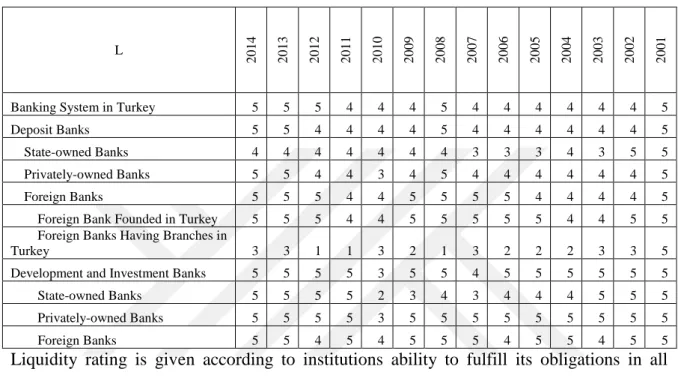
Table 14 Yearly Liquidity Ratings ... 66
Table 15 Yearly Sensitivity to Market Risk Ratings ... 66
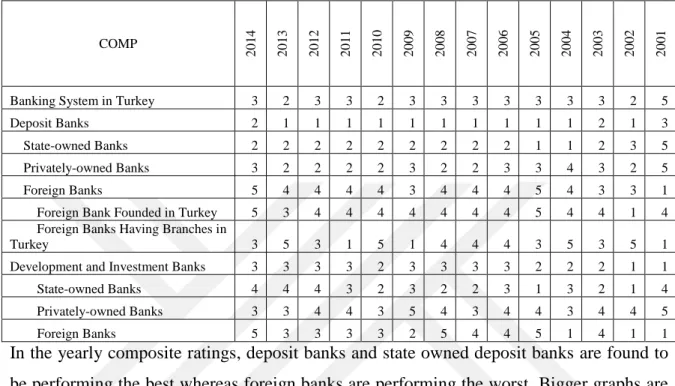
Table 16 Yearly Composite Ratings ... 67
Table 17 Codebook 2 ... 78
xiii
LIST OF FIGURES/ LIST OF ILLUSTRATIONS/LIST OF SCHEMES
Figure 1 Macroeconomic Indicators CPI, Labor, GDP ... 7
Figure 2 Dupont Scheme ... 27
Figure 3 Average ROE in 2003 - 2014 ... 32
Figure 4 Average ROE in 2003 - 2007 ... 34
Figure 5 Average ROE in 2008 - 2014 ... 35
Figure 6 Average ROA in 2003 - 2014 ... 36
Figure 7 Average ROA in 2003 - 2007 ... 37
Figure 8 Average ROA in 2008 - 2014 ... 38
Figure 9 Average EM in 2003 - 2014 ... 39 Figure 10 Average EM in 2003 - 2007 ... 40 Figure 11 Average EM in 2008 - 2014 ... 41 Figure 12 Average AU in 2003 - 2014 ... 42 Figure 13 Average AU in 2003 - 2007 ... 43 Figure 14 Average AU in 2008 - 2014 ... 44 Figure 15 Average ER in 2003 - 2014 ... 45 Figure 16 Average ER in 2003 - 2007 ... 46 Figure 17 Average ER in 2008 - 2014 ... 47
Figure 18 CAMELS components: C for Banking System ... 67
Figure 19 CAMELS components: A for Banking System ... 68
Figure 20 CAMELS components: M for Banking System ... 68
Figure 21 CAMELS components: E for Banking System ... 69
Figure 22 CAMELS components: L for Banking System ... 69
Figure 23 CAMELS components: S for Banking System ... 70
Figure 24 CAMELS composite for Banking System ... 70
Figure 25 CAMELS components: C for Deposit Banks ... 71
Figure 26 CAMELS components: A for Deposit Banks ... 71
Figure 28 CAMELS components: E for Deposit Banks... 72
Figure 29 CAMELS components: L for Deposit Banks... 73
Figure 30 CAMELS components: S for Deposit Banks ... 73
Figure 31 CAMELS composite for Deposit Banks ... 74
Figure 32 DEA results M1 - M4 2002 - 2006 ... 82
Figure 33 DEA results M1 - M4 2007 - 2009 ... 83
Figure 34 DEA results M1 - M4 2010 - 2014 ... 83
Figure 35 DEA results M1 2002 - 2014 ... 84
Figure 36 DEA results M2 2002 - 2014 ... 85
Figure 37 DEA results M3 2002 - 2014 ... 85
xv
LIST OF SYMBOLS AND/OR ABBREVIATIONS
BAKIS: BAKred Information System, 52
BRSA: Bank Regulation And Supervision Agency, 4, 5, 8, 9, 10, 54 BSRP: Banking Sector Restructuring Program, 6
CAEL: Capital Asset Earnings Liquidity, 51
CBRT: The Central Bank of the Republic of Turkey, 3, 4, 5, 9, 10 CMB: Capital Markets Board of Turkey, 9, 10
CRS: Constant Returns to Scale, 75, 76
DEA: Data Envelopment Analysis, 75, 76, 77, 79, 80 DEAP: Data Envelopment Analysis Program, 76 DMU: Decision Making Unit, 75, 76, 77, 78, 80, 82 EMS: Efficiency Measurement System, 76
ETAKDS: Etkinlik Analizi Karar Destek Sistemi, 76 FC: Foreign Currency, 55, 57, 59
FDIC: Federal Deposit Insurance Corporation, 50, 51 FX: Foreing Exchange, 3, 4, 5
GMS: Growth Monitoring System, 51
IDEAS: Integrated Data Envelopment System, 75 IMF: International Monetary Fund, 5
ISE: Istanbul Stock Exchange, 4
OCC: The Office of the Comptroller of the Currency, 49, 51 ORAP: Organisation and Reinforcement of Preventive Action, 51
PATROL: PATrimonio, Redditivita, Rischiosita, Organizzazione, Liquidita, 52 RAST: Risk Analysis Support Tool, 52
RATE: Risk Assessment, Tools of Supervision and Evaluation, 52 SAABA: Système d'Aide à l'Analyse BAncaire, 49, 51
SCOR: Statistical CAMELS Off-site Rating, 51
SDIF: Savings and Deposits Insurance Fund, 4, 5, 6, 7, 9, 10 SEER: The System to Estimate Examinations Ratings, 50, 51 TC: Turkish Currency, 57, 58, 59
TL: Turkish Lira, 4, 5, 7, 22, 77
TRAM: Trigger Ratio Adjustment Mechanism, 52 TURKSTAT, 5; Turkish Statistical Institute, 5
UFIRS: The Uniform Financial Institutions Rating System, 9, 53, 176 UoT: Undersecretariat of Treasury, 4, 5, 10
VRS: Variable Returns to Scale, 75, 76 WB: World Bank, 3
1. INTRODUCTION
In the history of Turkish Banking System, 1990’s were the years of excessive risk taking in a highly volatile environment. Banks were increasingly investing in government bonds, taking huge currency mismatches and opening substantial amounts of credit lines to their holding companies. The high and volatile inflation rates of 1990s, the boom-bust cycles of economic growth and the fragility of external capital inflows all contributed to uncertainties and led to a domination of “short-term” behaviors. This excessive risk taking costed a lot to the system where the Turkish economy experienced two major crises in 1994 and 2001. The effects of the crisis, coupled with other structural problems in the banking system resulted in;
Inadequate capital base
Small and fragmented banking structure
Dominance of state banks in total banking sector
Weak asset quality (concentrated credits, group banking and concentrated risks, mismatch between loans and provisions)
Extreme exposure and fragility towards market risk (maturity mismatch, FX open position)
Inadequate internal control systems, risk management and corporate governance
Lack of transparency (BRSA, 2001)(p.5)
In those times, the regulation and supervision of the banking system had a fragmented structure. The Undersecretariat of Treasury (UoT) was responsible for issuing banking regulations, carrying out on-site supervision and enforcement. On the other hand, Central Bank of Turkey was responsible for off-site supervision and was managing Savings Deposit Insurance Fund (SDIF), which provided insurance to saving deposits (BRSA /
Banking Regulation and Supervision Agency of Turkey (BRSA) was established in June 1999 and began to operate in August 2000.
In the year 2000, the total number of banks in Turkish banking sector was 79 and 11 of these were under the management of SDIF and 18 were development and insurance banks. Excluding these, this brings the total number of deposit banks to 50. Of these 50 deposit banks, 4 were state owned banks, 28 were privately owned banks and 18 were foreign banks. As of 2014, the number of banks in Turkish banking sector has decreased to 47, and there is currently only 1 bank under the management of SDIF. There is also a decline in the number of development and insurance banks which stands at 13. By 2014, the number of deposit banks were 34 and 3 of these were state owned banks, 11 were privately owned banks and 19 were foreign banks. Compared with the 2000s only the number of foreign banks has increased in the Turkish banking sector.
Since the year 2000, the banking sector in Turkey faced a multi dimensional expansion. Banks gradually adapted to a new environment. From 2000 to 2014, total assets of the sector multiplied more than 17 times, shareholders equity multiplied by nearly 30 times, total loans multiplied by more than 34 times. Also the composition of their balance sheets changed. Details the number of banks, their total asset, shareholders’ equity and total loans are given in Appendix J.
Within this study, a milestone in the Finance industry started in the same year as the Banking Law Nr. 4389 in June 1999. The rehabilitation of the Turkish banking sector was being discussed prior to the crisis by the coalition government. With the Banks Act. Nr. 4389, several moves were done with the aim of strengthening the banking sector, starting with the establishment of BRSA. BRSA is a public legal entity with autonomy in three main areas, which are autonomy in supervision and regulation, autonomy in BRSA administration and autonomy in using financial resources.
With the Banking Law, a framework parallel to the Basle Committee and Bank of International Settlements was designed. Minimum capital amount for continuing and establishing new banks were defined. A risk weighted capital adequacy ratio was introduced. Credit classification was made parallel to international standards. Cash credits and noncash credits were defined and clearly separated. Lending limits of banks were
hardened. Consolidations of banks’ financial statements were implemented according to the international standards. Ownership and personnel responsibilities and liabilities were increased. Also amount and number of fines were increased and BRSA were empowered to impose administrative fines.
After the 2001 crisis Kemal DERVİŞ from WB was transferred to Turkey to develop and implement an economic recovery program.
2001 crisis started in the November of 2000 and BRSA and CBRT played key roles during the crisis and post crisis period.
In the literature, functions of banking are considered with three general statements. First one is financial intermediation, in which banks channel depositor’s savings to borrowers; the second is asset transformation, which is creates loans from deposits, and the last one is money creation, by functions of financial intermediation and asset transformation. Prior to the 2001 crisis, some factors that weakened the efficiency of the financial intermediation function can be summarized by macroeconomic instability, high public sector deficits, distorting effects of state owned banks, poor risk perception and risk management, deficiencies and delays in the enforcement of international standards for banking regulation and supervision. Nowadays, current regulations are classified under four main groups, which are laws, main regulations, comminiqués and best practice guidelines given in Appendix K displaying an institutional framework. BRSA takes these powers on and uses them in regulation activities, supervision activities, licensing and enforcement activities, research and development activities, data and information system activities, and within external relationships.
CBRT undertook the risk of FX reserve loss and funded the banks that were in need of liquidity. Some fragile and vulnerable banks were transferred to SDIF and CBRT’s reserve losses stopped.
While these were on going BRSA was trying to regain confidence to sector and improve reputation by implementing principles and procedures related to risk management system of banks. In these periods, Turkish banking sector was hit by three shocks:
Increased funding costs due to maturity mismatch and exposure to interest rate increases.
Capital losses due to FX rate fluctuations and open FC positions
Capital losses arising from treasury securities mark to market decline.
On the 21st of February 2001, Turkey experienced political tension between the President Ahmet Necdet SEZER and Prime Minister Mustafa Bülent ECEVİT in the meeting of the National Security Council, which caused fluctuations. This date is known as “Black Wednesday”. In order to prevent reserves, CBRT tried to limit TL liquidity released to market but they were not able to protect the exchange rate regime. ISE fell down rapidly and demand for FX increased. Also overnight interest rates exceeded 1000 percent after these developments. Public banks could not fulfill their obligations and capital market and money market transactions stopped, which meant the collapse of payment systems. These factors adversely affected CBRT’s liquidity management and monetary policy efficiency. FX regime was not adequate to deal with these developments, hence in February 2001 Turkey met the floating exchange rate regime.
After the introduction of the new regime, policy updates were made by CBRT. A new three step strategy of CBRT followed these developments.
The first step priority was reestablishing stability in money and capital markets in the floating exchange regime, by ensuring uninterrupted operation of payment systems. Actions for this goal were direct funding through reverse repo transactions, announced interest rates for overnight and weekly borrowing and lending, not letting money market interest rates beyond the band announced, by actively taking positions on interbank money and ISE market transactions.
Strategy’s second step was carrying out a coordinated operation with UoT. According to this plan, government bonds issued by UoT were used to cover public banks and banks transferred to SDIF. From these mentioned banks most of the bonds were purchased by CBRT, by this way permanent elimination of liquidity necessity was provided. According to the agreement made with IMF, funds borrowed from them were used for the financing of debt roll over problems in domestic market. Liquidity level of TL was ensured by cooperation of the Turkish Treasury and CBRT. FX position vulnerabilities were taken under control by planned auction method sales of CBRT.
The third step of the strategy was domestic debt swap operations of UoT. Banking system was still fragile because of the maturity problem of debts. In order to eliminate this problem, maturity extension was provided in mid-June 2000 by UoT’s operation of trading short term TL denominated bonds with long term bond packages. These packages included long term USD indexed bonds and long term TL denominated bonds.
The three stage strategy, taught step by step above remarkably reduced negative expectations on the Turkish economy. The cooperated movements of BRSA, CBRT and UoT allowed the economy to function again, but there was a long way to go in order not to face similar problems. After the 2001 crisis, reform studies were made on macro policies and in the banking sector. In order to eliminate financial instability and lack of confidence, the government introduced a transition to a strong economic program.
On the 3rd of May 2001, a letter of intention for 2002 was given to IMF for the continuation of the stand-by arrangement and the support program. The main goals were determined as completely removing negative effects of the crisis, and maintaining a sustainable growth environment by decreasing inflation level in the long term. Targets
summarizes some important ratios of the Turkish economy after 2004, with data gathered from CBRT and UoT. Consumer Price Index is based on TURKSTAT’s 2003 monthly data; Labor force participation ratio is from UoT statistics and GDP is expenditure based on the 1998 fixed prices, quarterly, TRY thousand, new series data from TURKSTAT. By remembering the liquidity crisis of November 2000 and the following period is importance of clearing the banking sector from weak banks can be understood better. To do so BSRP was announced on the 15th of May 2001 which focuses on intermediation function and aimed at establishing a solid and sound global banking sector. Within the BSRP, public banks had been financially and operationally restructured with the ultimate goal of privatization; SDIF banks were resolved through mergers, transfers, sales and liquidation. The method chosen depended on how the related bank was transferred to SDIF. Table 1 presents the resolution method of aforementioned banks. Other things done to get a sound banking sector are as follows; a three step audit system for controlling the soundness of commercial private banks is used and according to results, supports are established. Capital increases are done by planned letters of guarantees from bank owners. Bad asset resolution is done according to the İstanbul Approach. Tax incentives for restructuring the banks are done. In order to have a more efficient and competitive structure to better regulate and supervise the banking sector, several legal arrangements are done, such as, transparent balance sheets and strong shareholders equity encouragement, obligation for an enforcement of internal audit and risk management systems. Another implication is a single database for reporting financial information set up, data of which are available in the format of international audit standards.
Figure 1 Macroeconomic Indicators CPI, Labor, GDP
While labour force participation rate increases, CPI changes around 6% to 10%. GDP change decreases until 2008, turns to negative in 2009 after this time it reverts to positive again.
Table 1 Resolution of Banks Transferred to the SDIF Banks Type of
Transaction
Assets(**) Personnel(**) Duty Loss Resolution Period TL Million % Number % USD Million Month Banks Merged 1 EgebankA.Ş(*) Merger 795 0,8 1990 1,2 1220 13 2 YurtbankA.Ş.(*) Merger 332 0,3 563 0,3 656 13 -10.0 0.0 10.0 20.0 30.0 40.0 50.0 60.0 2005 2006 2007 2008 2009 2010 2011 2012 2013 2014 2005 2006 2007 2008 2009 2010 2011 2012 2013 2014
CPI (2003=100, End, % change) 7.72 9.65 8.39 10.06 6.53 6.4 10.45 6.16 7.4 8.17
Labour force participation rate 44.9 44.5 44.3 44.9 45.7 46.5 47.4 47.6 48.3 50.5
GDP(% change-fixed) 8.4 6.9 4.7 0.7 -4.8 9.2 8.8 2.1 4.2 2.9
Banks Type of Transaction
Assets(**) Personnel(**) Duty Loss Resolution Period TL Million % Number % USD Million Month Banks Transferred to Public Banks 13 PamukbankT.A.Ş. Transfer 4942 1,9 4040 3,2 3618 29 Transition Banks 14 BayındırbankA.Ş. Transition B. 259 0,2 486 0,3 116 ‐ Banks Sold 15 BankEkspresA.Ş. Sales 311 0,3 629 0,4 435 30 16 DemirbankT.A.Ş. Sales 2503 2,3 4225 2,4 648 10 17 SümerbankA.Ş.(*) Sales 447 0,4 1407 0,8 470 20 18 SitebankA.Ş. Sales 25 0,0 97 0,1 53 6 19 TarişBankA.Ş. Sales 185 0,1 526 0,4 74 16
Banks under Liquidation 20 KıbrısKrediİstanbulŞubesi Bankruptcy 1 0,0 22 0,0 0 21 T.İmarBankasıT.A.Ş Bankruptcy 1158 0,5 1521 1,2 5933 ‐ 22 TürkTicaretBankasıA.Ş. Voluntary Liquidation 677 0,6 3664 2,1 778 Total 21380 15,5 33405 21, 0 23207 14 (*) Merged under Sümerbank A.Ş.and sold to Oyak Group in 2001.
(**) Reflects the year‐end balance‐sheet value in the previous year before resolution and the shares in total of the aforementioned year.
Therefore, amounts belonging to the total shows the total of values and ratios belonging to different years.
(The Banking Regulation And Supervision Agency / Department of Strategy Development, 2009)(p.8)Recalculated/Revised
In 2005, a new banking law had been introduced. With the Banking Law Number 5411 and other regulations, BRSA’s working area had been widened. Financial holding companies, factoring companies, financial leasing companies and financing companies were integrated in to BRSA’s supervision and regulation area so consolidated supervision ability had increased. To get better and sustain stability, starting from June 2006, BRSA started strategic management activities. Within the strategic management approach, thirteen strategic targets related to five strategic goals according to BRSA’s mission and vision were set for the following three years. These goals and targets stated in the Strategic Plan 2006 – 2008 of BRSA are exactly given in Appendix L.
In the same direction with the goals and targets, on site and off site examinations are done. Regulation drafts are made available to related parties. Regulations’ effect on sociocultural environment is analyzed. Acts towards market efficiency are done. Bank Cards and Credit Cards Law and other regulations on this topic are done. Risk focused supervision approach
is integrated to processes. UFIRS or publicly known name CAMELS is started. Administrative fines are given to some sector companies due to lack of reporting. The Financial Sector Commission is established with the members from representatives of the BRSA, CBRT, Ministry of Finance, Undersecretariat of Treasury, CMB, SDIF, and Competition Authority, Ministry of Development, Borsa İstanbul, the Banks Association of Turkey and Participation Banks Association of Turkey. This commission is responsible for the cooperation and coordination among institutions, information exchange, proposal of joint policies and expressing views on topics related to the future of the financial sector. The Financial Sector Assessment Program is run, and the results are used by auditors and auditees. Fundamental structural indicators are measured closely. Binding of financial sector improvements to real sector are done by the Anatolian Approach. According to this approach, insolvent debts of SMEs are restructured.
Meanwhile the World, especially the USA was struggling with mortgage and subordinated debt based fluctuations. In the October of 2008, measures to defend the global crisis are announced by CBRT. The crisis’ effects on the Turkish economy can be seen on Figure 1 Macroeconomic Indicators CPI, Labor, GDP
.
Within strategic management approach, twenty seven strategic targets related to five strategic goals according to BRSA’s mission and vision were set for the following three years. These goals and targets stated in the Strategic Plan 2010 – 2012 of BRSA are exactly given in Appendix L.
In the same direction with the goals and targets, BRSA took an active role for a financial stability by coordinating and cooperating with other economy management institutions
Within strategic management approach, fifteen strategic targets related to four strategic goals according to BRSA’s mission and vision were set for the following three years. These goals and targets stated in the Strategic Plan 2013 – 2015 of BRSA are exactly given in Appendix L.
In 2013, asset size of the banking sector passed GDP’s size. BRSA’s working area was widened once more, covering Payment and Security Settlement Systems, Payment Services and Electronic Money Institutions with the 6493 numbered Law on Payment and Security Settlement Systems, Payment Services and Electronic Money Institutions.
In 2014, an electronic grievance system and a web site were launched for financial literacy and awareness.
Nowadays, in Turkey, the authorities responsible for financial stability take policy measures as part of their duties, mandates and responsibilities, taking into account the macro prudential policies, which are as follows:
CBRT is a relevant authority for the implementation of monetary policy and exchange rate regime to achieve price stability and financial stability, as well as for the management and supervision of payment and settlement systems. BRSA is a relevant authority for the supervision of all banks, financial holding companies, leasing companies, factoring companies and consumer finance companies, and regulations involving their activities. UoT is a relevant authority for public finance, the implementation of fiscal policy, and supervision and regulation of insurance companies. CMB is a relevant authority for the supervision and regulation of securities brokers. SDIF is a relevant authority for the protection of rights and interests of deposit holders, and resolution of banks. The Memorandum of Understanding, which is the relevant authority meetings between the Treasury, BRSA, CMB, SDIF and the CBRT, contribute to the coordination, information sharing, and cooperation between them and thereby maintaining financial stability and monitoring and managing systemic risk. The Financial Stability Committee and the Financial Sector Commission are institutional structures related to systemic risk and macro prudential policies. Financial Sector Commission has a broader representational structure than Financial Stability Committee (BRSA / Institutional Communication and Foreign
Relations Department, 2015; BRSA, 2001; Central Bank Of The Republic Of Turkey Head Office, 2015; Keskin & Alparslan, 2000).
In the analyses period, three presidents ruled the Republic of Turkey. During the 2001 crisis Ahmet Necdet SEZER was the president and during the 2008 crisis Abdullah GÜL was the president. During the course of the study The Justice and Development Party (AKP) was the leading and governing party of the Turkey. Under the political environment, two phenomena dominate in election systems. The first one is justice in representation and the second one is stability in governance. In the 1995 and 1999 elections, justice in representation phenomenon ruled in Turkey, but after these periods election results shows that stability in governance phenomenon ruled (Tuncer, 2006). Financial market development is affected by the regulatory system type of a country (Aysan & Ceyhan, 2007). The main aim of political parties is to win elections. Political parties getting close to victory for a period of time, make strategic plans covering the next election periods. A design of political and economic environment is done according to these plans. After the 2002 elections, a single party rule in Turkey, the President of the Grand National Assembly of Turkey, Minister of Finance, Minister of Economy, Minister of State Responsible for Economic Coordination and/or Vice Prime Minister for Economic Coordination became members of this party. A background from the same political party emphasizes similar visions. Therefore, close relationship results in strong motivation aimed towards strategic plans.
A strong institutional framework including strong law enforcement, strong legislative environment, a rationale organizational scheme and transparency have positive effects on a financial system (Demirgüç-Kunt & Detragiache, 1998). Banking systems’ stability and effective functionality are essential for development and economic growth. Therefore, a
economic actors during the analysis period. In short, economic and politic stability are favorable for financial development.
BRSA functioning as a safeguard in the economy needs instruments to reach and fulfill its mission, vision, goals and priorities. One of these instruments is performance measurement.
Empirical research on the banking sector performance topic is one of the attraction points of academicians and practitioners through the evolvement processes. Some studies can be given as, (Akıncı, Matousek, Radic, & Stewart, 2012; Albayrak & Erkut, 2005; Aygün, Taşdemir, & Çavdar, 2010; Aysan & Ceyhan, 2008; Bakan, Doğan, Erşahan, & Eyitmiş, 2012; Çağıl, 2011; Çinko & Avcı, 2008; Dinçer & Görener, 2011; Fukuyama & Matousek, 2011; George Assaf, Matousek, & Tsionas, 2013; Isik & Hassan, 2002, 2003; Ozkan-Gunay & Tektas, 2006; Seyrek & Ata, 2010; Taşkın, 2011) who examine bank performances in the Turkish banking sector. Most of these studies were prior to the 2001 period. Each evolvement stage, which has its own special conditions and changes in these stages should be discussed considering these factors. The most recent studies mentioned above covers until the 2010 period by using annual data. There are many studies on the Turkish banking sector, although, they do not capture the effects of policies implemented after the 2001 Crisis, till the most recent period by using quarterly data. In the last quarter of 2000, the Turkish banking sector was hit by a liquidity crisis, which deepened in 2001 and in 2008. Turkey struggled with the global crisis. Hence, if the policies implemented after the 2001 crisis had expected recovery and long term strengthening of the sector, effects of these crises should have had a limited impact on the Turkish banking sector. In addition to these, three hypotheses associated with non-performing loans, bad luck, bad management and skimping (Berger & Mester, 1997) are not addressed and there is also a gap in the Turkish banking sector literature at this point. Addressing the reason of NPLs could lead to a right treatment of this important problem. There also lays another important topic on the banking sector, which is about the ownership of banks and their effects on the system. Bank ownership as foreign or domestic and the impacts on performance results are widely discussed in many studies, for example, in (Berger, Deyoung, Genay, & Udell, 2000; Das & Ghosh, 2006; Fries & Taci, 2005; Sarkar, Sarkar, & Bhaumik, 1998). Particularly in Turkey, limited to their analyses periods (Akıncı et al., 2012) amongst
others, defends domestic banks are better than their foreign competitors. Their study does not cover the most recent period, hence I extended the period and searched for confirmatory evidence on state banks’ dominance. As a result, my findings are in line with Akıncı et. al. (2012), suggesting state banks are performing better than foreign banks in Turkey on average performance. I extended my study to show that, although foreign banks’ overall performance is not better than state owned banks they are found to manage their assets better than domestic competitors. Also, foreign banks are found less vulnerable to market risks. From these points foreign banks are required for the overall stability of the financial system. Within the 1990’s, the Turkish economy and especially the banking sector in Turkey was in poor condition with fragilities. By the implementation of an economic recovery program and the banking sector restructuring program after the 2001 crisis policy makers aimed to form a solid and sound financial system. Together with the European Union membership procedure and the goals and targets of the 10th Development Program, stability of the Turkish economy is considered important. In particular with the İstanbul International Finance Center project, bank performances are key indicators for being in the top twenty five international finance centers. Shortcomings of performance evaluation with only a traditional ratio analyses are addressed in several studies (Aysan & Ceyhan, 2008; Bowlin, Charnes, Cooper, & Sherman, 1985; Mercan, Reisman, Yolalan, & Emel, 2003; Ozkan-Gunay & Tektas, 2006). Therefore, I conducted a three stage analysis methodology. At first DuPont Analysis schema is implemented to quarterly data gathered from the Turkish Banking Association of Turkey for the periods between 2001 to 2015. ROE, ROA and lower breakdowns are analyzed as usual and suitably for the banking sector (Koch & MacDonald, 2015). Another contribution of my study is implementing CAMELS analysis with all available data important for the banking sector rather than the selected ratios implied in (Çinko & Avcı, 2008; Türker Kaya, 2001). In the third and the
chapter 4, CAMELS ratings will be introduced and findings from the analyses will be given. In chapter 5, DEA will be explained and findings of the analyses will be presented. In chapter 6, conclusions will be drawn and future studies will be addressed.
2. LITERATURE
By the 7th of November 2015, from 1922 to 2016 according to Scopus; “Performance” title, abstract or keyword search results in 3658995 documents. Documents are under life sciences, health sciences, physical sciences, social sciences and humanities subject areas. The search results increase significantly after 1960’s. 97129 of these documents are under business management and accounting subject area ranked 18th of 28 groups. 42621 of these documents are under economics, econometrics and finance area ranked 22nd of 28 groups. This implies that the performance topic is relatively younger in these areas.
Refining “Performance” title, abstract or keyword search limited to business management and accounting, economics, econometrics and finance subject areas results in 122145 documents. The search results increase significantly after 1990’s. Top ten countries in this research are United States, United Kingdom, China, Australia, Germany, Canada, Taiwan, India, Spain and Italy. According to the classification of the World Bank, there are only two middle income countries in the top ten, which are China and India. Turkey is classified under upper middle income countries as China. Chinese authors published 9405 documents, whereby Turkish authors published 1267 documents during this period.
Lack of generally accepted industry standard for performance evaluation was mentioned before. In order to capture researchers’ aspects towards the topic, some information will be provided here. One study’s statement from the comprehensive review of the use of operational research and artificial intelligence techniques through 196 studies is finding DEA to be the most common methodology. Most of the inspected studies are found to be aiming at technical and operational efficiency measures (Duygun Fethi & Pasiouras, 2010). Efficient frontier estimation studies start with the Debrau (1951) and Koopmans (1951).
literature. In the following years, DEA was argued, developed and applied to other areas. Examples from, more than 500 cited studies, according to Scopus are given to demonstrate arguments on DEA, development progress and various applications of DEA. Parametric models and non-parametric models are the most well-known performance measures. A classification is given in Appendix G. Between these models, semi-parametric models were studied for data generating processes arguments and DEA efficiency score correlations (Simar & Wilson, 2007). Another argument was DEA limitations and advantages. These were studied with methodical extensions and transformation of models (Seiford & Thrall, 1990). On a sample of electricity plants, non-parametric models were studied with the bootstrapping methodology which is showing another proof of DEA development in time (Simar & Wilson, 1998). Another counter-view rose from the proportional change requirements of factors used as input and output in DEA models. A contrasting study to both CCR and BCC measures of DEA was a slack based measure of efficiency, which was dealing with excessive input and shortcoming output was proposed to literature (Tone, 2001). Noticing managements’ restricted control on some input or output factors, DEA was applied to the fast food sector with special treatments to the limited controlled factors (R. D. Banker & Morey, 1986). It is possible to extend this literature on DEA studies, but it is out of the scope of this study to explain the whole development of DEA. Just to mention, many variations of DEA studies are done in the literature using VRS, CRS or both in many different sectors to many application areas, such as accounting, auditing firms, airports, bank branches, bankruptcy predictions, benefit and cost analysis, community and rural health care, credit risk evaluations, education, elections, environment, financial statements, hotels, hospitals, gas distribution, macro economy, military, municipal services etc., by using several input and output factors (Fried, Lovell, & Schmidt, 2008).
Performance literature is not limited to DEA, so studies related to financial institutions performance and bank performances are going to be addressed here, regardless of the methodology and/or approach they employed.
The IMF programs supporting the effect on East Asian economies’ banking sector were studied for the years between 1991 to 2005 in Thailand, Indonesia, Korea and the Philippines. Input oriented DEA was applied using both the CRS and VRS. Also the CRS
super-efficiency model and Tobit regression model were used in this study. The 1997 – 1998 Asia crises found to affect Indonesian banks the most. Thai banks were the most efficient, and the efficiency scores listed Filipino banks as second, Korean banks as third and Indonesian banks as the last. Even though the Asian crisis had a long lasting negative effect, in the post IMF period banks reverted to pre IMF period levels. Another important finding is a insignificant efficiency difference related to restructured and non-restructured banks. “Bank restructuring during a financial crisis is required and justified on efficiency restoration grounds; but importantly, well designed measures are vital to ensure its success.” (Ariff & Can, 2008) (p.185). The study is important for Turkey because, IMF policies are strongly coordinated with the World Bank policies. Kemal Derviş was transferred from World Bank to Turkey, right after 2001 crisis to develop and implement a crisis recovery program.
In the study of Türker Kaya (2001), Turkish banking sector was analyzed with CAMELS analysis for the periods between 1997 and 2000. A worsening of all the components of composite rating is observed from 1997 to 2000. Data set was obtained from the Bank Association of Turkey, which is disclosed to the public. Within the scope of CAMELS analysis, situation of banks are executed with all available criteria important for the banking sector. With this study, rationale of CAMELS analysis is prescribed by a BRSA specialist (Türker Kaya, 2001). BRSA of Turkey utilizes CAMELS rating system, but neither the rating notes nor the methodology is disclosed to the public (Banking Regulation and Supervision Agency, 2011). This situation remains as a gap for the evaluation of performance with CAMELS rating. Another study searching CAMELS analysis support for bank failures and their transfers to SDIF fact found that a prediction of these events are impossible (Çinko & Avcı, 2008). The aim of my study is not finding supportive
Albayrak and Erkut (2005), studied the financial and non-financial criteria in the Turkish banking sector for the year 2002, by applying analytic hierarchy process approach. Due to banks’ classification, service sector firm’s evaluation of their performances with only ratio analyses are found to be inadequate (Albayrak & Erkut, 2005).
Macroeconomic and bank specific factors of efficiency in the Turkish banking industry for the 1995 to 2009 period is discussed in line with Demirgüç-Kunt (1999)’s model. The performance criteria of the banking sector are stated as NIM, ROA and ROE. Results show that micro factors are relatively more explanatory than macro factors in the assessment of bank performances (Taşkın, 2011).
For the periods between 2003 - 2008, CRS-DEA and data mining techniques are deployed to the Turkish banking sector data. Total deposits, interest expenses, non-interest expenses are the input factors and total loans, interest income, non-interest income are defined as the output factors. For the data mining analyses financial ratios are defined under clusters. Analyses results showed that total loans to total deposit ratio was found the key determinant of bank performance (Seyrek & Ata, 2010)
By the means of DEA input and output factors, financial sector studies can be listed but they do not fall under a category to be classified as standard input – output factors for the assessment of efficiency. Some studies falling under the efficiency search before 2001 are listed first. Favero and Pappi (1995) used labor, capital and loanable funds as input and loans, securities and non-interest income as output factors for 1991 in Italy. Leaven (1997) used interest expense, labor expense and other operating expenses as input. Output factors were loans and securities for the years between 1992 – 1996 in Korea, Philippines, Thailand and Korea. Saha and Ravishankar (1999) chose to use number of branches, number of staff, establishment expenditure and non-establishment expenditure as input factors, and, deposits, advances, investments, total income are used as output factors for the 1991 – 1995 period in India. Casu and Moleyneux (2000) studied the EU countries, France, Germany, Italy, Spain and UK for the 1993 – 1997 period by using total costs, total deposits as input and loans and other earning assets as output factors. Rezitis (2006) used input factors of labor, capital expenses, deposits and output factors of loans and investment assets for Greece in order to analyze the 1982 – 1997 period. The efficiency search after 2001 and till 2009 are listed secondly. Sing, Sing, Munisamy (2008) studied Asia Pacific
Countries for the year 2006, by using input factors deposits and assets and output factors loans and interest income. Sufian (2009) used deposits, labor and fixed assets as input factors with loans and total income as output factors for Malaysia during the 2001 to 2004 period. Andreis (2010) studied Bulgaria, Czech Republic, Poland, Romania, Slovakia, Slovenia and Hungary for the 2004 – 2008 period by using deposits, fixed assets, operational expenses as input factors and loans, total investments and other incomes as output factors (Diler, 2011).
Particularly in Turkey, Zaim and Etuğrul (1996) study covers the 1981 – 1990 period and input factors are the number of employees, total interest expenses, amortization costs, other expenses, where output factors are the volume of short and long term deposits in Turkish Lira and short and long term loans in Turkish Lira. Jackson, Fethi and İnal (1998) study uses two input factors, which are the number of employees and non-labor operating expenses with output factors loans and deposits for the periods between 1992 - 1996. Işık and Hassan (2003) used loanable funds, labor and capital as input factors and short term loans, long term loans, off balance sheet items and other earning assets as output factors from 1981 to 1990 (Diler, 2011). BRSA uses financial ratios as input and output factors for the purpose of DEA (BDDK/Strateji Geliştirme Daire Başkanlığı, 2010).
In my DEA study, the difference from other studies is made in two dimensions. First by using quarterly data and secondly by selection of data. Input factors are labor, deposits, fixed assets and bank capital; output factors are non-performing loans net, securities, off balance sheet assets and loans. Within the output side, non-performing loans are the undesired ones. There are three hypotheses associated with non-performing loans, bad luck, bad management and skimping (Berger & Mester, 1997). If the reasons of these are impacts of negative shocks, they are assumed as exogenous factors and named with “bad
This may be due to lack of adequate number of trained employees in risk departments in the Turkish banking sector. However, this statement remains unconfirmed.
Shortcomings of performance evaluation with only traditional ratio analyses are addressed in several studies (Aysan & Ceyhan, 2008; Bowlin et al., 1985; Mercan et al., 2003; Ozkan-Gunay & Tektas, 2006), but ratio analyses as a part of performance studies are thought to be irreplaceable either in raw, in supporting format or as a part of a regression like analyses. As an example; ROE, ROA and NIM can be given for profitability and/or efficiency searches (Ariff & Can, 2008; Aygün et al., 2010; Aysan & Ceyhan, 2008; Barros, Managi, & Matousek, 2012; BDDK/Strateji Geliştirme Daire Başkanlığı, 2010; Berger et al., 2000; Berger & Mester, 1997; Bhaumik & Dimova, 2004; Fukuyama & Matousek, 2011; Mester, 1996; Park & Weber, 2006; Sarkar et al., 1998; Tabak & Langsch Tecles, 2010; Taşkın, 2011). Another study includes financial performance index construction to observe ownership mode and effect of scale. This study is done by applying DEA to fundamental financial ratios (Mercan et al., 2003).
Under the performance topic one of the questions addressed is the foreign banks performance amongst others. Around the globe, some studies suggest foreign banks are worse regardless of the period and the country being studied (Berger et al., 2000; Claessens & van Horen, 2011; Das & Ghosh, 2006; Fukuyama & Matousek, n.d.; Sanyal & Shankar, 2011; Sensarma, 2006), and some suggest foreign banks are better (Berger, 2007; Duygun Fethi & Pasiouras, 2010; El-Gamal & Inanoglu, 2005; Fries & Taci, 2005; Fujii, Managi, & Matousek, 2014; Qayyum, Khan, & Ghani, 2006; Sarkar et al., 1998; Staikouras, Mamatzakis, & Koutsomanoli-Filippaki, 2008). Some state that there is no evident performance difference between banks in some cases (Aysan & Ceyhan, 2008; Berger, 2007; Ozkan-Gunay & Tektas, 2006). Some studies link their findings to global banking theories, such as global advantage hypothesis and home field advantage hypothesis, but this study’s aim is not to state an opinion for supporting evidence on any of the global banking theories. According to the foreign banks perform better than domestic ones criteria, Austria, Egypt, Italy, Panama, Singapore, Tunisia, Algeria, Indonesia, Kenya, Poland, Slovenia and United States are found to be significantly better. Domestic banks perform better than foreign banks statement found support from Croatia, Luxemburg, Hong Kong and Thailand by being significantly efficient where others are considered as
insignificant. Turkey is not used in this study (Chen & Liao, 2011). Domestic and foreign banks’ comparative performance differences are also addressed in other studies. According to Classens et al. (2000), profitability of foreign banks is stated better than domestic banks in developed countries where in developing countries it is not so. According to Hassan and Hunter (1996), in the US foreign banks are observed less efficient than domestic banks. Vennet (1996) and Hassan and Lozanı-Vivas (1998) stated efficiency of domestic banks and foreign banks were nearly the same in developed countries, except the US. Yildirim and Philippatos (2002) studied Central and Eastern Europe’s transitional economies and found domestic owned private banks and state owned private banks more efficient than foreign banks. Bajaras et al. (2000) stated that domestic banks are less productive than foreign banks in Latin America. Another Latin American case was studied by Crystaletal (2001) and the performance gap between domestic and foreign banks are found very little (Sensarma, 2006). Particularly in Turkey, foreign banks are observed to be less efficient than domestic banks for the years between 1991 to 2007, contrasting with some of the previous studies (Akıncı et al., 2012). Study covering the 1987 – 1990 period stated that foreign banks were performing with better efficiency scores than the state owned banks (Isik & Hassan, 2003). Study covering the 1988 – 1996 period, also declares that domestic banks are outperformed by their competitors foreign banks (Isik & Hassan, 2002). 1989 – 1999 period of study states that the lowest performance in the banking sector belongs to state owned banks (Mercan et al., 2003). My results are in line with Akıncı et al. (2012) and contrasting with others for the updated period between 2001 and 2015.
Classification of the country or countries being studied, reforms in the analysis period, the analysis period, methodology used in the study and the political and historical background of the study environment change performance results significantly (Berg, Forsund, &
3. RATIO ANALYSES
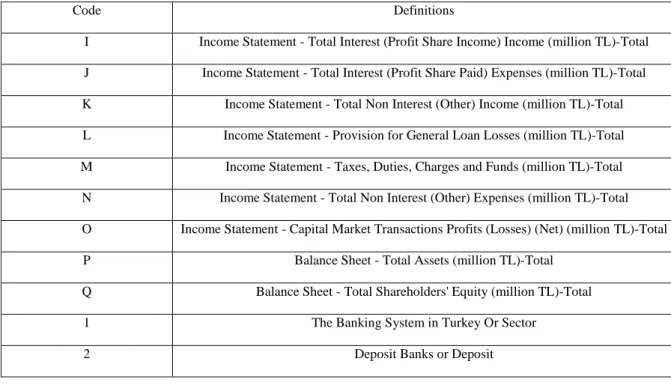
The data source of the banking system in Turkey, which consists of deposit banks, development and investment banks, state owned deposit banks, privately owned deposit banks, foreign banks and banks under the management of fund is the Banks Association of Turkey. Related quarterly data downloaded for 2001 to 2014 period to construct the bare bones of DuPont analysis. Yearly grand averages are calculated form these data. While conducting ratio analyses, average of balance sheet data is used. Reason for this is that a balance sheet data is a photo in time, whereas income statement covers a period. By using averages I tried to create a more representative figure for the period. Secondly, accounting data used in the analyses may not follow all the same procedures, but using cumulative data of a branch avoids this threat. The nature of DuPont analysis makes it possible to compare ratios one by one and this leads to a safer decision making. By seeing ratios individually reason for the changes can be observed in a better way. Data collection in the study is large and complex so for the ratio analyses, in order to increase functionality and the readability, a codebook is developed which allows extension and integration to future software programs. For the construction of this codebook same rationale behind Guide to Codebooks (ICPSR/University of Michigan, 2011) is followed. For the ratio analyses, in order to increase readability the codebook is given as follows:
Table 2 Codebook
Code Definitions
I Income Statement - Total Interest (Profit Share Income) Income (million TL)-Total
J Income Statement - Total Interest (Profit Share Paid) Expenses (million TL)-Total
K Income Statement - Total Non Interest (Other) Income (million TL)-Total
L Income Statement - Provision for General Loan Losses (million TL)-Total
M Income Statement - Taxes, Duties, Charges and Funds (million TL)-Total
N Income Statement - Total Non Interest (Other) Expenses (million TL)-Total
O Income Statement - Capital Market Transactions Profits (Losses) (Net) (million TL)-Total
P Balance Sheet - Total Assets (million TL)-Total
Q Balance Sheet - Total Shareholders' Equity (million TL)-Total
1 The Banking System in Turkey Or Sector
Code Definitions
3 Development and Investment Banks or Development & Investment
4 State-owned Deposit Banks or Deposit-State
5 Privately-owned Deposit Banks or Deposit-Domestic Private
6 Foreign Banks or Foreign
7 Banks Under the Deposit Insurance Fund
# Number
v Monetary
@ Average
According to this table; “vO1” represents Turkish banking sectors’ capital market transactions profits (losses) in Turkish Lira, code shows that the data is monetary with “v” and it’s about capital market transactions with “O” and it’s about the banking system in Turkey with “1”. Another example, “vP2” represents Deposit banks total assets in Turkish lira form, code shows that the data is monetary with “v” and it represents total assets with “P” and it represents the deposit banks with “2”. Further examples can be given by the combinations of these. v, # are used first; letters come second and numbers come in the third place to make a meaningful code of three. If average data is used @ comes between the first and second codes and a code of four is made.
3.1. Introduction to Ratios
In this part ratios are shown to demonstrate the analyses:
NI
ROE
AverageTE
NI
AverageTA
ROE
ROA x EM
x
AverageTA AverageTE
(3.1.2)Also, return on equity is calculated by multiplying return on assets with equity multiplier. Return on assets is calculated by dividing net income to average total assets. This ratio shows the income generated over firms’ assets. Equity multiplier is calculated by dividing average total assets to average total equity. Equity multiplier reflects debt financing to shareholders equity in such a way that total equity is formed with the combination of either with debt financing or stockholders financing. Therefore, equity multiplier is the sign of financial leverage and it does not only show profitability but also shows risk. See equation (3.1.2). There is no generally accepted definition for all of the ratios in finance. In this study in order to ignore the income that a firm has generated for debt investors, net income is divided to average total assets. If I wanted to observe this feature, earnings before interests and taxes (EBIT) should be divided to total assets.
NI NIIBurdenPLLSGT (3.1.3) Net income is calculated by subtracting burden, provision for loan losses (PLL) and taxes(T) and adding realized security gains or losses(SG) to net interest income (NII). This calculation is shown in equation (3.1.3).
NI IIIE OEOI PLLSGT (3.1.4) In equation (3.1.4), net interest income is calculated by subtracting interest expenses(IE) from interest incomes(II). Burden is calculated by subtracting non-interest income(OI) from non-interest expenses(OE). By this expression we mean that net income is related to assets and liabilities. This implies that the composition of assets and liabilities affects net income. There may be many assets and liabilities in the portfolio, so they are noted with “i” and “j” respectively.With the notions, yi, yields of earning assets before taxes and cj,
interest costs of liabilities, Ai, monetary values of assets and the Lj, monetary values of
liabilities, we can express net income to show the importance of portfolio composition as follows: 1 1 n m i i j j i j NI y A c L Burden PLL SG T
(3.1.5)If one needs a detailed research about reasons of net income fluctuations of a firm, expression given in equation (3.1.5) can be used. I prefer to use equation (3.1.4) in this study, because using consolidated data limits the usage of expression in equation (3.1.5).
NI Total Revenue Total Operating Expense Taxes (3.1.6) Net income can be expressed as in equation (3.1.6) to show further decomposition of return on equity and return on assets. Total Revenue(TR) is the summation of interest income, operating income and realized security gains or losses. Total operating expenses(EXP) is the summation of interest expenses, non-interest expenses and provision for loan losses. This expression implies decomposition of return on assets. Return on assets is a function of expense ratio(ER), asset utilization(AU) and tax ratio.
EXP
IE
OE
PLL
ER
AverageTA
AverageTA
AverageTA
AverageTA
(3.1.7)Expense ratio can be calculated as in equation (3.1.7). It’s the combination of three ratios, which are interest expense ratio, non-interest expense ratio and provision for loan losses ratio. A higher ratio shows a harder situation to control expenses, therefore less efficiency in controlling them. Vice versa is applicable.
TR
II
OI
SG
AU
AverageTA
AverageTA
AverageTA
AverageTA
(3.1.8)Asset utilization can be calculated as in (3.1.8). This ratio shows how much income a firm generates from its assets.
Applicable IncomeTaxes
Tax Ratio
AverageTA
Burden ratio shows non-interest expenses coverage by non-interest income as a ratio of average total assets and its calculation is in equation (3.1.12). This ratio is important, because it shows service charges, fees, security gains etc., which generates an income to cover the non-interest expenses.
Noninterest expense Noninterest income
Burden RatioAverageTA
(3.1.12)
Efficiency ratio(EFF) shows how a bank controls non-interest expenses relative to net interest incomes and non interest incomes. Calculation of an efficiency ratio is in equation (3.1.13)
Non interest expenses
Net interest income+Non interest income
Efficiency ratio (3.1.13)
Important notice about ratio analyses: First of all, I must mention a type of DuPont analysis is made with minor touches to fit the system to banking sector data. While conducting ratio analyses, average of balance sheet data is used. Reason for this is that a balance sheet data is a photo in time, whereas income statement covers a period. By using averages, I tried to create a more representative figure for the period. Secondly, accounting data used in the analyses may not follow all the same procedures but using cumulative data of a branch ignores this threat. The nature of DuPont analysis makes it possible to compare ratios one by one and this leads to a safer decision making. By seeing ratios individually, reason for the changes can be observed in a better way.
3.2. Ratio Analyses Data and Methodology
After this introduction, it is time to explain how code book is used to calculate these ratios in my analyses. Data are available in Appendix A. Ratio analyses in banking sector play a vital role on performances. Data source of the banking system in Turkey, deposit banks, development and investment banks, state owned deposit banks, privately owned deposit banks, foreign banks and banks under the management of fund is the Banks Association of Turkey. A type of DuPont analysis is made with minor touches to fit the system to banking sector data as seen in the Figure 2 (Koch & MacDonald, 2015). Related quarterly data downloaded for the 2001 to 2014 period to construct the bare bones of DuPont analysis.
Yearly grand averages are calculated from these data. A graphical illustration of DuPont scheme is given as follows:
Figure 2 DuPont Scheme
According to illustration calculations are given below.
For the Banking sector in Turkey analyses are done according to the following pattern. ROE1 = [vI1 + vK1 + vO1-(vJ1+vN1+vL1)-vM1]/v@Q1
ROA1 = [vI1-vJ1-(vN1-vK1)-vL1+vO1-vM1]/v@P1 Return On Equity 𝑁𝑒𝑡 𝐼𝑛𝑐𝑜𝑚𝑒 𝐴𝑣. 𝑇𝑜𝑡𝑎𝑙 𝐸𝑞. Return On Assets 𝑁𝑒𝑡 𝐼𝑛𝑐𝑜𝑚𝑒 𝐴𝑣. 𝑇𝑜𝑡𝑎𝑙 𝐴𝑠𝑠𝑒𝑡𝑠 Asset Utilization 𝑇𝑜𝑡𝑎𝑙 𝑅𝑒𝑣𝑒𝑛𝑢𝑒 𝐴𝑣. 𝑇𝑜𝑡𝑎𝑙 𝐴𝑠𝑠𝑒𝑡𝑠 𝐼𝑛𝑡𝑒𝑟𝑒𝑠𝑡 𝐼𝑛𝑐𝑜𝑚𝑒 𝐴𝑣. 𝑇𝑜𝑡𝑎𝑙 𝐴𝑠𝑠𝑒𝑡𝑠 𝑂𝑝𝑒𝑟𝑎𝑡𝑖𝑛𝑔 𝐼𝑛𝑐𝑜𝑚𝑒 𝐴𝑣. 𝑇𝑜𝑡𝑎𝑙 𝐴𝑠𝑠𝑒𝑡𝑠 𝑆𝑒𝑐𝑢𝑟𝑖𝑡𝑦 𝐺𝑎𝑖𝑛𝑠 𝐴𝑣. 𝑇𝑜𝑡𝑎𝑙 𝐴𝑠𝑠𝑒𝑡𝑠 Tax Ratio Expense Ratio 𝑇𝑜𝑡𝑎𝑙 𝐸𝑥𝑝𝑒𝑛𝑠𝑒 𝐴𝑣. 𝑇𝑜𝑡𝑎𝑙 𝐴𝑠𝑠𝑒𝑡𝑠 𝐼𝑛𝑡𝑒𝑟𝑠𝑡 𝐸𝑥𝑝𝑒𝑛𝑠𝑒 𝐴𝑣. 𝑇𝑜𝑡𝑎𝑙 𝐴𝑠𝑠𝑒𝑡𝑠 𝑂𝑝𝑒𝑟𝑎𝑡𝑖𝑛𝑔 𝐸𝑥𝑝𝑒𝑛𝑠𝑒 𝐴𝑣. 𝑇𝑜𝑡𝑎𝑙 𝐴𝑠𝑠𝑒𝑡𝑠 𝑃𝑟𝑜𝑣𝑖𝑠𝑖𝑜𝑛 𝑓𝑜𝑟 𝐿𝑜𝑎𝑛 𝐿𝑜𝑠𝑠𝑒𝑠 𝐴𝑣. 𝑇𝑜𝑡𝑎𝑙 𝐴𝑠𝑠𝑒𝑡𝑠 Equity Multiplier 𝐴𝑣. 𝑇𝑜𝑡𝑎𝑙 𝐴𝑠𝑠𝑒𝑡𝑠 𝐴𝑣. 𝑇𝑜𝑡𝑎𝑙 𝐸𝑞.
SG1 = vO1 T1 = vM1
AU1 = (vI1 + vK1 + vO1)/v@P1 ER1 = (vJ1 + vN1 + vL1)/v@P1 TR1 = vI1 + vK1 + vO1
EXP1 = vJ1 + vN1 + vL1
BURDEN RATIO1 = (vN1 - vK1)/v@P1 EFF1 = vN1/[(vI1-vJ1)+vK1]
For the Deposit banks in Turkey analyses are done according to the following pattern. ROE2 = [vI2 + vK2 + vO2-(vJ2+vN2+vL2)-vM2]/v@Q2
ROA2 = [vI2-vJ2-(vN2-vK2)-vL2+vO2-vM2]/v@P2 EM2 = v@P2/v@Q2 NI2 = vI2-vJ2-(vN2-vK2)-vL2+vO2-vM2 NII2 = vI2 - vJ2 Burden2 = vN2 - vK2 PLL2 = vL2 SG2 = vO2 T2 = vM2
AU2 = (vI2 + vK2 + vO2)/v@P2 ER2 = (vJ2 + vN2 + vL2)/v@P2 TR2 = vI2 + vK2 + vO2
BURDEN RATIO2 = (vN2 - vK2)/v@P2 EFF2 = vN2/[(vI2-vJ2)+vK2]
For the development and investment banks in Turkey analyses are done according to the following pattern.
ROE3 = [vI3 + vK3 + vO3-(vJ3+vN3+vL3)-vM3]/v@Q3 ROA3 = [vI3-vJ3-(vN3-vK3)-vL3+vO3-vM3]/v@P3 EM3 = v@P3/v@Q3 NI3 = vI3-vJ3-(vN3-vK3)-vL3+vO3-vM3 NII3 = vI3 - vJ3 Burden3 = vN3 - vK3 PLL3 = vL3 SG3 = vO3 T3 = vM3
AU3 = (vI3 + vK3 + vO3)/v@P3 ER3 = (vJ3 + vN3 + vL3)/v@P3 TR3 = vI3 + vK3 + vO3
EM4 = v@P4/v@Q4 NI4 = vI4-vJ4-(vN4-vK4)-vL4+vO4-vM4 NII4 = vI4 - vJ4 Burden4 = vN4 - vK4 PLL4 = vL4 SG4 = vO4 T4 = vM4
AU4 = (vI4 + vK4 + vO4)/v@P4 ER4 = (vJ4 + vN4 + vL4)/v@P4 TR4 = vI4 + vK4 + vO4
EXP4 = vJ4 + vN4 + vL4
BURDEN RATIO4 = (vN4 - vK4)/v@P4 EFF4 = vN4/[(vI4-vJ4)+vK4]
For the privately owned deposit banks in Turkey analyses are done according to the following pattern.
ROE5 = [vI5 + vK5 + vO5-(vJ5+vN5+vL5)-vM5]/v@Q5 ROA5 = [vI5-vJ5-(vN5-vK5)-vL5+vO5-vM5]/v@P5 EM5 = v@P5/v@Q5 NI5 = vI5-vJ5-(vN5-vK5)-vL5+vO5-vM5 NII5 = vI5 - vJ5 Burden5 = vN5 - vK5 PLL5 = vL5
SG5 = vO5 T5 = vM5
AU5 = (vI5 + vK5 + vO5)/v@P5 ER5 = (vJ5 + vN5 + vL5)/v@P5 TR5 = vI5 + vK5 + vO5
EXP5 = vJ5 + vN5 + vL5
BURDEN RATIO5 = (vN5 - vK5)/v@P5 EFF5 = vN5/[(vI5-vJ5)+vK5]
For the foreign banks in Turkey analyses are done according to the following pattern. ROE6 = [vI6 + vK6 + vO6-(vJ6+vN6+vL6)-vM6]/v@Q6
ROA6 = [vI6-vJ6-(vN6-vK6)-vL6+vO6-vM6]/v@P6 EM6 = v@P6/v@Q6 NI6 = vI6-vJ6-(vN6-vK6)-vL6+vO6-vM6 NII6 = vI6 - vJ6 Burden6 = vN6 - vK6 PLL6 = vL6 SG6 = vO6