YAŞAR UNIVERSITY
GRADUATE SCHOOL OF SOCIAL SCIENCES BUSINESS ADMINISTRATION
DISSERTATION FOR THE DEGREE OF DOCTOR OF PHILOSOPHY
THE EFFECT OF INTERNET SEARCH VOLUME (ISV) ON STOCK RETURN VOLATILITY
SEMEN SON
Supervisor: Assist. Prof. Dr. R. Serkan Albayrak Co-Supervisor: Prof. Dr. Pınar Evrim Mandacı
ii
TUTANAK
T.C.
YAŞAR ÜNİVERSİTESİ
SOSYAL BİLİMLER ENSTİTÜSÜ DOKTORA TEZİ JÜRİ SINAV TUTANAĞI
1) Bu halde adaya 6 ay süre verilmiştir.
2) Bu halde öğrencinin kaydı silineceğinden jüri red kararı hakkında en az bir sayfalık bir
gerekçe yazarak sınav tutanağına eklemelidir.
3) Bu halde sınav için yeni bir tarih belirlenir.
4) Bu halde varsa öğrencinin mazeret belgesi Enstitü Yönetim Kurulunda görüşülür.Öğrencinin
geçerli mazereti olmaması halinde Enstitü Yönetim Kurulu kararı ile ilişiği kesilir.Mazereti geçerli sayıldığında yeni bir sınav tarihi belirlenir.
iii
ACKNOWLEDGEMENTS
Firstly, I would like to extend my sincere thanks to my advisor and my co-advisor, who through their support and encouragement, have guided me throughout this process, to bring this thesis to perfection. My advisor Assistant Professor Raif Serkan Albayrak, has always been there with devotion to pose the fiercest and most challenging questions pushing the limits of critical thinking. I am thankful for the enthusiasm and dedication we shared in creating value and contributing to the advancement of social science. My co-advisor Professor Pınar Evrim Mandacı, has always offered her kind and attentive guidance, be it face-to-face on a hot summer day when the university was almost empty or late at nights going to elaborate lenghts to provide valuable timely feedback in the form of emails. Thank you for being the other utmost critical and disciplined supervisor to this work. The third member of my dissertation committee, who has been with me since the first day of this academic journey. Associate Professor, Çağrı Bulut, I value your insightful feedback and never-ending genuine support to this thesis. Thank you for always believing in me and my work and for being a great mentor. A heartfelt thank you goes out to Professor Hasan Fehmi Baklacı, who through his valuable comments on behavioral finance enriched this work. Thank you for taking the time out of your busy schedule and offering your kind suggestions. Another sincere thank you goes out to Assistant Professor Fatma Dilvin Taşkın, who kindly provided interesting feedback and resourceful comments. Thank you for contributing to the fulfillment of this thesis. Secondly, I would like to express my gratefulness to Associate Professor Hakan Kahyaoğlu, whom I met thanks to my co-advisor, Professor Pınar Evrim Mandacı. Thank you for your valuable contributions to important aspect of the econometric modelling framework of this thesis. Thirdly, I would like to thank Barış Turan, my partner in life, for his patience and continuous support. Lastly, I am extremely grateful and indebted to my family, my mother Handan, my father Aydil and my dearest brother Serhan Son. Without their love, support and inspiration throughout my life and during this tiring and challenging process, I could not have accomplished anything I did. This thesis is dedicated to my mother, my role model in life, my best friend and ultimate teacher, the most selfless and perfect human being I know of. She is my rock in my life and the reason that I am what and who I am.
iv
YEMİN METNİ
Doktora Tezi olarak sunduğum “The Effect of Internet Search Volume (ISV) on Stock Return Volatility” adlı çalışmanın, tarafımdan bilimsel ahlak ve geleneklere aykırı düşecek bir yardıma başvurmaksızın yazıldığını ve yararlandığım eserlerin bibliyografyada gösterilenlerden oluştuğunu, bunlara atıf yapılarak yararlanılmış olduğunu belirtir ve bunu onurumla doğrularım.
..../..../...
Semen SON
v
ÖZET Doktora Tezi
İNTERNET ARAMA HACMİNİN HİSSE SENEDİ GETİRİSİ OYNAKLIĞI ÜZERİNDEKİ ETKİSİ
Semen SON Yaşar Üniversitesi Sosyal Bilimler Enstitüsü İşletme Doktora Programı
Bu çalışmanın temel amacı, internet arama hacminin, bireysel yatırımcı hissiyatını temsil eden bir dışsal değişken olarak kullanılması suretiyle, hisse senedi getirisi oynaklığı üzerindeki etkisini araştırmaktadır. Çalışmada internet arama hacmi değişkeni ile birlikte işlem hacmi değişkeni de ele alınarak her ikisinin oynaklık üzerindeki etkisi incelenmiştir. Çalışma, NASDAQ, NYSE and BIST piyasalarında işlem gören 52 ABD ve Türk şirketini ele almakta ve Ocak 2004-Eylül 2013 dönemini kapsamaktadır. ABD şirketleri ayrıca e-ticaret şirketi olan ve olmayan şirketler olmak üzere iki alt gruba ayrılmıştır. E-ticaret şirketleri ayrı bir örneklem olarak incelenmiştir. Bu şekilde yatırımcı ve müşteri ayırt edilerek isim-bazlı internet arama sorgularının bireysel yatırımcıya ait olduğu gösterilmiştir. İki farklı koşullu ortalama tanımıyla oluşturulan GARCH(1,1) modellerinin sonuçları bu prosedürün uygunluğunu teyit etmektedir. Internet arama hacmi ile hisse senedi getiri oynaklığı arasındaki ilişkinin yönünü belirlemek amacıyla Granger nedensellik testi kullanılmıştır. Tüm testler şirket bazında yapılmıştır.
Ampirik bulgular, çalışmada bireysel yatırımcı hissiyatını ölçmede kullanılan işlem hacmi ve internet arama hacminin tek tek etkisini her iki ülke piyasası hisse senetleri için de ortaya koymaktadır. Bunlardan geleneksel bir hissiyat değişkeni olan işlem hacmi değişkeninin etkileri ABD senetlerinde daha belirgin olarak gözlemlenmektedir. Bunun yanısıra, çalışmada işlem hacmi ile internet arama hacminin ortak etkisinin varlığı da gözlemlenmektedir. İki değişken, sırayla, şartlı oynaklık denklemine dahil edildiğinde, oynaklık süreğenliğinin azaldığını ancak hisselerin hata terimlerinin büyük çoğunluğunda GARCH etkisinin devam ettiği ortaya konulmaktadır. Granger nedensellik testleri bağlamında zamansal bir sıralamadan söz etmek mümkün değildir. Bu çalışma, diğer çalışmalardan farklı olarak yatırımcı hissiyatını ölçmede sıkça kullanılan işlem hacmi değişkeninin yanında literatürde çok sık rastlamadığımız internet arama hacmi değişkeninin hisse senedi oynaklığına etkisini incelemektedir. Gözlemleyebildiğimiz kadarıyla internet arama hacminin Türk hisse senedi piyasasının oynaklılığına etkisini inceleyen bir çalışma bulunmamaktadır. Böylelikle çalışmadan elde edilen sonuçlar gerek ulusal gerekse uluslararası davranışsal finans literatürüne önemli katkılar sağlamaktadır.
Anahtar kelimeler: GARCH, Koşullu Oynaklık, Granger Nedensellik, İnternet
vi
ABSTRACT PhD Thesis
THE EFFECT OF INTERNET SEARCH VOLUME (ISV) ON STOCK RETURN VOLATILITY
Semen SON Yaşar University
Graduate School of Social Sciences PhD in Business Administration
The aim of this study is to investigate the impact of investor sentiment on stock return volatility by using a novel proxy as exogenous variable: internet search volume. Internet search volume is also analyzed together with trading volume and the effects of both on stock return volatility are being reported. The data set consists of a total of 52 U.S. and Turkish companies belonging to NASDAQ, NYSE and BIST markets for the period of January 2004-September 2013. U.S. companies are divided into two groups of e-businesses and non-e-businesses. This procedure justifies the attribution of name-based search queries to individual investor sentiment by differentiating between customers and investors. GARCH(1,1) model results obtained from two different conditional mean specifications confirm the correctness of this reasoning. All models along with Granger causality testing are applied on a company basis.
Empirical findings show significant investor sentiment effects for each security listed on both countries’ exchanges. Also, evidence on the significant effect of internet search volume with a second, traditional investor sentiment measure, trading volume, is presented while the latter is relatively more pronounced in securities belonging to U.S. markets. As the model becomes more nested, there is an evident decline in volatility persistence, however in no case, on the average, the GARCH effect vanishes. No generalizable Granger causal relation between these two exogenous variables is uncovered. Overall, findings suggest that stock return volatility is not only conditional upon its previous values but also on investor sentiment and information flow.
The study differentiates itself from others in that it uses trading volume together with a novel investor sentiment variable, ISV. To the best of our knowledge, there exists no Turkish study that studies the effects of ISV on stock return volatility. The results contribute to both, global and local behavioral finance literature.
Keywords: GARCH, Conditional Variance, Granger Causality, Internet Search
vii
THE EFFECT OF INTERNET SEARCH VOLUME (ISV) ON STOCK RETURN VOLATILITY TABLE OF CONTENTS TUTANAK ii ACKNOWLEDGEMENTS iii YEMİN METNİ iv ÖZET v ABSTRACT vi
TABLE OF CONTENTS vii
LIST OF TABLES ix
LIST OF FIGURES x
LIST OF FORMULAS xi
LIST OF ABBREVIATIONS xii
INTRODUCTION xiii
CHAPTER 1 BACKGROUND
1.1. Motivation 1
1.2. Aim and Scope 2
1.3. Significance 3
1.4. Structure of Thesis 4
CHAPTER 2
LITERATURE REVIEW AND THEORETICAL FRAMEWORK
2.1. Classical Finance 5
2.1.1. The EMH 6
2.1.2. Asset Pricing Models 7
2.1.3. Criticism and Challenges to CAPM and EMH 9
2.2. Behavioral Finance and Prospect Theory 12
2.2.1. Pillars of Investor Behavior 14
2.2.2. Heuristics 16
2.3. Noise Trading Models 18
2.4. Volatility 20
2.4.1. Studies on Volatility Measurement with Exogenous Variables 22
2.4.2. Sources of Idiosyncratic Volatility 24
2.4.3. Measuring Idiosyncratic Volatility 28
2.5. Proxies of Investor Sentiment and Trading Volume 28
2.6. ISV as New Proxy for Investor Sentiment 33
viii
CHAPTER 3 METHODOLOGY
3.1. Financial Time Series Data 44
3.2. Pre-Testing 46
3.2.1. Unit Root Testing 43
3.2.2. Testing for ARCH Effects in the Error Term 47
3.3. Modelling 50
3.4. Post-Modelling (Diagnostic Tests) 51
3.4.1. Testing for Serial Correlation (Ljung - Box Q Statistic) 51
3.4.2. Testing for ARCH Effects 52
3.5. Granger Causality Testing for Causal Ordering 52
CHAPTER 4
THE MODEL, DATA AND EMPIRICAL FINDINGS
4.1. Hypothesis Formulation 54
4.2. Assumptions 57
4.3. Sampling 57
4.4. Data and Descriptive Statistics 59
4.5. Empirical Findings 67 CHAPTER 5 CONCLUSION 5.1. Discussion of Findings 87 5.2. Limitations 90 5.3. Contribution 91
5.4. Suggestions for Further Research 91
REFERENCES 93
APPENDIX 111
ix
LIST OF TABLES
Table 1: Empirical Evidence on Idiosyncratic Risk and Return 28
Table 2: Traditional Measures of Investor Sentiment 30
Table 3: Overview of Research Hypotheses 54
Table 4: Model Specifications 56
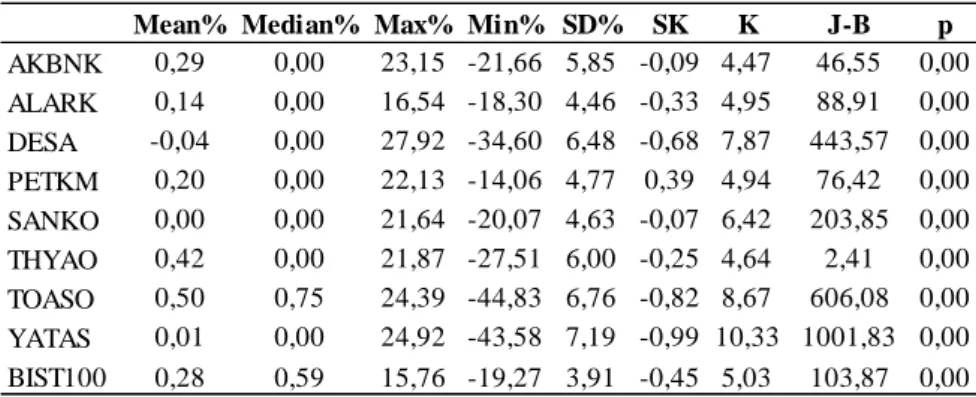
Table 5: Descriptive Statistics for Stock Price Returns 62
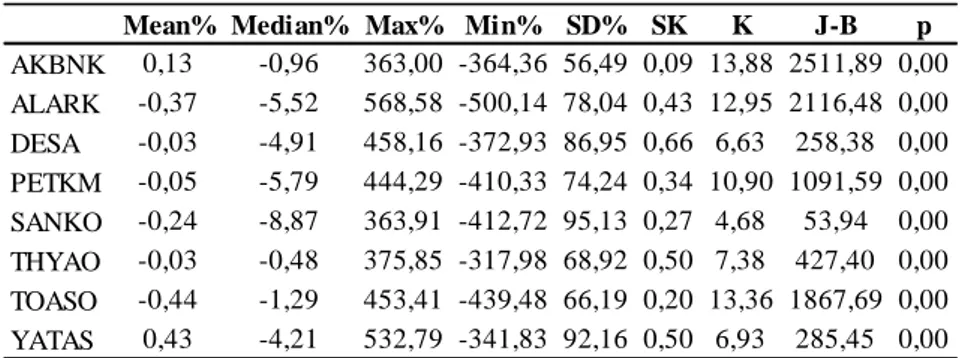
Table 6: Descriptive Statistics for Trading Volume 64
Table 7: Descriptive Statistics for ISV 66
Table 8: Residual Diagnostics for INTC 68
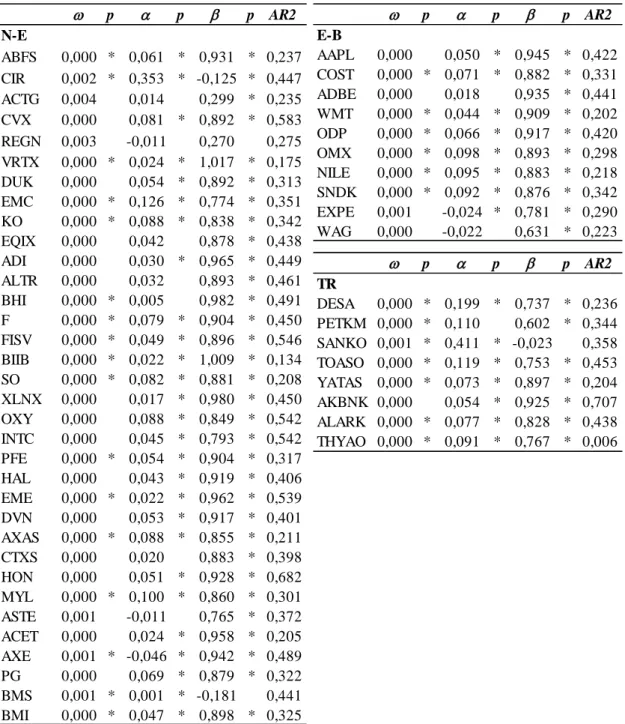
Table 9: Model 1: MM-G(1,1) Results 69
Table 10: Model 2: MM-G(1,1)-ISV Results 71
Table 11: Model 3: MM-G(1,1)-ISV-Trading Volume Results 73
Table 12: Results for Base and Nested AR(1)M-G(1,1) Models 76
Table 13: VAR Lag Order Selection for INTC 81
Table 14: Granger Causality Test Results 82
x
LIST OF FIGURES
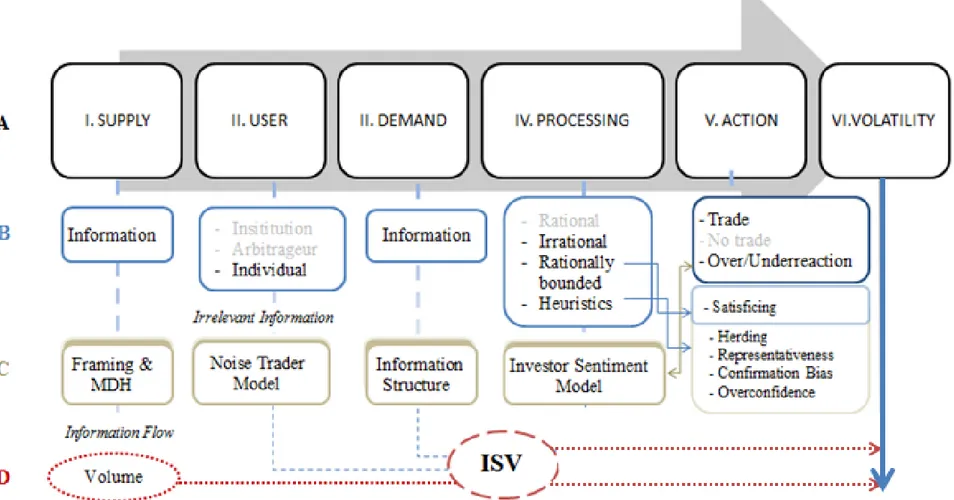
Figure 1 The Volatility Enigma 41
Figure 2 Google Trends Screen Print 111
xi
LIST OF FORMULAS
Equation 1: CAPM 8
Equation 2: The Market Model 8
Equation 3: F/F 3 Model 11
Equation 4: Total Volatility 21
Equation 5: OLS Regression 22
Equation 6: ADF Unit Root Test 46
Equation 7: The AR(p) Model 48
Equation 8: Mean Specifications 48
Equation 9: ARCH (1) and ARCH(q) Conditional Variances 49
Equation 10: Squared Residuals for ARCH Testing 49
Equation 11: GARCH (1,1) Conditional Variance 50
xii
LIST OF ABBREVIATIONS
ARCH Autoregressive Conditional Heteroskedasticity
BIST-100 Borsa Istanbul 100 Index (former IMKB- /ISE-100)
CAPM Capital Asset Pricing Model
EMH Efficient Market Hypothesis
F/F 3 Model Fama-French 3 Factor Model
GARCH Generalized Autoregressive Conditional Heteroskedasticity
ISV Internet Search Volume
MDH Mixture of Distributions Hypothesis
NASDAQ National Association of Securities Dealers Automated Quotations
xiii
INTRODUCTION
“Now, the question is no longer, as it was a few decades ago, whether investor sentiment affects stock prices, but rather how to measure investor sentiment and quantify its effects.”
Malcolm Baker and Jeffrey Wurgler (2007: 130)
Are asset prices predictable? The search for an answer to this long-debated question has spurred a remarkable outpouring of literature encompassing various disciplines grounded in theories extending over centuries.
It was, especially during the second half of the twentieth century, that researchers ardently conjectured hypotheses based on premises of the rationality of the decision maker. The idea was simple: If investors were utility maximizing rational decision makers and had free access to all information on securities, the market price of a security would equal its expected value. Thus, no investor, using a certain trading strategy, would be able to make superior profits. Consequently, asset prices models of the time, considered only one risk factor to be influencing expected security prices: the risk or the movements of the market, commonly referred to as “systematic risk”. Any residual or “idiosyncratic” risk, was presumed to be negligible because rational investors would supposedly diversify it away. This general idea of the informational efficiency of markets and the existence of the rational decision makers having homogeneous expectations regarding stock prices prevailed till the early 1980s.
It was initially through empirical findings suggesting auto-correlation inherent in previous values of a security, that the non-predictability of asset prices came to be challenged. These developments instigated a bulk of research referred to as “market anomalies”. Researchers thus, started reconsidering the basic premises of rationality and informationally efficient markets.
Some argued that patterns of predictability may be traced to irrational traders acting in concert and misinterpreting information. Others, believing in perfect
xiv
markets, while acknowledging the counter-evidence to non-predictability, argued that any irrational movement would be arbitraged away by rational institutional traders thus rendering irrational behavior trivial to the stock price formation process. Yet, another strand of literature, posited that there are limits to arbitrage and that prices may deviate to such extremes that even rational traders may no longer be willing, or have the capacity to, make counter-trades. While irrationality was attributed mostly to individuals, there are also studies who accuse institutions of acting upon “noise”.
In parallel to empirical findings, finance researchers started to become aware and acknowledge studies on investor sentiment from behavioral psychology literature. Therein investors trading on noise rather than information were not necessarily considered as irrational. Rather, the concept of bounded-rationality, exemplifying the limits to human memory and capacity was embraced. In that regard, non-rational investor behavior was attributed to certain ways of behaving or “heuristics”. Next to various other heuristics, investor sentiment emerged as such heuristic-driven explanation in many finance papers viewing “behavioral finance” as a sub-discipline.
Overall, the predominant view of rational investors operating in informationally efficient markets marked by no arbitrage opportunities rendering any strategy geared towards the prediction of stock prices valueless, was replaced with the recognition of limits to arbitrage, investors being rationally-bounded and acting together based on their sentiment.
The econometric modelling literature, too experienced changes over the course of decades. Seminal studies on stock price volatility used to consider the residual or the noise term as displaying a constant variance. Thus the ordinary least squares regression (OLS) was used for volatility modelling purposes. However, once empirical findings demonstrating that stock prices contain autocorrelation started populating literature new models were developed factoring in autoregressive terms.
xv
While believers in informationally efficient markets still exist, there is a growing dominance in literature of believers in the complementary value of behavioral explanations to financial phenomena.
Studies presenting investor sentiment as a variable that needs to be analyzed in that realm, have used various direct and indirect measures such as surveys, firm ratios and trading volume among others. However, with the growth of technology and the availability of internet search queries data offered as a free database, these traditional measures are likely to be complemented by a novel proxy: Internet Search Volume (ISV).
The citation by Baker and Wurgler (2007) underscores that traditional, or classical, theories of stock price formation need to be supplemented by measures of sentiment. This thesis analyzes ISV as proxy for investor sentiment affecting the conditional movements of stock prices, in isolation and combination with one of the most popular traditional proxies, trading volume.
1
CHAPTER 1 BACKGROUND
1.1. Motivation
Following Keynes’ statement in 1937 that human beings are guided by animal spirits, social science researchers have since been wondering about the cognitive processes affecting decision making. Translated into the financial markets setting in particular, the basic premise of the investor who is taking decisions rationally, is challenged by the rationally-bounded investor. The rational investor, having free access to all available related information, is assumed to be able to fully-diversify his portfolio1. As such, he would, for instance, prefer to buy index funds instead of wasting energy on stock picking. However, not all investors are rational decision makers, furthermore not all investors have access to all information or are free of financial limitations.
This awareness has led us to think about whether individual investors can influence stock prices. Thus; our starting ground becomes: Does the individual investor impact movements of stock prices?
Although data on the percentage of institutional stock ownership is present, no clear-cut line between the rational “institutional” (mutual funds, hedge funds, pension funds, private equity funds) and the “individual” investors can be drawn, since the latter are also invested in those institutions. Therefore it is difficult to determine the percentage of individual investors invested in a certain security.
Thus; since it is impossible to observe the consequences of action of individual investors directly, we are in need of a quantifiable proxy. In that realm ISV data presents itself as a valuable source of information.
In practice, noise is observed in stock prices. Since the early 1980’s, literature researching potential causes and modelling stock volatility has grown so much that it
1
2
has become a gigantic topic in finance. While early research has concentrated on stock market volatility as a whole, the attention has shifted to encompass the analysis of the volatility of individual stocks.
The motivation of this thesis comes from: (a) empirical evidence that counters the premises of informational efficiency of markets and non-predictability of stock prices (b) theoretical explanations of such based on behavioral heuristics (c) the ongoing quest in academic research that seeks to uncover factors underlying aggregate volatility and noise (d) the bulk of investor sentiment literature along with trading volume and the mixture of distributions hypothesis (e) technological developments offering access to sources of financial time series data, ISV, whose value to volatility studies, remains, as of yet, mostly unexplored.
1.2. Aim and Scope
The aim of this thesis is to uncover the effect of a newly emerging proxy of investor sentiment; ISV, on stock return volatility and analyze its interaction and effect on conditional volatility along with trading volume. In this process, alternative mean and variance specifications are formulated. The reason we use the additional variable, trading volume, is that in the strictest sense, the Efficient Market Hypothesis (EMH) argues that prices are always correct and reflect all available information. Thus, there should be little disagreement as to the price formation. Then, there should be very little trading, based on this reasoning. If there are differences in beliefs regarding information, only then would there be trading beyond liquidity needs. So, EHM does not accept heterogenous beliefs, but behavioral finance, does. Trading volume, is predominantly said to proxy the pace of information flow into the market and some researchers go as far as to argue that it accounts for the volatility clustering effects in underlying securities. So, if we analyze trading volume in conjunction with ISV, our results may shed further light to the volatility literature.
The empirical framework is based on theoretical approaches of behavioral finance focusing on noise trading and investor sentiment.
3
The data used in the final sample belongs to a broad selection of stocks from the U.S. National Association of Securities Dealers Automated Quotations (NASDAQ) and New York Stock Exchange (NYSE) markets and the BIST-100 Index of Borsa Istanbul. ISV data is obtained from the Google Trends website.
To double-check the adequacy of using company names as keywords in representing ISV data and, secondly, to develop the argument that ISV data used in this study is more representative of the financial investor rather than a potential consumer, a separate sample of e-businesses is used.
Empirical tests involve conditional volatility modelling using GARCH methodology proposed by Bollerslev (1986). The temporal relationship of stock return with ISV and trading volume variables are investigated through Granger Causality analysis (Granger, 1969).
ISV data provided by Google is at a weekly frequency and available only since January 2004. Thus, the time frame of analysis is between January 2004-September 2013 for most stocks, with the exception of a few who have fewer available observations.
1.3. Significance
This thesis belongs to a recently emerging strand of finance literature on the importance of investor sentiment measured through ISV. The usage of ISV information in explaining financial phenomena is based on the seminal study of Da, Engelberg and Gao (2011). To the best of our knowledge, this is the first thesis that uses ISV data in this particular context.
Presenting ISV as a proxy for investor sentiment and determining its effects on stock return volatility along with trading volume effects and in isolation, has an important implication for asset pricing literature: the potential need to integrate an additional explanatory variable.
4
Furthermore, the inclusion of data belonging to stock markets from two countries; the USA and Turkey, allows for an original comparative study.
Details of the research methodology and findings of this thesis are relevant to all players in financial markets, including regulators and investors, and practitioners in derivatives markets as well as academicians in finance.
1.4. Structure of Thesis
The tesis consists of five chapters. Following the present chapter 1, chapter 2 discusses related empirical and theoretical studies starting with classical finance concepts of the EMH, the Random Walk Hypothesis, Rationality and Expected Utility Theories. The chapter moves through challenges to efficient markets, both, on theoretical grounds embodied in the behavioral finance literature, and, empirical findings like market anomalies. Conditional volatility studies are briefly presented. The chapter concludes with the investor sentiment literature, the mixture of distributions hypothesis-trading volume and ISV literature followed by the research questions. Chapter 3 provides a basic discussion on financial time series data and volatility (conditional volatility) modelling. Chapter 4 presents the empirical model along with various mean and variance specifications derived from a synthesis of the preceding two chapters. Data and sampling procedures are given in detail followed by the results of empirical anaysis. And lastly, chapter 5 discusses the findings, limitations and contributions of the study and provides suggestions for further research.
5
CHAPTER 2
LITERATURE REVIEW AND THEORETICAL FRAMEWORK
The conceptual framework of related literature goes back to the early 1600s and is grounded in mathematics, probability and philosophy.
This chapter starts with a discussion of EMH and asset pricing models and is followed by an account of the challenges it has encountered. The concept of risk underlying stock returns embodied by the concept of volatility is the focal point of this chapter and is disaggregated between systematic and idiosyncratic components.
As underlying assumptions related to decision making processes of investors change, so does the shift of attention to modelling idiosyncratic risk through conditional volatility models.
The search for the source of idiosyncratic risk and its behavior has led to the rise of noise trader models attributing this volatility component to a concerted effort on part of non-rational investors. In time, as opposed to classical beliefs regarding its randomness, certain patterns were discovered and the quest for uncovering the reasons of such, began.
Subsequently, measures seeking to proxy non-observable investor sentiment have emerged, one of such is the popularly used trading volume proxying information flow. ISV is proposed to be a novel addition. To this day, there are only a few studies on ISV and its effects on stock returns or stock return volatility. All of them are detailed at the end of this chapter.
2.1. Classical Finance
The most important developments contributing to the birth of classical asset pricing models have been Expected Utility Theory, Rational Expectations Theory and the EMH.
6
The theoretical foundation of asset pricing models in the era of classical finance rests on the assumptions of Expected Utility Theory, which puts risk and return as central issues of the investment decision making process. Being rather prescriptive in nature, Expected Utility Theory is a theory of choice under uncertainty for a single decision-maker, based on strict assumptions about preferences. Its roots can be traced back to the explanations of why believing in God is rational; put forth by Blaise Pascal (1670). Among other important contributors are Bernoulli (1738), Feller (1950) and von Neumann and Morgenstern (1947).
Rationality, on the other hand, being regarded as a rather normative concept, suggests or even dictates certain actions. The Rational Expectations Hypothesis can be traced back to Muth (1961), who proposed that asset prices depend partly on what prospective buyers and sellers expect them to be in the future. Basic premises of the rational expectations paradigm assumes that all investors are identical, utility maximizers and their predictions are accurate. Thus, theoreticians from this school of thought posit that outcomes do not show systematic differences from people’s expectations of such.
Expected Utility and Rational expectations are the two main pillars upon which rests the EMH.
2.1.1. The EMH
The idea of the impossibility of predicting asset returns if asset prices incorporate all relevant information goes back to the works of Bachelier (1900), and was formalized by Mandelbrot (1963) and Samuelson (1965), who demonstrated that asset prices in well-functioning markets with investors holding rational expectations should follow a generalized form of a random walk known as a submartingale. Empirical evidence was provided by studies such as Kendall and Hill (1953), Osborne (1959), Alexander (1961), Fama (1963, 1965).
Based on the rational expectations framework, Fama (1970) proposed the concept of information efficiency of stock markets in the context of what kind of information is factored in stock prices. Closely associated with and preceding the
7
EMH, is the Random Walk Hypothesis popularized by Malkiel (1973), whereby stock prices are posited to follow a random pattern and, thus, are serially uncorrelated rendering any analysis of their past prices valueless.
Fama (1970) distinguished between three forms of EMH based on their informational efficiency: (a) the weak form, (b) the semi-strong form, and (c) the strong form. The semi-strong form of EMH has formed the basis for most empirical research. More recent research has expanded to encompass tests of the weak form as well. If no profit can be made through technical analysis then the weak form holds. If analyzing publicly available information, such as annual reports, does not elicit superior returns then that particular market is said to operate in the semi-strong form. The EMH in its strictest form, states that stock markets are very efficient in incorporating all information (information on past values, stock fundamentals and private information) swiftly. Accordingly, even holders of inside information should not be able to make superior returns. Therefore, in the EMH world, it is impossible for investors to beat the market by analyzing past price movements and stock fundamentals since they are already reflected in the prices.
Empirical studies testing that stock prices follow a random walk have used two tests related to: Firstly, that technical analysis is of no use since stock prices are serially uncorrelated and do not exhibit a repeat pattern. Secondly, that analyzing stock fundamentals will give no information about the intrinsic value of a particular security. Pioneer studies providing empirical evidence for historical independence of stock prices and showing that fundamental analysis was of no value were Fama, Fisher, Jensen and Roll (1969), Jensen (1968), LeRoy (1973).
2.1.2. Asset Pricing Models
Theoretical research on the pricing of securities can be traced back to Markowitz (1952, 1959) where the investor’s aim is to maximize expected return at a given level of risk. The Capital Asset Pricing Model (CAPM), being independently developed by Sharpe (1964), Lintner (1965) and Mossin (1966), assume that investors use the Markowitz logic of portfolio formation. As an extention, the CAPM introduces the concept of the risk-free rate and states that expected returns equal the
8
risk free rate plus a linear function of its tendency to covary with the market portfolio. Since investors are assumed to be rational decision makers, the only risk that needs to be considered is the systematic risk associated with the market porfolio, any other residual idiosyncratic risk can be diversified to a minimum level.
According to the static CAPM, the expected return E(𝑅𝑖) of a given financial asset i is presented as:
E(𝑅𝑖,t) = 𝑅𝑓 + 𝛽𝑖 (𝑅𝑚,t −𝑅𝑓) + i,t (1) Where, 𝑅𝑓 is the risk-free rate, E(𝑅𝑚) is the expected return on the market portfolio (i.e., a portfolio of all assets in the economy), i is the residual term and 𝛽𝑖 is the sensitivity to systematic risk, which should be compensated by a higher rate of return, equal to the covariance of asset i with the market portfolio (the “beta” of the stock).
In the mid-1960s, this model provided a good explanation of asset prices. However, these explanations received criticism towards the end of the 1970s, with the applications of tests using time-series regressions of stock returns on index returns to generate estimates of stock-specific betas.
The development of the CAPM, led to the Joint Hypothesis problem; which simply states that findings that forecast errors are possibly predictable does not necessarily mean that markets are inefficient. The asset model itself might have been incorrrectly specified. However, an asset-pricing model cannot be tested easily without making the assumption that prices rationally incorporate all relevant available information and that forecast errors are unpredictable.
Fisher, Jensen and Roll (1969), who also introduced the event studies methodology, tackled the Joint Hypothesis model by using “The Market Model” to capture the variation in expected returns as shown below:
9
Here 𝑅𝑚,𝑡 stands for the current overall market return, and 𝛼𝑖 and 𝛽𝑖 are estimated coefficients from a regression of realized returns on stock i, 𝑅𝑖,𝑡, on the overall market returns using data before the event. Assuming that 𝛽𝑖 captures differences in expected return across assets, 𝜀𝑖,t represents the residual idiosyncratic noise.
With the assumption that stock returns should be unpredictable, idiosyncractic noise should be uncorrelated across events. This procedure adresses the joint hypothesis problem and isolates the price development of stock i from the impact of general shocks to the market.
2.1.3. Criticism and Challenges to CAPM and EMH
A seminal paper by Roll (1977) criticized tests of the CAPM, demonstrating that any valid CAPM test presupposed complete knowledge of the market portfolio. In CAPM theory, the market portfolio contains every individual asset in the economy, including human capital, and is, thus, unobservable. Using a stock market index as a proxy for the market portfolio, as commonly used by previous tests, would therefore lead to biased and misleading results.
Pioneers in shaking the existence to EMH were Shiller (1981) and LeRoy and Porter (1981). Shiller (1981) was the first to attribute his empirical findings of excess volatility to optimistic or pessimistic market psychology. These studies were followed by Schwert (1989), who suggests that volatility of stocks increase during recessions and attributes this movement to operating leverage. The market crash of 1987 was the turning point and eventual demise of EMH.
Contradictory empirical findings against the general applicability of the EMH (commonly referred to as “market anomalies”) have followed. These rest on a series of test investigating whether publicly available information used in fundamental analysis can be used to improve returns. Oft-studied anomalies include the “Small-Firm Effect”, where it is shown that small firms tend to earn abnormally high returns over long time periods (Reinganum, 1983). The “January Effect” or Turn-of-the-Year Effect”, another prominent research topic suggested by Roll (1988), arguing
10
that at the turn of the year stock prices experience an abnormal and predictable rise in prices that is inconsistent with random-walk behavior. French (1980), analyzing daily returns for stocks in 1953-1977, argues that there is a tendency for returns to be negative on Mondays, an anomaly called the “Monday Effect or “Weekend Effect”. Another anomaly called the “P/E Ratio Effect” is suggested by Basu (1977) arguing that low P/E ratio stocks earned a premium during 1957-1971 and Campbell and Shiller (1988) demonstrate the predictive power of P/E ratios. The Over/Under-Reaction Anomaly puts forth that stock prices overreact to certain events such as current changes in earnings (DeBondt and Thaler, 1985). Other numerous anomalies discovered over the years are the Neglected Firm Effect (Arbel, 1985), the Weather Effect (Hirshleifer and Shumway, 2003), and the Book-to-Market Effect (Fama and French, 1992).
Tests developed to determine cracks in the strong form of the EMH, geared towards detecting whether insiders could make superior profits, was adressed by researchers such as Jaffe (1974) and Givoly and Palmon (1985), but are relatively few in number.
Grossman and Stiglitz (1980) went as far as to argue that the existence of perfectly informationally efficient markets is impossible, since if markets are perfectly efficient, there is no profit to gathering information. Therefore there would be little reason to trade and markets would eventually collapse.
The CAPM has by many researchers been accused of being unrealistic. While there has been research proposing extensions to the basic CAPM like the Consumption-Oriented Intertemporal Asset Pricing Model (Breeden, 1979), other theoreticians like Ross (1976) attempted to remedy the defficiencies of the CAPM with a different model namely the Artibtrage Pricing Theory (APT).
The underlying premise of the APT, being an equilibrium model, is that no arbitrage opportunity should be present in efficient financial markets. As opposed to the single beta CAPM, APT assumes there are n number of factors which can cause systematic deviations of returns from their expected values; thus an asset’s expected return is a linear function of its sensitivity to n number of common factors. As in the
11
CAPM, residual risk is assumed to be diversifiable. Both the CAPM and APT are single-period models. Merton (1973), introduced the intertemporal capital asset pricing model (ICAPM) to account for the multi-period nature of financial market equilibrium. The ICAPM is very similar to the APT, with the exception that the first factor is defined explicitly as being related to the market portfolio. A further difference is that ICAPM puts requirements for factors to be included into its equation and thus, has a restrictive nature on the number of factors underlying.
The early excess-volatility findings were also challenged on econometric grounds by Marsh and Merton (1986) and Kleidon (1986), who noted that the test statistics used by Shiller (1979, 1981) are only valid if the time series are stationary. This issue was addressed by Campbell and Shiller (1988) who used the Theory of Cointegrated Processes developed by Granger and Engle (1987), to design new tests of the present-value model that allow the processes generating prices and dividends to be nonstationary.
A relatively newer asset pricing model, integrating all previous findings is the Fama French Three Factor Model (F/F 3) (1993), which is based on the premise that the CAPM beta has practically no additional explanatory power once book-to-market (HML) and size (SMB) have been accounted for. The F/F 3 Model is depicted below:
E(𝑅𝑖,𝑡) = 𝛼𝑖 + 𝛽mkt 𝑅𝑚kt,𝑡 + 𝛽HML 𝑅HML,𝑡 + 𝛽SMB 𝑅SMB,𝑡 + 𝜀𝑖 (3) The authors, arguing that these two factors capture fundamental risk for which investors demand compensation developed a rational multi-factor interpretation of stock returns. In contrast other researchers construed the significance of these two factors as the effect of market mispricing and investor irrationality following Shiller, Fisher and Friedman (1984). Lakonishok, Shleifer and Vishny (1994) attributed excess return to high book-to-market stocks to underpricing by investors and low book-to-market stocks to investors’ overpricing so that they subsequently underperform the market.
12
A parallel development was the challenge to informational efficiency and the F/F 3 by Jegadeesh and Titman (1993), who discovered the “momentum” in stock prices identifying consistently winning (losing) stocks over a 3-12 months horizon.
A common characteristics of most of these models is the underlying assumption that the investor is not only rational but also processes information efficiently.
Other attacks to the F/F 3, came from Black (1993) who suggested their findings were attributable to data mining, thus, their results would disappear if one were to use another data set over a different time period. Similarly, Kothari, Shanken and Sloan (1995) suggested that the Compustat data used in F/F 3 testing might suffer from survivorship bias and that beta calculations are very sensitive to the frequency of data.
Extensions to F/F 3 such as the Carhart Four Factor Model (Carhart, 1997) includes a fourth factor namely momentum besides the factors including beta, size and book-to-market ratio.
2.2. Behavioral Finance and Prospect Theory
Behavioral finance is the outcome of a broad compilation of works in finance and psychology.
Its roots can be witnessed in the works of Keynes and his concept of “animal spirits (1937), Simon (1955) and March and Simon (1958) putting forth the bounded-rationality principle; where decision making is limited, followed by the Theory of Cognitive Dissonance (Festinger, Riecken and Schachter, 1956), Samuelson’s fallacy of large numbers (1963) and advanced through the introduction of such concepts as “the availability heuristic”, “representativeness, availability and anchoring and adjustment”, “loss aversion”, “framing”, “under/over-reaction”, “herd behavior”, “overconfidence” by Kahneman and Tversky (1973, 1974, 1979, 1981), Daniel, Hirshleifer and Subrahmanyam (1998), Shiller (2000) and Shefrin (2000),
13
respectively. However, it was Thaler’s work in 1980 that promoted prospect theory to be used as basis for an alternative descriptive theory in economics.
The main argument of behavioral finance is that deviations of asset prices from their fundamental values not considered by the EMH, can be interpreted as being caused by the presence of investors in financial markets that are not fully rational. Shleifer and Summers (1990) posit that behavioral finance rests upon two pillars: limits to arbitrage, seeking to explain the existence of arbitrage opportunities and investor psychology not necessarily based on fully rational models.
Examples of studies using behavioral explanations for financial phenomena include: Lakonishok, Shleifer and Vishny (1994) who claim that value strategies yield higher returns because these strategies exploit the suboptimal behaviour of the typical investor. Benartzi and Thaler (1995) address the equity premium puzzle of Mehra and Prescott (1985), which refers to the fact that stocks have outperformed bonds by a far greater degree than warranted under the standard expected utility maximizing paradigm. The authors attribute this anomaly to a concept they call “myopic loss aversion”; loss aversion combined with a prudent tendency to frequently monitor one’s wealth. On the other hand, analyzing mutual funds behavior, Grinblatt, Titman and Wermers (1997), demonstrated evidence of momentum strategies and herding. A widely recognized heuristic is that of representativeness based on DeBondt and Thaler’s (1985) study. They argue that investors become extremely pessimistic (optimistic) about past losers (winners) and, consequently, overreact to both bad and good news leading past loser (winners) to become under (over)priced. Shefrin (2000) following Odean (1998), presents overconfidence as a reason for investors’ excessive trading.
One of the major opponents to behavioral finance, is the founder of EMH, Eugene Fama (1998). While admitting that there may be some anomalies that EMH cannot adress, he argues that it should not be fully dismissed and replaced by behavioral finance. Shiller (2003) defends behaviorism against these criticisms especially stressing excess volatility in stock returns and the fact that this phenomena is of yet not been refuted. Thaler (1999) argues that behavioral finance cannot be
14
dismissed due to the theoretical possibility of cognitive biases as exerting influence on asset prices.
The following sections give a more detailed look at potential pillars of investor behavior, mentioned in various finance studies: Bounded-Rationality (Satisficing), Heuristics (Sentiment), and Noise Trading.
2.2.1. Pillars of Investor Behavior
Grether (1992) defines heuristics as as a rule of thumb or decision aid by which individuals may judge likelihood. Shefrin (1999) argues that it is heuristics and frame dependence that lead to market inefficiencies causing prices to deviate from their fundamentals.
Behavioral heuristics assist behavioral finance researchers in explaining issues like why investors fail to diversify, why they sell winners and keep losers, why they trade actively and over/underreact to news. As opposed to the rational expectations paradigm investors are not assumed to be idential and tend not to follow Bayesian rules to form new beliefs as information becomes available. Thus, not all investor predictions are accurate. In practice, investors may be rationally-bounded and display “satisficing” behavior (Simon, 1956) due to information limitations. Satisficing is a cognitive heuristic which states that since human beings lack cognitive resources to evaluate all outcomes with sufficient precision and do not know relevant probabilities due to unlimited memory, they cannot optimize. Shefrin (1999) defines a frame as a description. Frame dependence implies that people make decisions that are influenced by the manner in which the information is presented.
Kahneman and Tversky (1972) and Tversky and Kahneman (1971, 1974) introduced the “representativeness” heuristic explaining that people make probabilistic judgments based on similarity. Representativeness causes people to give too much weight to recent evidence and too little weight to the base rate or prior odds. It may also lead to extreme forecasts relative to the predictive value of the information available. DeBondt and Thaler (1985) applied overconfidence to their behavioral explanation regarding market pricing. They argued that investors react to
15
both, good and bad news. Thus, overreaction causes past loser stocks to become underpriced and past winners to become overpriced.
Shefrin and Statman (1985) apply Kahneman and Tversky’s notion of “framing” to the realization of losses and called that phenomenon the “Disposition Effect”. Presumably investors are predisposed to holding losers too long and selling winners too early.
Shefrin (1999) suggests that these two studies opened two different avenues for investigating the implications of behavioral phenomena, with one stream looking into security prices and the other into the behavior of individuals.
Kahneman and Tversky in their seminal and remarkable paper on Prospect Theory (1979), question the validity of expected utility theory. Their argument is that when faced with the complex task of assigning probabilities to uncertain outcomes, individuals often revert to the use of behavioral heuristics which in turn lead to systematic biases. Prospect Theory was developed as a more accurate alternative psychological model for decision making under risk, compared to Expected Utility Theory, the latter resting upon the “reality axioms” of von Neuman and Morgenstern (1947).
Prospect Theory replaces the probabilities put forth by Expected Utility Theory by decision weights which assign value to gains and losses (changes in wealth or welfare) rather than absolute magnitudes. In this sense it is rather descriptive as it observes the behavior of individuals rather than normatively dictating what investors should do given certain assumptions about them. Accordingly value should be dependent upon two arguments: the asset position that serves as a reference point, and the magnitude of change from this respective reference point.
“Many sensory and perceptual dimensions share the property that the psychological response is a concave function of the magnitude of physical change.” (Kahneman and Tversky, 1979: 278)
16
The above quote describes an essential feature of Prospect Theory that the Value Function proposes. Individuals cannot discriminate a temperature change from 13 degrees to 16 degrees as easily as they can when the temperature changes from 3 degrees to 6 degrees. This recognition is applied to economics and argued that the value function for wealth is concave above the reference point and gets convex below it. Thus, marginal value attained from gains and losses tend to generally decrease in their magnitude. The idea of loss aversion is an outcome of the value function being steeper for losses than for gains.
Following Prospect Theory numerous other behavioral heuristics were applied to finance and popularized through several models. One of them is what Barber and Odean (2008) refer to as the “Investor Sentiment Model” in which investors over/underreact to information due to the “overconfidence”. Yet another one is the “Noise Trader Model” by Delong et al. (1990) which involves investors reacting to irrelevant information, that is they may interpret signals as information whereas they are merely noise.
While there is no common agreement on what constitutes investor sentiment; be it emotions, heuristics or the propensitity to trade on noise, there seems to be an inclination to attribute these characteristics to the individual investor who does not based his decisions on preferences but rather beliefs.
2.2.2. Heuristics
This section provides an overview of a few relevant heuristics to this thesis, the large universe of heuristics is not discussed, for brevity purposes.
(i) Overconfidence: Barberis, Shleifer and Vishny (1998) were the first researchers to model this heuristc under the so-called “Investor Sentiment Model”, to explain how investors form their beliefs that are translated as investor under and over-reaction in stock markets. Accordingly, overreaction means that the average return following a series of announcements of good news is lower than the average return following a series of bad news announcements. After a series of good news, investors are observed to become overly optimistic that the future news
17
announcements will be also good and, hence, overreact causing an overvaluation of the firm’s stock price. However, they will be experience anxiety once subsequent news announcements do not confirm their prior optimism, which leads to a price decrease below its fundamental value and, then, to poor returns. This reversion means that the overweighting of bad (good) information leading to a decrease (increase) in prices below (above) their fundamental value is corrected in the subsequent period.
Among other researchers, who have attributed excess trade to overconfidence are Odean (1998), Daniel, Hirshleifer, and Subrahmanyam (1998) and Gervais and Odean (2001),
(ii) Confirmation Bias: Confirmation bias is defined by Nickerson (1998) as "the seeking or interpreting of evidence in ways that are partial to existing beliefs". This heuristc implies that an investor would be more inclined to search for information that supports his or her original idea about an investment rather than seek out information that contradicts it. Consequently, this bias can often result in faulty decision making. Pouget and Villeneuve (2012) study confirmation bias and propose a dynamic model where some investors are prone to it. In a model with public information only, this assumption is said to provide a rationale for the volume-based price momentum documented by Lee and Swaminathan (2000). A study by Park et. al. (2010) conjecture that investors would use message boards to seek information that confirms their prior beliefs making them overconfident and adversely affect their investment performance. Their analysis of 502 investor responses from the largest message board operator in South Korea supports their hypothesis that investors exhibit confirmation bias when they process information from message boards.
(iii) Framing: Shefrin (2000) suggest the term frame dependence means that the way people behave depends on the way that their decision problems are framed. In classical finance, framing is argued to be transparent such that investors can see through all the different ways cash flows might be described. As a bias, it is based on cognitive and emotional factors which influence the mental organization process of information and how the outcomes are coded into gains and losses.
18
(iv) Herd Instinct (Herding): There is a natural instinct for people to become part of a group so they tend to herd together. Moving with the herd magnified psychological bias inducing the person to decide based on his feelings instead of performing independent analysis. In behavioral finance, herding presents another strand of literature looking to explain price deviations from their fundamentals. For instance, Barber, Odean, Zhu (2009) findings on U.S. stock markets over the period 1983 to 2001 suggest that individual investors predominantly buy (sell) the same stocks as each other contemporaneously. Redding (1996) gives a detailed overview of noise trading and the herding literature.
(v) Sentiment: Is the reflection of heuristic-driven bias. Brown (1999), describing the relation between noise and investor sentiment, argues that if noise traders affect prices, the noisy signal is sentiment, and the risk they cause is volatility then sentiment should be correlated with volatility. Studies such as Kumar and Lee (2006) provide powerful and consistent empirical evidence that stock prices are affected by sentiment risk in contrast to studies such as Sias, Starks and Tinic (2001) who argue that financial markets do not price cognitive factors. Beer, Watfa and Zouaoui (2011) investigate whether noise trader risk (also called “sentiment risk”) is valued by the stock market. The authors find that the impact of sentiment risk on stock returns is more associated with certain types of stock like small stocks, growth stocks, young stocks, unprofitable stocks, lower dividend-paying stocks, intangible stocks and high volatility stocks.
2.3. Noise Trading Models
Sentiment is what leads investors not be necessarily irrational, but to form systematic biases in the way they believe and causes them to trade on non-fundamental information. The relation between sentiment and asset pricing has become popular starting with Black (1986) followed by various other studies like Delong et al. (1987), Barberis, Shleifer and Vishny (1998), Daniel, Hirshleifer and Subrahmanyam (2001). All of these studies assume the categorization of investors in generally two groups: the informed traders acting rationally on information and uninformed noise traders relying on their “irrational” sentiment. However, a commonly agreed upon clear-cut categorization and the source of noise trader risk
19
remains unanswered. For instance, Baker and Wurgler (2006) put forth that mispricing based on sentiment is caused by a combination of uninformed demand of some investors, the noise traders, and a limit to arbitrage.
The notable Noise Trader Model by Delong et al. (1990) is based on the assumption that there are noise traders and sophisticated investors. The model is describing the impact of noise trading on equilibrium prices. The price deviations from fundamental values are a result of unpredictable investor sentiment. Arbitrageurs who trade against mispricings are faced with the risk of investor sentiment becoming more extreme and thus moving prices even further from their fundamental values. Eventually, arbitrageurs fail to entirely eliminate these sentiment-related mispricings, leaving noise trader risk factored into the price formation process. Instead of expanding upon what the source of the false belief or sentiment about irrelevant information they base their trading decisions on the implications of the existence of noise traders. They point out that studying irrational behavior does not always require specific content and that by mere observation of the effect of the unpredictability of irrational behavior on the opportunities of rational investors, something can be learned.
Models of investor sentiment base their assumptions on various heuristics. Barberis, Shleifer and Vishny (1998) base their model on representativeness and conservatism as opposed to Daniel, Hirshleifer, and Subrahmanyam (1998) whose model attempts to reconcile the empirical findings of overreaction and underreaction basing them on heuristics such as overconfidence and self-attribution.
Over the course of three decades, the effect of investor sentiment on asset returns has been subject to detailed empirical testing. Many studies (such as Lee, Shleifer, and Thaler, 1991; Lee et al., 2002; Brown and Cliff, 2005; Baker and Wurgler, 2007; Ho and Hung, 2009; Baker, Wurgler, and Yuan, 2012) demonstrate that there is a contemporaneous relationship of such. Apart from individual assets, the effect of investor sentiment on stock market volatility has been explored and evidenced in studies such as Brown (1999).
20
Lee, Jiang and Indro (2002) describe that underlying noise trader models in finance is the premise that subsets of agents trade in response to extraneous variables that convey no information about fundamentals.
Malkiel (2003) cites other noise models in addition to Delong et al. (1990), like the studies by Campbell and Kyle (1993), Campbell, Grossman, and Wang (1993), or Llorente et al. (2002) that predict that noise trading adds to idiosyncratic volatility above and beyond cash flow news and concludes that retail trading may positively affect volatility if individual investors behave as “noise traders” or “liquidity traders.
While there seems to be a common agreement in literature that investor behavior does have an effect on financial markets, the extent to which is still questionnable. Furthermore, distinguishing among types of investors (institutional or individual) and their relative contributions to EMH-contrarian outcomes is very difficult. Thus, behavioral finance may be viewed as offering complementary arguments in explaining asset price behavior next to traditional models.
2.4. Volatility
The fluctuation or “variance” of stock price returns over a certain time period, is called stock return volatility or simply “volatility”. It is of particular interest to investors, dealers, brokers, regulatory agents, risk managers and company owners. Volatility is often times equated with risk and consequently the more stable stock price returns are, the less riskier they are perceived to be.
The empirical papers of Shiller (1979) and LeRoy and Porter (1981) demonstrating that stock prices and long-term interest rates fluctuate more than predicted by traditional asset models, were followed by Shiller (1981), and Amsler (1984) reporting similar findings of excess volatility.
In general, the return of an asset can be decomposed into its systematic component its idiosyncratic component. Its corresponding volatility can also be divided into two parts:
21
Volatility = systematic volatility + idiosyncratic volatility (4)
Xu and Malkiel (2003) assert that stock market volatility as a whole has received considerable press attention during the late 1990s. They further argue that this attention has been misplaced referring to the findings of Schwert (1989), who demonstrated that no long-term upward trends was found in the volatility of the stock market as a whole. The authors draw attention to the fact that volatilities of individual stocks can increase even though the volatility of the market remains stable provided that correlations among stocks are declining. This argument was researched by Campbell et al. (2001), who showed that volatilities of individual stocks had indeed increased during that the period between the 1980s and 1990s, as a result of an increase in their respective idiosyncratic volatilities.
As Xu and Malkiel (2003) put forth, it is very difficult to measure idiosyncratic volatility since it is inherently unobservable and model-dependent.
While the CAPM views idiosyncratic volatility as irrelevant, the challenges posed to traditional asset pricing theories has led researchers to reconsider the role of idiosyncratic risk. Ruan, Sun, Xu (2010) argue that viewed from a theoretical perspective, idiosyncratic risk might be important allowing for some degree of market imperfections. Merton (1987) suggests that idiosyncratic risk could be priced in case investors cannot hold all available stocks.
Goyal and Santa-Clara (2003), building on previous literature, look at average stock risk in addition to market risk and find a significant positive relation between average stock variance and the return on the market. The authors claim that since average stock risk is mostly driven by idiosyncratic risk.
Ruan, Sun and Xu (2010) citing Merton (1987) and Malkiel and Xu (2002), argue that it is not the total of idiosyncratic volatility that needs to be priced but only a portion of such that cannot be diversified away. The authors posit that in practice, about one third of the idiosyncratic risk can be diversified away even if one were to hold a portfolio of two stocks on average. Hence, a proxy to estimate this
22
unobservable portion of volatility should be used. Ruan, Sun and Xu (2010) refer to the priced idiosyncratic component as “signal” and the unpriced part of idiosyncratic volatility as “noise”. However the term “noise” as originally coined by Black (1986), is commonly used to denote aggregate idiosyncratic volatility. Thus, throughout this study idiosyncratic volatility is meant to refer to noise in the aggregate sense of its meaning.
2.4.1. Studies on Volatility Measurement with Exogenous Variables
Initial volatility studies in finance and econometrics have come a long way since the 1950s, when Harry Markowitz used standart deviation as a general measure to demonstrate risk reduction through the benefit of diversification. Bollerslev and Wooldridge (1992), referring to risk as “uncertainty”, explains that although the uncertainty of speculative prices was recognized in literature since Mandelbrot (1963) and Fama (1965), it was with the introduction of the Autoregressive Conditional Heteroskedasticity Model (ARCH) of Engle (1982), when researchers started realizing that volatility in high frequency time series data, such as asset returns, is time-varying.2
The ground-breaking ARCH Model has changed the landscape of volatility studies and has received numerous extensions. One of the most important ARCH-type models includes the linear Generalized Conditional Heteroskedasticity (GARCH) Model introduced by Bollerslev (1986).
Explained in statistical terms, until ARCH-family type models became popular, standart regression models, as the univariate equation presented below, assumed the error term “”, representing idiosyncratic volatility, to exhibit a constant variance.
yx (5)
2 Besides historical volatility (extracted from return series), there’s also the concept of implied volatility (extracted from option prices) and realized volatility (the sum of squared returns). For a comparative discussion see Koopman, Jungbacker, & Hol (2005).
23
Where, the expected value y is dependent upon a constant plus a proportion
of the variable x. This proportional dependency is subject to an error term because it cannot be estimated exactly. It is this error term that has been subject to prominent debates to its calculations. In other words, the variance is considered equal to the expected error squared as denoted by ). This assumption, that the expected error does not depend on the size of variable x and is constant, is called homeoskedasticity.
However, once non-constant variance (heteroskedasticity) is established, random walk models dependent upon the aforementioned rational expectations hypothesis, can no longer capture the temporal variation in conditional means (and are also no longer valid to behavioral finance researchers theoretically). Thus the newer ARCH-type models became very popular due to their success in modelling the varying variances that are conditional upon their past values.
Engle (1982) was the first researcher to propose a model to capture time varying conditional variance in the error terms instead of ignoring it. ARCH (Autoregressive Conditional Heteroskedasticity) processes remain popular till present day.
In order to accurately describe conditional variance, the need for higher order lags of autoregressive compents paved the way to the construction of the more parsimonious GARCH models by Bollerslev (1986). Therein, the conditional variance is thought be a linear process, consisting of a function of past squared residuals and previous conditional variances. GARCH models are thought of as being symmetric models in that they do not differentiate responses to positive and negative news.
There are many proponents of using GARCH models when modelling financial time series data. Among such, for instance Aybar and Yavan (1998), conclude that asymmetry is not a universal phenomenon and suggest symmetric GARCH(1,1) to be a better fit.