Double Branch Outage Modeling and Its Solution
Using Differential Evolution Method
Oguzhan Ceylan
Informatics Institute Istanbul Technical University [email protected]
Aydogan Ozdemir
Electrics-Electronics Faculty Istanbul Technical University
Hasan Dag
Information Technologies Department Kadir Has University
Abstract—Power system operators need to check the system
security by contingency analysis, which requires power flow solutions repeatedly. AC power flow is computationally slow even for a moderately sized system. Thus, fast and accurate outage models and approximated solutions have been developed. This paper adopts a single branch outage model to a double branch outage one. The final constrained optimization problem resulted from modeling is then solved by using differential evolution method. Simulation results for IEEE 30 and 118 bus test systems are presented and compared to those of full AC load flow in terms of solution accuracy.
Index Terms—branch outage modeling, differential evolution,
double branch outage, optimization, post outage state.
I. INTRODUCTION
In the last two to three decades, electrical power systems have gone through restructuring process, which changed the nature of the system. One of the major challenges of the near future is the evolution of power system to the “smart networks”. With this new evolution idea, power system has been subjected to the several issues such as measuring, pro-tection, communication issues as well as distributed generation facilities. New mobile consumers such as plug-in hybrid cars and new generation and storage elements such as solar cells and batteries have been introduced.
Outage of any components in a smart grid environment may cause significant problems in the system. Power system operators need to simulate the possible contingencies and take remedial actions in time. By simulating an outage, a power system operator can predict the post outage voltage magnitudes and post outage power flows. Full AC load flow, which is a time consuming process, can be used to determine the exact post-outage state. Because of high simulation cases required for a contingency analysis, fast and accurate models have been developed. DC power flow [1] is one of these methods, but it can’t handle reactive power and bus voltage magnitude calculations. Other methods [2]–[4] use linearized models but they do not provide enough accuracy.
A faster and more accurate model was developed in [5]. This model, formulates the branch outage problem as a local constrained optimization problem. Bus voltage magnitude val-ues determined from the linearized reactive power equations are revised in a local optimization cycle. Since, the model uses only restricted group of network variables, it is fast and the results show that it provides better accuracy than
the traditional methods [5]. Single branch outage simulation problem has been solved by Lagrange multiplier method [5], genetic algorithms [6], particle swarm optimization method [7], differential evolution method and harmony search method [8].
The number of single branch outages is the number of branches in the system at hand. However, the number of double branch outages is proportional to the square of the number of the branches [9]. Multiple branch outages have been simulated in [10], [11].
This paper presents the adoption of single branch outage modeling to double branch outage modeling and uses the differential evolution method to solive the final local con-strained optimization problem. Differential evolution method was firstly introduced by Storn and Price [12], [13]. It is a stochastic direct search optimization method. Differential evolution is a population based algorithm and it has similar operators as those of the other evolutionary algorithms, such as crossover, mutation and selection. Differential evolution has been applied to several power system problems, such as, economic dispatch [14], power system planning [15], transient stability constrained optimal power flow [16], generation ex-pansion planning [17], and unit commitment [18], etc.
The rest of the paper is organized as follows. In the second part, the proposed model for double branch outages is given. Differential evolution algorithm is given in the third part. The fourth part of the study gives simulation results for IEEE 30 and 118 bus test systems. The conclusion is provided in the last section.
II. DOUBLEBRANCHOUTAGEMODELING
Single branch outage model in [5] is selected as the starting point of double branch outage modeling. Assume that the branches between buses 𝑖 and 𝑗, and the branches between buses 𝑘 and 𝑙 are simultaneously outaged. The first branch outage is simulated by using fictitious source pairs 𝑄𝑠𝑖 and
𝑄𝑠𝑗, and the second branch outage is simulated by using
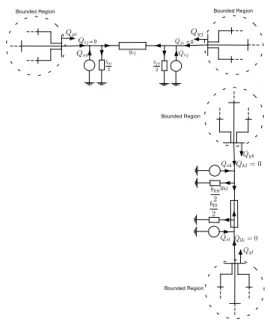
fictitious source pairs 𝑄𝑠𝑘 and 𝑄𝑠𝑙. The model for this simulation is shown in Fig. 1.
Constrained optimization problem representing a single branch outage was previously formulated for a bounded region in [5]. This study extends that formulation and defines a
bounded region for a double branch outage as the union of individual bounded regions of the outaged branches.
Qji= 0 Qsj Qij = 0 yij Bounded Region Qsi bi0 2 Qyj Qyi Qyl QslQlk= 0 bl0 2 ykl bk0 2 Qsk Qyk Qkl= 0 Bounded Region Bounded Region Bounded Region bj0 2
Fig. 1. Double branch outage modeling using fictitious sources
The steps of double branch outage modeling can be given as follows,
∙ Select two branches to be outaged and number them as:
𝑖𝑗, and 𝑘𝑙.
∙ Compute the bus voltage angles by using the linearized active power equations as shown below.
𝛿𝑚= 𝛿𝑚+ (𝑋𝑚𝑖− 𝑋𝑚𝑗) △ 𝑃𝑛+ (𝑋𝑚𝑘− 𝑋𝑚𝑙) △ 𝑃𝑟 𝑙 = 2, 3, ⋅ ⋅ ⋅ , NB
△𝑃𝑛= [1 − (Xii+ Xjj𝑃𝑖𝑗− 2Xij)/xn] (1) △𝑃𝑟= [1 − (Xkk+ Xll𝑃𝑘𝑙− 2Xkl)/xr]
where,𝑋𝑖𝑗 represents the𝑖th row, 𝑗th column element of the bus susceptance matrix, 𝑋𝑘𝑙 represents the𝑘th row,
𝑙th column element of the bus susceptance matrix, 𝑃𝑖𝑗
and𝑃𝑘𝑙are the pre-outage active power flows through the outaged branches, and𝑥𝑛 and𝑥𝑟represent the reactance of the branches at hand.
∙ Calculate the loss reactive powers, represented as ˜𝑄𝐿𝑖∼= ˜
𝑄𝐿𝑗, ˜𝑄𝐿𝑘∼= ˜𝑄𝐿𝑙, for the optimization cycle.
∙ Minimize reactive power mismatches at buses 𝑖, 𝑗, 𝑘 and 𝑙. This process is mathematically equivalent to the following constrained optimization problem.
min 𝑤𝑟𝑡 𝑄𝑠𝑖,𝑄𝑠𝑘∥ 𝑄𝑖− (𝑄𝑖𝑗+ 𝑄𝐿𝑖) + 𝑄𝐷𝑖 𝑄𝑗− (−𝑄𝑖𝑗+ 𝑄𝐿𝑖) + 𝑄𝐷𝑗 𝑄𝑘− (𝑄𝑘𝑙+ 𝑄𝐿𝑘) + 𝑄𝐷𝑘 𝑄𝑙− (−𝑄𝑘𝑙+ 𝑄𝐿𝑖) + 𝑄𝐷𝑙∥ (2) subject to 𝑔𝑞(𝑉𝑏) = △𝑄𝑏− 𝐵𝑏△ 𝑉𝑏= 0
where, ∥ ⋅ ∥ is the Euclidean norm of a vector. The constraint part of (II) is linearized reactive power equation for load buses, △𝑄𝑏 is the reactive power mismatch vector in the bounded region,𝑉𝑏 is the load bus voltage magnitude vector in the bounded region and 𝐵𝑏 is the bus susceptance matrix for the bounded region.
III. DIFFERENTIALEVOLUTIONMETHOD
A. Differential Evolution Algorithm for Double Branch Out-age Solution
Differential evolution (DE) algorithm for double branch outage problem is given as follows.
1) Run a power flow to obtain pre-outage bus voltage magnitudes.
2) Create matrix A, dimensions of which is𝑁𝑝 × 2, where
𝑁𝑝 represents the number of elements in a population.
The elements of the first column of the initial matrix A are in between𝑄𝑖𝑗± 𝜔 and the elements of the second column of the initial matrix A are in between 𝑄𝑘𝑙± 𝜔. Here𝜔 is a user defined number, which limits the search space.
3) Let buses in the bounded region obtained for the first branch outage be named as; Bound1 and for the second branch outage be named as; Bound2. The union of these two sets Union can be found as follows:
Union= Bound1 ∪ Bound2 (3)
4) For every element of the first column of A matrix, perform the computations given below. Note that there are only two nonzero elements included in△𝑸1.
△𝑸1 = [0, 0, ⋅ ⋅ ⋅ , 𝐴(1,𝑖), ⋅ ⋅ ⋅ , 𝐴(1,𝑗), ⋅ ⋅ ⋅ , 0]𝑇
△𝑸1 = [0, 0, ⋅ ⋅ ⋅ , 𝐴(1,𝑖), ⋅ ⋅ ⋅ , 𝐴(1,𝑖), ⋅ ⋅ ⋅ , 0]𝑇
𝐴(1,𝑖) = −𝐴(1,𝑖)+ 2𝑄𝐿1𝑖 (4)
△Vunion = B−1union△Q1
Vunionone = Vunion+ △Vunion (5)
Similarly, using the second column elements of matrix
𝐴, perform the following computations:
△𝑸2 = [0, 0, ⋅ ⋅ ⋅ , 𝐴(2,𝑘), ⋅ ⋅ ⋅ , 𝐴(2,𝑙), ⋅ ⋅ ⋅ , 0]𝑇
△𝑸2 = [0, 0, ⋅ ⋅ ⋅ , 𝐴(2,𝑘), ⋅ ⋅ ⋅ , 𝐴(2,𝑘), ⋅ ⋅ ⋅ , 0]𝑇
𝐴(2,𝑘) = −𝐴(2,𝑘)+ 2𝑄𝐿2𝑘 (6)
△Vunion = B−1union△Q2
Vuniontwo = Vunionone+ △Vunion (7)
5) Compute the objective functions (mismatch vector) for the revised load bus voltage magnitudes.
6) Perform the following steps until a stopping criterion is reached.
∙ Add the weighted sum of elements of the second columnt of A to the third one. Do this for all elements in a population and form a new mutant matrix.
𝐴′𝑖,:(𝐺)= 𝐴(𝐺)(𝑟3,:)+ 𝐹 (𝐴(𝐺)(𝑟1,:)− 𝐴𝐺
(𝑟2,:)) (8)
where, 𝑖 ∕= 𝑟1 ∕= 𝑟2 ∕= 𝑟3, and 𝑟1, 𝑟2 ve 𝑟3 are random numbers between 1 and𝑁𝑝.
∙ Create trial matrix. Randomly select a number from 1 to 𝑁𝑝 for all the elements in the population. If this number is equal to the population index or smaller than another random number 𝑞 than the mutant element is in the trial (T) matrix otherwise the element from𝐴 matrix is in the trial matrix.
∙ For every element of the first column ofT matrix, perform the computations given below.
△𝑸1 = [0, 0, ⋅ ⋅ ⋅ , 𝑇(1,𝑖), ⋅ ⋅ ⋅ , 𝑇(1,𝑗), ⋅ ⋅ ⋅ , 0]𝑇
△𝑸1 = [0, 0, ⋅ ⋅ ⋅ , 𝑇(1,𝑖), ⋅ ⋅ ⋅ , 𝑇(1,𝑖), ⋅ ⋅ ⋅ , 0]𝑇
𝑇(1,𝑖) = −𝑇(1,𝑖)+ 2𝑄𝐿1𝑖 (9)
△Vunion = B−1union△Q1 (10)
Vunionone = Vunion+ △Vunion (11)
Similarly, using the second column elements of 𝑇 matrix perform the following computations,
△𝑸2 = [0, 0, ⋅ ⋅ ⋅ , 𝑇(2,𝑘), ⋅ ⋅ ⋅ , 𝑇(2,𝑙), ⋅ ⋅ ⋅ , 0]𝑇
△𝑸2 = [0, 0, ⋅ ⋅ ⋅ , 𝑇(2,𝑘), ⋅ ⋅ ⋅ , 𝑇(2,𝑘), ⋅ ⋅ ⋅ , 0]𝑇
𝑇(2,𝑘) = −𝑇(2,𝑘)+ 2𝑄𝐿2𝑘 (12)
△Vunion = B−1union△Q2 (13)
Vuniontwo = Vunionone+ △Vunion (14)
∙ In the selection step the algorithm decides whether the trial elements will be included in the new gener-ation or not. This is done by computing the objective function values by using the new voltage magnitude values.
∙ Compare the function values obtained by trial matrix and𝐴 matrix one by one and decide which elements are to be included in the next generation.
7) Algorithm stops if a predefined stopping criterion is met, otherwise go to the step 2.
IV. TESTS ANDRESULTS
DE algorithm developed for post outage voltage magnitude calculations is tested on the IEEE 30 and 118 bus test systems. Open source electrical power system package Matpower [20] and Matlab are used as tools. All simulations are run on a laptop, that has a 2.20 GHz Core Duo CPU, and 2.0 GB Memory.
Tests are conducted for the double branch outages, which do not create convergence problems, do not cause islanding problem and do result in load bus voltages less than 0.8
p.u. Total of 1214 double branch outage simulations were performed for IEEE 30 bus test system and 15312 double branch outage simulations were performed for IEEE 118 bus test system.
There are two different outage configurations from the point of the system topology.
1) The buses in the bounded regions are disjoint, that is there are no common buses included in the separate bounded regions defined in Fig. 1.
2) The buses in the bounded region are not disjoint, that is at least one branch is included in two different bounded regions of Fig.1.
On the other hand, there are 3 different outage cases for each of the two topologies, namely:
(a) Outaged branches are either power transmission lines or underground cables. None of the outaged branches include a tap changing transformer between the outaged bus pairs. (b) One of the outaged branch is a transmission line/underground cable and the other one includes a transformer between the outaged bus pairs.
(c) Both of the outaged branches include a transformer be-tween the outaged bus pairs.
The results for different outage configurations are illustrated in the following tables for the test systems. Simultaneous outages of lines3−4 and 21−22 is a typical example for Case 1a in IEEE 30 bus test system. Simulation results for this line-line contingency are illustrated in Table (I). Note that, voltage magnitudes of the critical buses showing a percentage error higher than a threshold value0.04% are reported in the table. In the following tables, Bus No. represents the bus number,
𝑉(𝐴𝐶) represents the bus voltage magnitudes computed by
using full AC load flow, 𝑉(𝐷𝐸) represents the bus voltage magnitudes computed by the proposed DE based solution of local constrained optimization problem, and Error % repre-sents the percentage difference between 𝑉(𝐴𝐶) and 𝑉(𝐷𝐸). Note that maximum percentage error for this representative line-line outage is less than0.06%.
TABLE I
BUS VOLTAGE MAGNITUDES FOR SIMULTANEOUS OUTAGES OF LINE3-4
AND LINE21-22INIEEE-30BUS TEST SYSTEM
Bus No 𝑉(𝐴𝐶) 𝑉(𝐷𝐸) (Error)% 6 1.0343 1.0349 0.0594 7 1.0331 1.0336 0.0482 12 1.0525 1.0530 0.0425 14 1.0390 1.0394 0.0471 21 1.0334 1.0328 0.0571 22 1.0394 1.0400 0.0592 24 1.0281 1.0286 0.0459 28 1.0336 1.0340 0.0462 max. error - - 0.0594
Simultaneous outages of branch6 − 9 and branch 14 − 15 is a representative example for Case 1b type outage in IEEE 30 bus test system. Table (II) gives the simulation results for this case. Voltage magnitudes of the critical buses showing a percentage error higher than a threshold value 0.3% are
reported in the table. Note that the maximum percentage error for this representative transformer-line outage is less than 0.4%. There is not any case corresponding to 1(c) type outage in IEEE 30 bus test system.
TABLE II
BUS VOLTAGE MAGNITUDES FOR SIMULTANEOUS OUTAGES OF TRANSFORMER6-9AND LINE14-15INIEEE-30BUS TEST SYSTEM
Bus No 𝑉(𝐴𝐶) 𝑉(𝐷𝐸) (Error)% 10 1.0410 1.0449 0.3737 17 1.0358 1.0391 0.3141 20 1.0255 1.0287 0.3118 21 1.0294 1.0331 0.3609 22 1.0303 1.0339 0.3518 maks. hata - - 0.3737
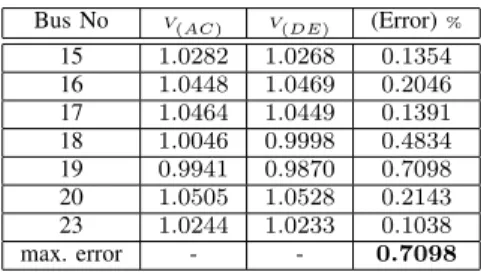
Simultaneous outages of branch19−20 and branch 16−17 is a representative example for Case 2a type outage in IEEE 30 bus test system. Bus-10 has a direct connection to Bus-20 and to Bus-17. Therefore, Bus-10 is included both in the neighbor-hood of the first outaged branch and in the neighborneighbor-hood of the second outaged branch. Voltage magnitudes of the critical buses showing a percentage error higher than a threshold value (0.1%) are reported in Table ( (III). Note that the maximum percentage error for this representative line-line outage is less than0.71%. In addition, the variance of the percentage errors are high when compared with those of the previous outages.
TABLE III
BUS VOLTAGE MAGNITUDES FOR SIMULTANEOUS OUTAGES OF LINE19-20
AND LINE16-17INIEEE-30BUS TEST SYSTEM
Bus No 𝑉(𝐴𝐶) 𝑉(𝐷𝐸) (Error)% 15 1.0282 1.0268 0.1354 16 1.0448 1.0469 0.2046 17 1.0464 1.0449 0.1391 18 1.0046 0.9998 0.4834 19 0.9941 0.9870 0.7098 20 1.0505 1.0528 0.2143 23 1.0244 1.0233 0.1038 max. error - - 0.7098
Simultaneous outages of transformer4−12 and line 10−22 is a representative example for Case 2b type outage in IEEE 30 bus test system. Bus-6 has a direct connection to Bus-4 and to Bus-10. Therefore, Bus-6 is included both in the neighborhood of the first outaged branch and in the neighborhood of the second outaged branch. Voltage magnitudes of the critical buses showing a percentage error higher than a threshold value (0.5%) are reported in Table ((IV). Note that the maximum percentage error for this representative transformer-line outage is less than 1.0%. In addition, the percentage errors are generally high when compared with those of the previous outages.
Simultaneous outages of transformer 28-27 and transformer 6-10 is a representative example for Case 2c type outage in IEEE 30 bus test system. Bus-8 has a direct connection to Bus-28 and to Bus-6. Therefore, Bus-8 is included both in the neighborhood of the first outaged branch and in the neighborhood of second outaged branch. Moreover, one
ter-TABLE IV
BUS VOLTAGE MAGNITUDES FOR SIMULTANEOUS OUTAGES OF TRANSFORMER4-12AND LINE10-22INIEEE-30BUS TEST SYSTEM
Bus No 𝑉(𝐴𝐶) 𝑉(𝐷𝐸) (Error)% 10 1.0467 1.0407 0.5781 16 1.0288 1.0223 0.6307 17 1.0351 1.0299 0.5048 19 1.0159 1.0108 0.5057 20 1.0229 1.0175 0.5283 21 1.0286 1.0195 0.8864 22 1.0273 1.0172 0.9832 23 1.0110 1.0053 0.5628 24 1.0156 1.0082 0.7198 25 1.0281 1.0209 0.6990 26 1.0106 1.0034 0.7127 27 1.0442 1.0372 0.6720 29 1.0248 1.0178 0.6851 30 1.0136 1.0066 0.6915 max. error - - 0.9832
minal of the second outaged transformer (Bus-6) is in the bounded region of the first outaged transformer. Therefore, this is one of the worst cases from the point of computational accuracy. Voltage magnitudes of the critical buses showing a percentage error higher than a threshold value (0.5%) are reported in Table ((V). The maximum percentage error for this representative transformer-transformer outage is less than 2.75%. The percentage errors are high as being one of the worst double outages in the system.
TABLE V
BUS VOLTAGE MAGNITUDES FOR SIMULTANEOUS OUTAGES OF TRANSFORMER28-27AND TRANSFORMER6-10INIEEE-30BUS TEST
SYSTEM Bus No 𝑉(𝐴𝐶) 𝑉(𝐷𝐸) (Error)% 21 1.0088 1.0141 0.5328 22 1.0078 1.0133 0.5503 23 0.9958 1.0013 0.5527 24 0.9737 0.9822 0.8662 25 0.9139 0.9286 1.6076 26 0.8942 0.9104 1.8183 27 0.8888 0.9049 1.8050 29 0.8656 0.8860 2.3620 30 0.8521 0.8755 2.7379 max. error - - 2.7379
Figures (2) and (3) show the highest voltage magnitude percentage errors for the entire possible simultaneous double branch outages in IEEE 30 Bus and 118 bus test systems, respectively. As can be seen from the figures, the maximum percentage errors are low for most of the simulated double branch outages. For IEEE 30 bus test system, mean value and the standard deviation of the highest voltage magnitude percentage error per simulation are found to be 0.873% and 1.792 respectively. For IEEE 118 bus test system, these values are found to be 0.425% and 0.674 respectively. Note that, the maximum percentage voltage magnitude error per double outage was decreased as the system size increased.
The number of critical double-branch outages giving max-imum percentage errors greater than 5% is 20 and 42 for IEEE 30 bus test system and IEEE 118 bus test system,
Fig. 2. Double Branch Outage simulations and their maximum errors in IEEE 30 bus test system
Fig. 3. Double Branch Outage simulations and their maximum errors in IEEE 118 bus test system
respectively. They correspond to 1.65% and 0.27% of entire outages in IEEE 30 bus test system and in IEEE 118 bus test system, respectively. Tables (VI) and (VII) illustrate those crit-ical outages and corresponding maximum voltage magnitude percentage errors for the two test systems. Tables show the half number of the simulated double branch outages since, the other half is the symmetric branch outages. From a detailed analyze of the outages we can easily conclude that almost all the critical outages are Case-2 type outages. Among them, the followings give more severe results:
∙ One of the terminals of the outaged branch is included in the bounded region of the other outaged branch.
∙ There is a common bus between the terminals of the two outaged branches.
TABLE VI
CRITICAL DOUBLE BRANCH OUTAGES AND CORRESPONDING HIGH VOLTAGE MAGNITUDE ERRORS INIEEE 30BUS TEST SYSTEM
The first outaged branch The second outaged branch Error%
4 − 6 6 − 8 5.223 9 − 10 6 − 10 5.280 15 − 23 28 − 27 5.496 9 − 10 28 − 27 6.049 12 − 15 12 − 14 8.329 6 − 28 6 − 8 14.62 6 − 28 28 − 27 16.56 6 − 28 8 − 28 17.23 10 − 21 10 − 22 17.60 8 − 28 28 − 27 21.35
The highest maximum voltage magnitude error in IEEE 30 bus test system (see Table (VI)) is found for the simultaneous outage of line 8-28 and transformer 28-27. Bus-28 is the common terminal bus of the both outaged branches. Bounded regions for the two outaged branches are {6, 8, 27, 28} and
{6, 8, 25, 27, 28, 29, 30}, respectively. Since, the first bounded
TABLE VII
CRITICAL DOUBLE BRANCH OUTAGES AND CORRESPONDING HIGH VOLTAGE MAGNITUDE ERRORS INIEEE 118BUS TEST SYSTEM
The first outaged branch The second outaged branch Error%
23 − 24 22 − 23 5, 00 16 − 17 8 − 5 5, 13 8 − 5 30 − 17 5, 15 34 − 43 38 − 37 5, 39 14 − 15 8 − 5 5, 62 100 − 106 105 − 106 5, 67 23 − 32 22 − 23 5, 78 44 − 45 38 − 65 5, 78 53 − 54 49 − 51 6, 13 22 − 23 26 − 30 6, 34 34 − 43 38 − 65 6, 58 22 − 23 23 − 25 7, 12 56 − 58 49 − 51 7, 49 8 − 5 3 − 5 8, 19 49 − 51 51 − 58 8, 55 11 − 12 11 − 13 8, 66 38 − 65 38 − 37 9, 49 12 − 14 8 − 5 9, 63 12 − 16 8 − 5 10, 42 8 − 5 11 − 13 11, 32 30 − 38 38 − 37 12, 13
region is a subset of the second one, no element other than elements in the second set is involved in the union set which is computed in the solution of double branch outages. In addition post-outage voltage magnitude of Bus-30 is found to be0.86 p.u. which is low enough to create high computational errors for such an approximated modeling.
A similar case occurs for the simultaneous outage of lines 10 − 21 and 10 − 22. As in the previous case, this case also includes a common bus (Bus no: 10). Two bounded regions for this case are:{6, 9, 10, 17, 20, 21, 22} and
{6, 9, 10, 17, 20, 21, 22, 24} respectively. The first bounded
region is again the subset of the second one. Similar to the previous case, the bus voltage magnitude for bus no: 21 is found to be 0.87 p.u. which is a low value to create high computational errors.
Another double line outage with high error is the outage of lines 6 − 28 and 8 − 28, which includes a common bus (Bus no: 28). Bounded regions for this double line outage are: {6, 8, 27, 28} and {2, 4, 6, 7, 8, 9, 10, 27, 28} respectively. Similar to the previous cases, the first bounded region is again a subset of the second one. The bus voltage magnitude computed by full AC load flow is again a very low enough value:0.86 p.u. (bus 30) to create the similar problems.
Line 6 − 28 and transformer 28 − 27 outage has bus 28 as a common bus. Bounded regions for this case are:{2, 4, 6, 7, 8, 9, 10, 27, 28} and {6, 8, 25, 27, 28, 29, 30} re-spectively. None of the bounded regions is a subset of the other in this case. However, bus voltage magnitude computed by AC load flow for bus 30 is0.86 p.u.
If the other critical cases in Table (VI), are investigated, it can be seen that the outage of the line 15 − 23 and transformer28−27 is different than the others as not including common branches in the separate bounded regions. However, bus voltage magnitude of Bus-30 is 0.82 and is low enough
to create high computational errors because of high nonlinear-ities. On the other hand simultaneous outage of line 9 − 10 and transformer 28 − 27 is a special case. Bus-6 is included in the 3 of 4 bounded regions. Moreover, post-outage voltage magnitude of Bus-30 is again0.82 as being the source of high errors.
The highest maximum voltage magnitude error in IEEE 118 bus test system (see Table (VII)) is found for the si-multaneous outage of line 30 − 38 and transformer 38 − 37. Bus-38 is the common terminal bus of the both outaged branches. The bounded regions for the outaged branches can be found as {8, 17, 26, 30, 37, 38, 65} and
{30, 33, 34, 35, 37, 38, 39, 40, 65}. Four buses; namely Bus
30,37, 38 and 65 are included in both bounded regions. Similarly, simultaneous outage of the line11−13 and trans-former8 − 5 is one of the critical cases given in table (VII). The bounded regions are found as{4, 5, 11, 12, 13, 14, 15} ve
{3, 4, 5, 6, 8, 9, 11, 30}. Buses 4,5 and 11 exists in both of two
bounded regions. The highest error is obtained at bus 13, and the post-outage bus voltage magnitude for this bus is0.90 p.u. One other critical case is the simultaneous outage of the line 12 − 16 and transformer 8 − 5. The bounded re-gions for this case are {2, 3, 7, 11, 12, 14, 16, 17, 117} and
{3, 4, 5, 6, 8, 9, 11, 30} respectively. There are two critical
buses included in both bounded regions.0.93 p.u is the lowest post-outage bus voltage magnitude obtained using AC load flow. The remaining critical cases can be analyzed similarly.
V. CONCLUSION
This study has presented an extended version of an existing single branch outage model to account double-branch outages. A double branch outage phenomenon was first formulated as a local constrained optimization problem and was later solved by using differential evolution algorithm. The proposed formulation was finally tested on IEEE 30 bus test system and IEEE 118 bus test system.
Some sample simultaneous double branch outages repre-senting the different configurations were simulated for IEEE 30 and 118 bus test systems and the results were compared with those of full AC load flow calculations in terms of accuracy. All the possible double contingency simulations for the test systems were evaluated from the point of maximum voltage magnitude percentage errors. Finally, critical double contingencies giving high computational errors were analyzed in detail. This analysis has shown that high computational errors were observed for the double contingencies where there is a common buses and/or for the double contingencies where there are one or more buses in the bounded region of the two outaged branches. Both of these two cases have resulted in unacceptable post-outage voltage magnitudes for one or more load buses in the system. These low bus voltage magnitudes caused high computational errors due to the high nonlinearities. Fortunately, although the computational errors were high for these critical contingencies, the proposed method did not fail to identify the insecure contingencies.
REFERENCES
[1] A. J. Wood and B. F. Wollenberg, Power Generation Operation and
Control, 2nd ed., New York, USA: Wiley, 1998.
[2] C. Y. Lee, and N. Chen, “Distribution factors of reactive power flow in transmission line and transformer outage studies,” IEEE Trans. Power
Syst., vol. 17, pp. 194–200, Feb. 1992.
[3] M. Ilic, and A. Phadke, “Redistribution of reactive power flow in contingency analysis,” IEEE Trans. Power Syst., vol. 1, pp. 266–275, Aug. 1986.
[4] D. G. Taylor, and L. J. Maahs, “A reactive contingency analysis algorithm using MW and MWAR distribution factors”, IEEE Trans. Power Syst., vol. 6, pp. 349–355, Feb. 1991.
[5] A. Ozdemir, Y. J. Lim, and C. Singh, “Branch outage simulation for MWAR flows: bounded network solution”, IEEE Trans. Power Syst., vol. 18, pp. 1523–1528, Nov. 2003.
[6] A. Ozdemir, Y. J. Lim, and C. Singh, “Post-outage reactive power flow calculations by genetic algorithms: constrained optimization approach”,
IEEE Trans. Power Syst., vol. 20, pp. 1266–1272, Aug. 2003.
[7] O. Ceylan, A. Ozdemir, and H. Dag, “Branch outage solution using particle swarm optimization”, AUPEC 2008, Australasian Universities
Power Engineering Conference, Sydney, Australia, Dec. 2008.
[8] O. Ceylan, A. Ozdemir, and H. Dag, “Comparison of post outage bus coltage magnitudes estimated by harmony search and differential evolution methods”, ISAP 2009, The 15th International Conference on
Intelligent System Applications to Power Systems, Curitiba, Brazil, Nov.
2009.
[9] C. M. Davis, T. J. Overbye, “Multiple element contingency screening”,
IEEE Trans. Power Syst., in Press.
[10] K. R. C. Mamandur, C. J. Berg, “Efficient simulation of line and transformer outages in power systems ”, IEEE Trans. Power Syst., vol. 10, pp. 3733–3742, Oct. 1982.
[11] E. G. Preston, M. L. Baughman, and W. M. Grady, “A New model for outaging transmission linesin large electric networks”, IEEE Trans. Power
Syst., vol. 14, pp. 412–418, May 1999.
[12] R. Storn, and K. Price, “Differential Evolution- a simple and efficient adaptive scheme for global optimization over continuous spaces”, Techni-cal Report TR-95-012, ICSI, http://http.icsi.berkeley.edu/ storn/litera.html. [13] R. Storn, and K. Price, “Minimizing the real functions of the ICEC 96 contest by differential evolution”, Int. Conf. on Evolutionary
Computa-tion, Nagoya, Japan, May 1996.
[14] N. Duvvuru, and K. S. Swarup, “A hybrid interior point assisted differential evolution algorithm for economic dispatch”, IEEE Trans.
Power Syst., in Press.
[15] Y. G. Yang, Z. Y. Dong, and K. P. Wong, “A modified differential evolution algorithm with fitness sharing for power system planning”,
IEEE Trans. Power Syst., vol. 23, pp. 514–522, May 2008.
[16] H. R. Cai, Y. C. Chung, and K. P. Wong, “Application of differential evolution algorithm for transient stability constrained optimal power flow”, IEEE Trans. Power Syst., vol. 23, pp. 719–728, May 2008. [17] S. Kannan, S. M. R. Slochanal, S. Baskar, and P. Murugan, “Application
and comparison of meta-heuristic techniques to generation expansion planning in the partially deregulated environment”, IET Generation,
Transmission and Distribution, vol. 1, pp. 111–118, Jan. 2007.
[18] S. Patra, S. K. Gowami, and B. Goswami, “A binary differential evolution algorithm for transmission and voltage constrained unit commit-ment”, Joint International Conference on Power System Technology and
IEEE Power India Conference POWERCON 2008, pp. 1–8, Oct. 2008.
[19] K. V. Price, “Differential evolution: a fast and simple numerical opti-mizer”, Biennial Conference of the North American Fuzzy Information
Processing Society, pp. 524–527, June 1996.
[20] R. Zimmermann, and D. Gan, “Matpower Manual”, USA: PSERC Cornell Univ. 1997.