Post Outage Bus Voltage Calculations for Double
Branch Outages
Oguzhan Ceylan
Informatics Institute Istanbul Technical University [email protected]Aydogan Ozdemir
Electrics-Electronics Faculty Istanbul Technical UniversityHasan Dag
Faculty of Arts and Sciences Kadir Has University [email protected]
Abstract—Secure operation of electrical power systems is vital, hence fast and accurate post-outage state calculations are important for contingency analysis. Contingency analysis includes simulations of both the single and double branch outages. This paper presents constrained optimization problem of a recently developed double branch outage model. Harmony search algorithm is used as an optimization tool. IEEE 30 Bus Test system simulation results are given, and compared with those of the AC load flow in terms of computational accuracy. Speed test results of IEEE 14, 30, 57, 118 and 300 Bus Test Systems are illustrated and compared with those of the AC load flow calculations.
Index Terms—double branch outage, harmony search algo-rithm, heuristic methods, modeling, optimization
I. INTRODUCTION
With the advent of technology, power systems faced up with new mobile customers, distributed generations, and storage elements. Outage of any components in the system can cause significant problems; hence remedial actions should be taken on time. Contingency analysis deal with the solutions of the single and multiple branch outages. Single branch outages have been widely studied and the results have been published in the past [1]–[6]. A recent work simulated branch outage problem by a pair of fictitious power sources and formulated it as a local constrained optimization problem [6]. The model used the information of only the outaged buses and their first order neighbours and gave good results in terms of accuracy and speed. Up to now, optimization problem of this model has been solved by differential evolution method, harmony search [7], particle swarm optimization [8], and gravitational search [9]. Based on this model, a model to simulate double branch outages was formulated as a local constrained opti-mization problem [10]. The number of single branch outages is proportional with the number of branches whereas the number of double branch outages is proportional with the square of the number of branches in a power system [11]. This means that time required for a complete double branch outage contingency analysis will be proportional with the square of the size of the power system under test. Hence the developed model must be fast to provide acceptable accuracy. There have been some double branch outage model applications [4], [12] in the past, but they only gave the results of very limited non problematic cases.
In this paper we have used the model in [10], and we solved the local constrained optimization problem of this model by using harmony search algorithm [13]. Being a fast alternative to the other intelligent methods such as particle swarm optimization, differential evolution, genetic algorithms, etc. this method is promising and gaining more importance day by day. It is a newly developed method that mimics of the jazz musicians. improvisation process and consists of mainly four basic steps similar to the other heuristic methods. These are; initialization of solution candidates, improvisation, update process, control of stopping criterion. Up to now, harmony search method has been applied to several areas and economic dispatch problem [14] in electrical power systems.
The proposed solution by harmony search method aims to speed up on electrical power systems. in electrical power systems. sed solution by harmony search method aims to speed up the solution without sacrificing from the accuracy. We used IEEE 30 Bus Test system for accuracy tests of the proposed double branch outage simulation method. For computational speed tests, we used IEEE 14, 30, 57, 118 and 300 Test systems. For power system related studies Matpower [16] was used, which is a Matlab based power system package.
The rest of the paper is organized as follows: In the second part, a double branch outage model and a local optimization method for solving double branch outages are defined. In the third part, algorithm for the application of the harmony search algorithm for the double branch outage problem is given. In the next part, test results of IEEE 30 bus test systems are compared to those of AC load flow results in terms of accuracy, and speed test results of IEEE 14, 30, 57, 118 and 300 Bus Test Sytems are given and compared to those of AC load flow results. Finally, conclusion part concludes the paper.
II. DOUBLEBRANCHOUTAGEMODEL
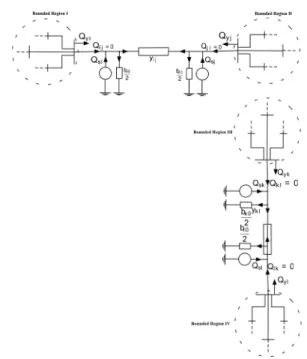
We use a recently developed double branch outage model [10] which is based on a single branch outage model [6]. Outages can be modeled by inserting fictitious sources and minimizing the reactive power flows so that there will be no reactive flows through the branches. This idea can also be employed to double branch outages. Assume that the branches between buses i and j, and the branches between buses k and l are simultaneously outaged. The first branch outage is simulated by using fictitious source pairs𝑂𝑠𝑖and𝑄𝑠𝑗and the
second branch outage is simulated by using fictitious source pairs 𝑄𝑠𝑘 and𝑄𝑠𝑙. In Figure 1 double branch outage model and corresponding reactive power flows are shown.
Bounded Region I Bounded Region II
Bounded III
Bounded
Fig. 1. Double branch outage model and corresponding reactive power flows
The steps of double branch outage modeling can be given as follows [10],
∙ Select two branches to be outaged and number them as: 𝑖𝑗, and 𝑘𝑙.
∙ Compute the bus voltage angles by using the linearized active power equations as shown below.
𝛿𝑚= 𝛿𝑚+ (𝑋𝑚𝑖− 𝑋𝑚𝑗) △ 𝑃𝑛+ (𝑋𝑚𝑘− 𝑋𝑚𝑙) △ 𝑃𝑟 𝑙 = 2, 3, ⋅ ⋅ ⋅ , NB △𝑃𝑛= [1 − (𝑋 𝑃𝑖𝑗 𝑖𝑖+ 𝑋𝑗𝑗− 2𝑋𝑖𝑗)/𝑥𝑛] (1) △𝑃𝑟= [1 − (𝑋 𝑃𝑘𝑙 𝑘𝑘+ 𝑋𝑙𝑙− 2𝑋𝑘𝑙)/𝑥𝑟]
where,𝑋𝑖𝑗 represents the𝑖th row, 𝑗th column element of the bus susceptance matrix, 𝑋𝑘𝑙 represents the𝑘th row, 𝑙th column element of the bus susceptance matrix, 𝑃𝑖𝑗
and𝑃𝑘𝑙are the pre-outage active power flows through the outaged branches, and𝑥𝑛 and𝑥𝑟represent the reactance of the branches at hand.
∙ Calculate the loss reactive powers, represented as ˜𝑄𝐿𝑖∼= ˜
𝑄𝐿𝑗, ˜𝑄𝐿𝑘∼= ˜𝑄𝐿𝑙, for the optimization cycle.
∙ Minimize reactive power mismatches at buses 𝑖, 𝑗, 𝑘 and 𝑙. This process is mathematically equivalent to the following constrained optimization problem.
min 𝑤𝑟𝑡 𝑄𝑠𝑖,𝑄𝑠𝑘∥ 𝑄𝑖− (𝑄𝑖𝑗+ 𝑄𝐿𝑖) + 𝑄𝐷𝑖 𝑄𝑗− (−𝑄𝑖𝑗+ 𝑄𝐿𝑖) + 𝑄𝐷𝑗 𝑄𝑘− (𝑄𝑘𝑙+ 𝑄𝐿𝑘) + 𝑄𝐷𝑘 𝑄𝑙− (−𝑄𝑘𝑙+ 𝑄𝐿𝑖) + 𝑄𝐷𝑙∥ (2) subject to 𝑔𝑞(𝑉𝑏) = △𝑄𝑏− 𝐵𝑏△ 𝑉𝑏= 0 where, ∥ ⋅ ∥ is the Euclidean norm of a vector. The constraint part of (2) is linearized reactive power equation for load buses, △𝑄𝑏 is the reactive power mismatch vector in the bounded region,𝑉𝑏 is the load bus voltage
magnitude vector in the bounded region and 𝐵𝑏 is the bus susceptance matrix for the bounded region.
III. HARMONYSEARCHALGORTIHM FORDOUBLE
BRANCHOUTAGEMODEL
Harmony search algorithm for double branch outage prob-lem can be summarized as follows:
∙ Decide on harmony search algorithm parameters, har-mony memory size (HMS), haahar-mony memeory consid-eration rate (HMCR), pitch adjusting rate (PAR).
∙ Run power flow to obtain pre-outage bus voltage magni-tudes.
∙ Create matrix A whose size is HMS by two. The elements of the first column of A are between𝑄𝑖𝑗+𝜔 and 𝑄𝑖𝑗−𝜔 and the elements of second column of A are between 𝑄𝑖𝑗+ 𝜔 and 𝑄𝑖𝑗− 𝜔
∙ Let buses in the bounded region obtained for the first bounded region be named as Bound1 and for the second bounded region be named as Bound2. Find the union of these two sets as follows:
Union= Bound1 ∪ Bound2 (3)
∙ For every element of the first column of A matrix, perform the computations given below.
△𝑸1 = [0, 0, ⋅ ⋅ ⋅ , 𝐴(1,𝑖), ⋅ ⋅ ⋅ , 𝐴(1,𝑗), ⋅ ⋅ ⋅ , 0]𝑇
𝐴(1,𝑗) = −𝐴(1,𝑖)+ 2𝑄𝐿1𝑖 (4)
△Vunion = B−1union△Q1
Vunionone = Vunion+ △Vunion (5)
Similarly, using the second column elements of matrix A, perform the following computations:
△𝑸2 = [0, 0, ⋅ ⋅ ⋅ , 𝐴(2,𝑘), ⋅ ⋅ ⋅ , 𝐴(2,𝑙), ⋅ ⋅ ⋅ , 0]𝑇
𝐴(2,𝑙) = −𝐴(2,𝑘)+ 2𝑄𝐿2𝑘 (6)
△Vunion = B−1union△Q2
∙ Compute the objective functions (mismatch vector) for the revised load bus voltage magnitudes.
∙ Perform the following steps until a stopping criterion is reached
– Create a random number in [0, 1] interval. If this number is smaller than HMCR, select a random element from A matrix, otherwise create another value in the range that has been specified by the user. Let this newly selected variable or newly created value be named as new variable.
– Create two different numbers in[0.1] interval. If the first one these two numbers is smaller than PAR don’t perform any operation otherwise depending on the comparison of the second number to0.5, add brange multiplied by a random number in [0, 1] interval to new variable or not.
– Perform the following computations.
△𝑸1 = [0, 0, ⋅ ⋅ ⋅ , n. var., ⋅ ⋅ ⋅ , -n var., ⋅ ⋅ ⋅ , 0]𝑇
(8)
△Vunion = B−1union△Q1
Vunionone = Vunion+ △Vunion (9)
where, n. var. represents new variable. Similarly, using the second column elements of matrix A, perform the following computations:
△𝑸2 = [0, 0, ⋅ ⋅ ⋅ , n. var., ⋅ ⋅ ⋅ , -n.var, ⋅ ⋅ ⋅ , 0]𝑇
(10)
△Vunion = B−1union△Q2
Vuniontwo = Vunionone+ △Vunion (11)
– By using the new computed voltage magnitudes, compute the objective function values. Sort the el-ements of Amatrix according to these values.
IV. TESTRESULTS
Double branch outage simulations are tested on IEEE 30 bus test systems. Matlab based open-source software Matpower [16] is used as a tool. Programs for simulating the outages are written in Matlab.
One can easily see that there are two formations possible in terms of system topology. The first topology, includes no buses in the set of intersections of the bounded regions, as shown in Figure 1, and the second topology includes at least one element in the set of intersections of the bounded regions [10].
On the other hand, there are 3 different outage cases for each of the two topologies, namely [10]: (a)
1) Outaged branches are either power transmission lines or underground cables. None of the outaged branches include a tap changing transformer between the outaged bus pairs.
2) One of the outaged branch is a transmission line/underground cable and the other one includes a transformer between the outaged bus pairs.
3) Both of the outaged branches include a transformer between the outaged bus pairs.
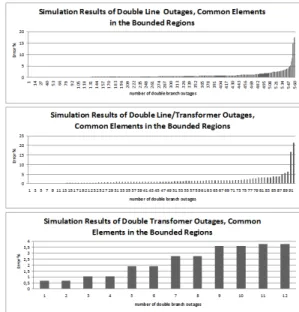
In Figure (2) percentage errors versus number of branch outages are shown for the cases that doesn’t include com-mon elements in the bounded regions. Since there are no transformer∖transformer outages this case is not shown. Note that, there are same number of double transformer/line outages more, which have the same error values so graph of this is not shown.
Fig. 2. Graphs of percentage error versus number of double branch outages,
no-common elements in the bounded region, for IEEE 30 Bus Test System
In Figure (3) percentage errors versus number of branch outages are shown for the cases that include common elements in the bounded regions. Graphs of three different cases are also shown in the figure. As in the previous figure, there are same number of double transformer/line outages more, which have the same error values so graph of this is not shown.
Fig. 3. Graphs of percentage error versus number of double branch outages,
Following tables give some results for the different double branch outage simulations for IEEE 30 bus test systems. In the tables 𝑉𝐴𝐶 repesents the calculated post-outage voltage magnitude of a specific bus by using AC load flow, on the other hand𝑉𝐻𝑆 symbolizes the calculated post-outage voltage magnitude of a specific bus by using harmony search method. 𝐸𝑟𝑟% represents the percentage error of the specific bus voltage magnitude, and is compued as follows.
Err% = 100 ×𝑎𝑏𝑠(𝑉𝐴𝐶𝑉 − 𝑉𝐺𝑆𝐴)
𝐴𝐶 (12)
The outages, which do not create convergence problems, do not cause islanding problem and do result in load bus voltages less than 0.8 p.u were tested. Total of 1214 double branch outage simulations were performed for IEEE 30 bus test system.
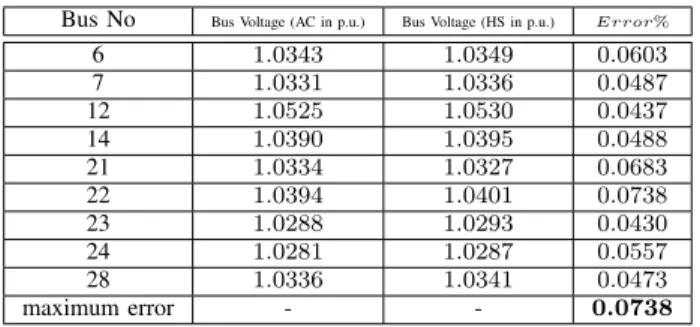
We present sample results of double branch outage simu-lations in the following tables. The first one, simultanesous outage of lines 3 − 4 and 21 − 22 is an example that does not have a common element in the bounded regions, and is composed of only transmission lines or cables. Table (I) illustrates simulation results for this line-line outage. In the table, only voltage magnitudes that show a percentage error higher than 0.04 are presented, due to limited space. In the following tables, Bus No. represents the bus number, 𝑉(𝐴𝐶) represents the bus voltage magnitudes computed by using full AC load flow in per unit, 𝑉(𝐻𝑆) represents the bus voltage magnitudes computed by the proposed HS based solution of local constrained optimization problem in per unit, and Error % represents the percentage difference between 𝑉(𝐴𝐶) and 𝑉(𝐻𝑆). Note that maximum percentage error for this representative line-line outage is less than 0.08%.
TABLE I
IEEE-30 BUSTESTSYSTEM,SIMULATION RESULTS OF,SIMULTANEOUS
OUTAGES OF3-4AND21-22BRANCHES
Bus No Bus Voltage (AC in p.u.) Bus Voltage (HS in p.u.) 𝐸𝑟𝑟𝑜𝑟%
6 1.0343 1.0349 0.0603 7 1.0331 1.0336 0.0487 12 1.0525 1.0530 0.0437 14 1.0390 1.0395 0.0488 21 1.0334 1.0327 0.0683 22 1.0394 1.0401 0.0738 23 1.0288 1.0293 0.0430 24 1.0281 1.0287 0.0557 28 1.0336 1.0341 0.0473 maximum error - - 0.0738
The second presented double branch outage, outage of transformer 6 − 9 and outage of line 14 − 15 again does not have a common element in the bounded regions, it is composed of a transmission line and a transformer. The results of the simulation results of this case are given in table (II) for the voltage magnitudes of the buses showing a percentage error higher than 0.3%. Maximum percentage error for this case is obtained as 0.37%.
There is not any case that does not have a common element and composed of two transformers.
TABLE II
IEEE-30 BUSTESTSYSTEM,SIMULATION RESULTS OF,SIMULTANEOUS
OUTAGES OF TRANSFORMER6-9AND LINE14-15 Bus No Bus Voltage (AC in p.u.) Bus Voltage (HS in p.u.) 𝐸𝑟𝑟𝑜𝑟%
10 1.0410 1.0449 0.3739 17 1.0358 1.0391 0.3143 20 1.0255 1.0287 0.3117 21 1.0294 1.0331 0.3611 22 1.0303 1.0339 0.3519 maximum error - - 0.3739
The third presented double branch outage, outage of line 19 − 20 and outage of line 16 − 17 has at least one common element in the bounded regions, it is composed of transmission lines and/or cables. The results of the simulation results of this case are given in table (III) for the voltage magnitudes of the buses showing a percentage error higher than0.1%. Maximum percentage error for this case is obtained as0.32%.
TABLE III
IEEE-30 BUSTESTSYSTEM,SIMULATION RESULTS OF,SIMULTANEOUS
OUTAGES OF LINES19-20AND16-17
Bus No Bus Voltage (AC in p.u.) Bus Voltage (HS in p.u.) 𝐸𝑟𝑟𝑜𝑟%
16 1.0448 1.0461 0.1242
17 1.0464 1.0452 0.1187
18 1.0046 1.0026 0.2054
19 0.9941 0.9909 0.3183
maximum error - - 0.3183
Simultaneous outages of transformer4−12 and line 10−22 has at least one element in the bounded regions. Bus-6 has a direct connection to 4 and to 10. Therefore, Bus-6 is included both in the neighborhood of the first outaged branch and in the neighborhood of the second outaged branch. Voltage magnitudes of the critical buses showing a percentage error higher than a threshold value (0.5%) are reported in Table ((IV). Note that the maximum percentage error for this representative transformer-line outage is less than 1.0%. In addition, the percentage errors are generally high when compared with those of the previous outages.
TABLE IV
IEEE-30 BUSTESTSYSTEM,SIMULATION RESULTS OF,SIMULTANEOUS
OUTAGES OF TRANSFORMER4-12AND LINE10-22 Bus No Bus Voltage (AC in p.u.) Bus Voltage (HS in p.u.) 𝐸𝑟𝑟𝑜𝑟%
10 1.0467 1.0407 0.5759 16 1.0288 1.0224 0.6266 17 1.0351 1.0299 0.5019 19 1.0159 1.0108 0.5027 20 1.0229 1.0175 0.5255 21 1.0286 1.0194 0.8901 22 1.0273 1.0171 0.9889 23 1.0110 1.0054 0.5618 24 1.0156 1.0082 0.7225 25 1.0281 1.0209 0.7008 26 1.0106 1.0034 0.7147 27 1.0442 1.0372 0.6734 29 1.0248 1.0178 0.6865 30 1.0136 1.0066 0.6929 maximum error - - 0.9889
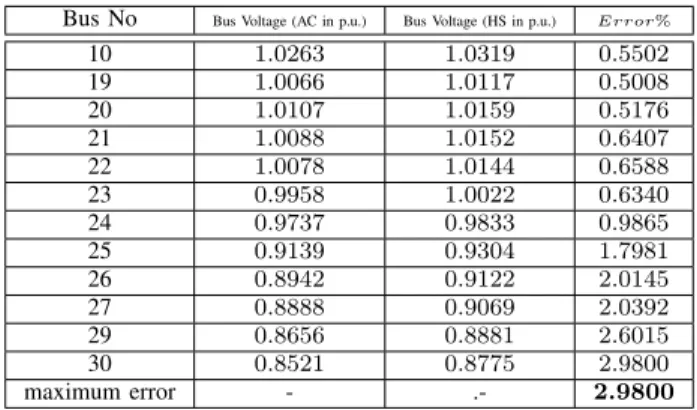
The last representative double branch outage is the outage of transformer 28 − 27 and transformer 6 − 10. This case has at least one element in the set of intersecitons of the bounded regions. This can be explained as follows: Bus-8 has a direct connection to Bus-28 and to Bus-6. Therefore, Bus-8 is included both in the neighborhood of the first outaged branch and in the neighborhood of second outaged branch. Moreover, one terminal of the second outaged transformer (Bus-6) is in the bounded region of the first outaged transformer. Therefore, this one is expected to produce one of the worst simulation re-sults in terms of computational accuracy. Due to limited space 0.5 is selected as a threshold value for voltage magnitudes to be presented in table ((V). The maximum percentage error for this transformer-transformer outage is less than 2.98%. The percentage errors are high as being one of the worst double branch outages in the system.
TABLE V
IEEE-30 BUSTESTSYSTEM,SIMULATION RESULTS OF,SIMULTANEOUS
OUTAGES OF TRANSFORMERS28-27AND6-10 Bus No Bus Voltage (AC in p.u.) Bus Voltage (HS in p.u.) 𝐸𝑟𝑟𝑜𝑟%
10 1.0263 1.0319 0.5502 19 1.0066 1.0117 0.5008 20 1.0107 1.0159 0.5176 21 1.0088 1.0152 0.6407 22 1.0078 1.0144 0.6588 23 0.9958 1.0022 0.6340 24 0.9737 0.9833 0.9865 25 0.9139 0.9304 1.7981 26 0.8942 0.9122 2.0145 27 0.8888 0.9069 2.0392 29 0.8656 0.8881 2.6015 30 0.8521 0.8775 2.9800 maximum error - .- 2.9800
In the following tables we present results of speed tests we have conducted for IEEE 14, 30, 57, 118 and 300 Bus Test Systems. The number of double branch outages simulated are 260 for IEEE 14 Bus Test System, 1214 for IEEE 30 Bus Test System, 4148 for IEEE 57 Bus Test System, 15380 for IEEE 118 Bus Test System and 87614 for IEEE 300 Bus Test System.
Table (VI) gives average time per double outage for different test systems are given for both harmony search based simula-tion and AC load flow. We use 3000 iterasimula-tions as maximum number of iterations, and if the best value does not change for 300 consecutive iterations the program stops. From the table while the average time for harmony search behaves nearly linearly, the average time for AC load flow increases quadratically. For IEEE 118 Bus Test System, mean error value is computed as 0.45 and standart deviation is computed as 0.74.
If we decrease maximum number of iterations to 1500, and if the best value does not change for 150 consecutive iterations, the new average times per outage are shown in table (VII). Again the average time for harmony search method behaves linearly and for IEEE 300 Bus system the time obtained is less than that of AC load flow. For IEEE 118 Bus Test System, mean error value is computed as 0.47 and standart deviation
TABLE VI
SPEEDS PER DOUBLE OUTAGE SIMULATION BY USINGHSMETHOD AND
ACLOAD FLOW IN SECONDS, MAX.ITERATION NUMBER=3000,CONTROL OF CHANGE FOR LAST300ITERATIONS.
Test System HS AC IEEE 14 Bus 0.0485 0.0107 IEEE 30 Bus 0.0505 0.0133 IEEE 57 Bus 0.0499 0.0175 IEEE 118 Bus 0.0386 0.0204 IEEE 300 Bus 0.0592 0.0439 is computed as0.84. TABLE VII
SPEEDS PER DOUBLE OUTAGE SIMULATION BY USINGHSMETHOD AND
ACLOAD FLOW IN SECONDS, MAX.ITERATION NUMBER=1500,CONTROL OF CHANGE FOR LAST150ITERATIONS.
Test System HS AC IEEE 14 Bus 0.0395 0.0107 IEEE 30 Bus 0.0403 0.0133 IEEE 57 Bus 0.0344 0.0175 IEEE 118 Bus 0.0325 0.0204 IEEE 300 Bus 0.0424 0.0439
If the number of consecutive iterations that does not change is decreased to 75, the new average times per outage are shown in table (VIII). Again the average time for harmony search method behaves linearly and faster than the previous examples. For this case, for IEEE 118 Bus Test System, mean error value is computed as 0.77 and standart deviation is computed as 1.64.
TABLE VIII
SPEEDS PER DOUBLE OUTAGE SIMULATION BY USINGHSMETHOD AND
ACLOAD FLOW IN SECONDS, MAX.ITERATION NUMBER=1500,CONTROL OF CHANGE FOR LAST75ITERATIONS.
Test System HS AC IEEE 14 Bus 0.0256 0.0107 IEEE 30 Bus 0.0275 0.0133 IEEE 57 Bus 0.0229 0.0175 IEEE 118 Bus 0.0259 0.0204 IEEE 300 Bus 0.0256 0.0439 V. CONCLUSIONS
In this study, the constrained optimization problem rep-resenting the double branch outage phenomena in an elec-tric power system is solved by using the harmony search algorithm. Accuracy results of sample double branch out-age simulations of IEEE 30 Bus Test systems are given. IEEE 14,30,57, 118 and 300 Bus Test systems are used for speed tests to compare AC load flow computational speed to harmony search based double branch outage simulation. Simulation results show that harmony search based double branch outage simulation is accurate and fast.
REFERENCES
[1] C. Y. Lee, and N. Chen, “Distribution factors of reactive power flow in transmission line and transformer outage studies,” IEEE Trans. Power Syst., vol. 17, pp. 194–200, Feb. 1992.
[2] M. Ilic, and A. Phadke, “Redistribution of reactive power flow in contingency analysis,” IEEE Trans. Power Syst., vol. 1, pp. 266–275, Aug. 1986.
[3] M. S. Sachdev, and S. A. Ibrahim, “A fast approximate technique for outage studies in power system planning and operation”, IEEE Trans. Power App. Syst., vol. 93, pp. 1133–1142, July. 1974.
[4] K. R. C. Mamandur, and G. J. Berg “Efficient simulation of line and transformer outages in power systems”, IEEE Trans. Power App. Syst., vol. 101, pp. 3733–3741, Oct. 1982.
[5] P. A. Ruiz, and P. W. Sauer, “Voltage and reactive power estimation for contingency analysis using sensitivities”, IEEE Trans. Power Syst., vol. 22:2, pp. 639–647, May. 2007.
[6] A. Ozdemir, Y. J. Lim, and C. Singh, “Branch outage simulation for MWAR flows: bounded network solution”, IEEE Trans. Power Syst., vol. 18, pp. 1523–1528, Nov. 2003.
[7] O. Ceylan, A. Ozdemir, and H. Dag, “Comparison of post outage bus coltage magnitudes estimated by harmony search and differential evolution methods”, ISAP 2009, The 15th International Conference on Intelligent System Applications to Power Systems, Curitiba, Brazil, Nov. 2009.
[8] O. Ceylan, A. Ozdemir, and H. Dag, “Branch outage solution using particle swarm optimization”, AUPEC 2008, Australasian Universities Power Engineering Conference, Sydney, Australia, Dec. 2008
[9] O. Ceylan, A. Ozdemir, and H. Dag, “Branch outage simulation based contingency screening by gravitational search algorithm”, International Review of Electrical Engineering, vol. 7:1, pp. 3370–3379, Jan.-Feb. 2012
[10] O. Ceylan, A. Ozdemir, and H. Dag, “Double branch outage modeling and its solution using differential evolution method”, The 16th Interna-tional Conference on Intelligence System Applications to Power Systems, Sep. 2011.
[11] C. M. Davis, T. J. Overbye, “Multiple element contingency screening”, IEEE Trans. Power Syst., vol. 26:3, pp. 1294–1301 Aug. 2011 [12] E. G. Preston, M. L. Baughman, and W. M. Grady, .A New model for
outaging transmission linesin large electric networks., IEEE Trans. Power Syst., vol. 14, pp. 412–418, May 1999.
[13] Z. W. Geem, J. H. Kim, and G. V. Loganathan, “A new heuristic
optimization algorithm: harmony search”, Simulation, vol. 76-2, pp. 60. 68, Feb. 2001.
[14] A. Vasebi, M. Fesanghary, and S. M. T. Bathaee, “Combined heat and power economic dispatch by harmony search algorithm”, International Journal of Electrical Power and Energy Systems, vol. 29-10, pp. 713– 719, Dec. 2007.
[15] O. Ceylan, A. Ozdemir, and H. Dag, “Comparison of post outage bus voltage magnitudes estimated by harmony search and differential evolution methods”, The 15th International Conference on Intelligence System Applications to Power Systems, Nov. 2009.
[16] R. D. Zimmerman, C. E. Murillo-Sanchez, and R. J. Thomas, “Matpower steady-state operations, planning and analysis tools for power systems research and education”, IEEE Trans. Power Syst., vol. 26:1, pp. 12–19 Feb. 2011