Branch Outage Solution Using Particle Swarm
Optimization
Oguzhan Ceylan
*, Aydogan Ozdemir
†and Hasan Dag
‡
* Oguzhan Ceylan is with Informatics Institute, of Istanbul Technical University,
Maslak 34469, Istanbul, Turkey ([email protected])
†Aydogan Ozdemir is with Electrics-Electronics Faculty of Istanbul Technical
University, Maslak 34469, Istanbul Turkey
‡Hasan Dag is with Science and Letters Faculty of Kadir Has University, Cibali,
Istanbul, Turkey
Abstract-For post outage MW line flows and voltage magnitude calculations most of the methods use linear methods because of their simplicity. Especially for reactive power flow calculations, one can face high errors. In this paper, we use a minimization method that minimizes the errors resulting from the linear system model implementation. We solve the optimization problem, using particle swarm optimization. We give some outage examples using IEEE 14 bus, IEEE 30 bus, and IEEE 57 bus data and compare the results with full ac load flow calculation.
I. INTRODUCTION
In power systems steady-state security analysis, in order to assess the security of the power system, evaluation of the effects of large number of contingencies is needed. On the other hand line outage studies are the basic tools of security analysis. In power system control center contingency analysis, the main aim is to determine the steady state effects of the outages.
Line outage modeling is important because of the estimation need of the post outage state of an electrical power system. This estimation is one of the major tasks of a power system operator in a modern electricity management center. Also it must be performed in real time because of the dynamic nature of electrical power systems. Normally one has to perform a full ac load flow to get accurate results but due to occurrence possibility of large number of contingencies this is impossible. Therefore, for determining post outage state, some fast, approximate models were developed.
For real power flow computation, DC load flow method has enough accuracy [1]. Some network sensitivity factors have been proposed for estimating post-outage megawatt flows in the system, but DC load flow can’t handle voltage magnitude violations, therefore AC load flow was later used for this purpose.
For voltage magnitudes and reactive power flows, the methods mentioned above have large computational errors because of the usage of the linearized power system models.
One of the recent papers formulates line outage as a constrained optimization problem [2] and this optimization is achieved by Lagrangian function approach. Line outage modeling is performed only in a bounded network, which
consists of sending end of outaged branch, receiving end of outaged branch, and the neighboring connected branches of these two components. Objective function of the optimization problem is to minimize the differences between the actual and reactive bus powers at the sending and receiving end busses.
This approach brings some advantages regarding the computational efficiency.
Optimization problems can be solved by gradient based optimization methods such as the steepest descent method, conjugate gradient method, etc., or non-gradient based methods such as, genetic algorithms, particle swarm optimization algorithms, ant colony optimization algorithms, simulated annealing algorithms, tabu search algortihms etc. In this paper we use the particle swarm optimization method to solve the optimization problem. Matlab oriented cost free power systems package Matpower [3] is used as a simulation tool.
Particle swarm optimization is one of the evolutionary techniques, and has been widely used in power system applications, such as economic dispatch problem [4], state estimation problem [5], optimal load flow problem [6], etc. in recent years. It is based on social behaviors of birds, or any other populations that have swarming behavior.
The organization of the paper is as follows. In the second section of the paper the existing method modeling line outage problem is given. In the third section, particle swarm optimization basics are given. Section four presents the proposed particle swarm optimization algorithm for solving the minimization problem in detail. Lastly, outage solutions using IEEE 14, 30, and IEEE 57 bus data, are given and are compared with the full ac load flow calculations.
II. METHOD AND THE ALGORITHM
π equivalent of a transmission line connected between busses i and j and the associated reactive power flow model is given in Fig. 1. Reactive power flowing through line i, transferred reactive power, and reactive power losses are represented by, , and respectively, and expressed as follows: ij Q T ij Q QLi } . . { Im * j ij i ij ag y Q =− V V 2 sin ] cos [ 2 2 i0 i ji ij j i ij ji j i i b V g V V b V V V − δ + δ − − = ) 1 (
Figure 1. π equivalent of a transmission line and reactive power flows. a) π equivalent of a transmission line. b) reactive power flows.
where, and represent ith and jth bus voltage magnitudes, and represents line admittances.
On the other hand is half of line susceptance and difference between angles and is represented by .
Pre-outage and post-outage states are shown in Fig. 2. a and b respectively. Line outage is simulated by fictitious source pairs and as shown in Fig. 2 c [2].
Figure 2: Line outage modelling a) pre-outage b) actual outage c) simulated post-outage.
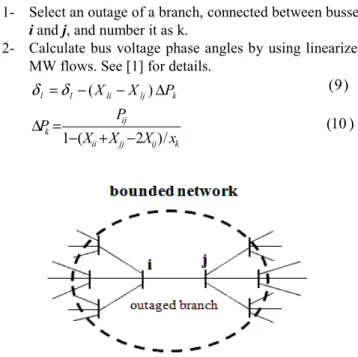
An example of an outaged line and its bounded region is given in Fig.3. It should be stated that only load bus voltage magnitudes in the bounded region should be taken into consideration during the computation process of the optimization problem.
An outage simulation by fictitious sources can be represented as shown below:
where, post reactive powers are identified with the bar on their tops. To deal with one variable, equations (4) and (5) are summed, is eliminated and can be represented in terms of as shown below:
On the other hand, reactive power mismatches, circulating in the network can be given as follows:
Where and are the net reactive power and the reactive power demand at bus i.
The procedure for the existing method can be given as follows:
1- Select an outage of a branch, connected between busses
i and j, and number it as k.
2- Calculate bus voltage phase angles by using linearized MW flows. See [1] for details.
Figure 3: Outaged branch and bounded network.
) 2 ( ) 3 ( ) 4 ( ) 5 ( Li T ij si Q Q Q = + Li T ij sj Q Q Q =− + si Li sj Q Q Q = 2 − ) 10 ( i V Vj ji ij j i ij j i T ij VV g b V V Q =− − + sin δ 2 ] [ 2 2 4 ) ( 2 ] cos 2 [ 2 2 2 2 i0 j i ij ji j i j i Li b V V b V V V V Q =− + − δ − + ji
δ
jδ
δ
i si Q Qsj ) 6 ( Dj sj j Q Q Q = − Di si i Q Q Q = − (7) ) 8 ( Di Q i Q k lj li l l =δ
−(X −X )ΔPδ
k ij jj ii ij k x X X X P P / ) 2 ( 1− + − = Δ ) 9 ( ij ij ij g jb y = + 0 0 j i b b = si Q sj Q T ij Qwhere X is the inverse of the bus susceptance matrix is the pre-outage active power flow through the line and the reactance of the line is represented by . If voltage magnitudes are calculated, then calculation of the busses included in the bounded network is enough. 3- Calculate the reactive power transfer between the
busses, . This power includes the increment due to the change in bus voltage phase angles.
4- Minimize the reactive power mismatches of busses i and j. This process is mathematically equivalent to the following constrained optimization problem;
Where || || is Euclidean norm of the vector. Equation (11) is linear reactive power equation for load busses, is reactive power mismatch equation, is bus voltage magnitude vector. With b subscript the bounded region in which optimization process is performed, is presented.
III. PARTICLE SWARM OPTIMIZATION
Particle swarm optimization, which was firstly introduced by Kennedy and Eberhart in 1995 [7], is a technique that can be used in optimization problems. Like other evolutionary computation techniques, this heuristic approach is a form of evolutionary computation and is biologically inspired. A general evolutionary computing process usually has the following steps:
1- Initialize a random population for creating potential solutions.
2- Calculate the fitness of each member of the population. 3- Use probabilistic methods to select members of the
population for reproduction.
4- Perform evolutionary operations such as crossover, mutation, etc.
5- Repeat the above procedure.
Keeping in mind that the steps outlined above, a new evolutionary strategy based on the behaviors of flocking birds and schooling fish, form the particle swarm methodology.
In particle swarm optimization, population is called swarm and each individual in the swarm is called particle. A particle i, in iteration k has two attributes; position and velocity.
A particle swarm optimization algorithm can be summarized as follows:
1- Create an initial swarm randomly. A swarm size can vary from 15 to 30.
where and are vectors of upper and lower limit values respectively.
2- Create initial velocity vector randomly. It should be stated that, if a user specified value is exceeded, this value should be used instead of velocity value.
3- Evaluate the fitness of each particle and store, particle best ever position as and best position in current swarm as .
4- Update the velocity and position vectors according to the equations (14) and (15) respectively in each iteration.
where and are constants, w is inertia factor, rand is a random number between 0 and 1. Some researchers have found that out that setting and equal to 2 gets the best overall performance, but can vary from 1.5 to 2 and can vary from 2 to 2.5. Inertia factor can vary from 0.4 and 1.4.
5- If maximum change in best particle is smaller than a specified tolerance value or maximum number of iterations is reached, terminate, otherwise go to step 3. IV. PROPOSED PARTICLE SWARM OPTIMIZATION ALGORITHM
The proposed particle swarm optimization algorithm for solving the optimization problem in line outage simulation outlined above, can be summarized as follows:
1- Run a power flow to obtain load bus voltage magnitudes in the bounded region for using as initial values in initial particles in the swarm.
2- By creating random values, form matrix, and solve the equation below:
3- Update V voltage magnitudes, using the values obtained by equation (11).
4- Create initial velocities using equation (13). Set a maximum velocity value, . Use this value as velocity if it is exceeded.
5- Evaluate the function to be minimized shown in equation (11). By using equations (4-8), and making appropriate operations, Euclidean norm of this function can be represented as shown below:
ij P k x T ij Q~ 0 Δ Δ − = = + + − − + + − b b b B V Q V g ( ) ) ( ) ( b Dj Li T ij j Di Li T ij i Q wrt to Subject Q Q Q Q Q Q Q Q Minimize si ) 11 ( Q Δ V
)
(
max min min 0x
rand
x
x
x
i=
+
−
) 12 ( minx
x
max t x x rand x vi Δ − += min ( max min) 0 ) 13 ( g p p
t
v
x
x
i k i k i k+1=
+
+1Δ
) 14 ( si Q ΔQ( )
B
bΔ
Q
b=
Δ
V
b −1 (16) max V 2 2 ) ( ) ( T Li ij sj Li T ij si Q Q Q Q Q Q − − + + − maxV
) 15 ( ) 17 ( t x p rand c t x p rand c wv v i k g k i k i i k i k+ = + Δ− + Δ− ) ( ) ( 2 1 1 1 c c2 1 c c2 1 c 2 cPenalty functions shown below are added to limit voltage magnitudes in a specified interval. These penalty functions are added in evaluation of the function to be minimized if voltage magnitudes are out of the specified interval, between and .
Where V is the voltage magnitude of the bus, and are user specified voltage limits, and and are penalty constants.
6- Find the particle that has best ever position and store it as and find the best position in current swarm and store it as .
7- Update the velocity and position vectors according to the equations (14) and (15) respectively in each iteration.
8- If maximum change in best particle is smaller than a specified tolerance value or maximum number of iterations is reached, terminate, otherwise go to step 5.
V. TEST RESULTS
The proposed solution procedure is tested on IEEE 14 Bus, IEEE 30 Bus, and IEEE 57 Bus test systems. Outages of lines connected between busses 7 and 9 for 14 bus test system, between busses 4 and 6 for 30 bus system and between busses 41 and 42 for 57 bus system are simulated by using the proposed algorithm. Load bus voltage magnitudes in the bounded region, determined from the proposed method are illustrated in the following tables together with the values calculated from a full AC load flow and associated errors:
TABLE I
IEEE14BUSTESTCASE(OUTAGE OF BRANCH 7-9)
BUS NO LF PF ERR(%) 4 1.0169375 1.017561 -0.061371 7 1.0670541 1.059437 0.713762 9 1.0291151 1.058926 -2.896760 10 1.0281821 1.053064 -2.420004 14 1.0178973 1.037215 -1.897814 TABLE II
IEEE30 BUS TEST CASE (OUTAGE OF BRANCH 4-6)
BUS NO LF PF ERR(%) 3 0.994372 0.979739 1.471521 4 0.993594 0.975979 1.772839 6 0.960037 0.976323 -1.696408 7 0.956767 0.969239 -1.303521 8 0.947536 0.963707 -1.706650 9 0.974175 0.981450 -0.746798 10 0.981596 0.984693 -0.315514 28 0.963059 0.984893 -2.267150 TABLE III
IEEE57 BUS TEST CASE (OUTAGE OF BRANCH 41-42)
BUS NO LF PF ERR(%) 11 0.974981 0.976546 -0.160575 41 1.004161 1.019989 -1.576217 42 0.899635 0.904800 -0.574095 43 1.012586 1.017886 -0.523405 56 0.933884 0.954319 -2.188209 In the tables LF represents bus voltage magnitudes calculated using AC load flow, PF represents bus voltage magnitudes calculated using the proposed solution method. ERR represents the error in percentage and can be given as follows:
Maximum error obtained for these 3 different test cases is approximately %2.897. Only the voltage magnitudes in the bounded region are calculated.
VI. CONCLUSION AND FUTURE WORK
The simulation method used in this paper is advantageous compared with the full ac load flow computation, because one doesn’t have to deal with the whole system and its equivalent Jacobian matrix during the computation, but has to take into consideration of the branches in the bounded region of the system and the associated sub-Jacobian matrix of the system only.
Optimization problem in an existing line outage model is solved using particle swarm optimization. Some outage examples using IEEE 14 Bus, IEEE 30 Bus and IEEE 57 Bus test systems are given and compared with full ac load flow solutions.
In future solution of the minimization problem by simulated annealing method will be performed. In an electricity management center, because of the dynamic nature of the electrical power systems, line outage simulations should be performed in real time, thus to speed up the solution parallel solution of these two methods using parallel Matlab is planned. These solutions will be performed on bigger test systems to see the performance improvement efficiently.
REFERENCES
[1] A. J. Wood, and B. F. Wollenberg, Power Generation, Operation and
Control, 2nd ed. New York: Wiley, pp. 410-450, 1996
[2] A. Ozdemir, Y. J. Lim, and C. Singh, “Branch Outage Simulation for MVAR flows: Bounded Network Solution”, IEEE Trans. Power Syst, Vol 18, Nov. 2003, pp. 1523-1528, 2003.
[3] R. Zimmerman and D. Gan, Matpower Manual, USA: PSERC Cornell Univ., 1997.
[4] R. K. Pancholi and K. S. Swarup, “Particle Swarm Optimization for Security Constrained Economic Dispatch” Proceedings of International Conference on Intelligent Sensing and Information Processing 2004, pp. 7-13.
[5] S. Naka, T. Genji, T. Yura, and Y. Fukuyoma, “A Hybrid Particle Swarm Optimization for Distribution State Estimation” IEEE Trans.
Power Syst., vol. 18 pp. 60-69, Feb. 2003.
2 max 1(V V ) k − max V Vmin 2 min 2(V V ) k − ) 18 ( ) 19 ( p g p LF PF LF ERR=100* − (20) max V min V k1 k2
[6] M. A. Abido, “Optimal power flow using particle swarm optimization”,
International Journal of Electrical Power and Energy Systems, Vol. 24,
No. 7, October 2002, pp. 563-571.
[7] J. Kennedy, and R. C. Eberhart. “Particle Swarm Optimization”, Proceedings of IEEE International Conference on Neural Networks, Piscataway, NJ, IEEE service center, pp. 1942-1948, 1995.