Full Terms & Conditions of access and use can be found at
https://www.tandfonline.com/action/journalInformation?journalCode=rejf20
The European Journal of Finance
ISSN: (Print) (Online) Journal homepage: https://www.tandfonline.com/loi/rejf20
Financial inclusion and bank stability: evidence
from Europe
Gamze Ozturk Danisman & Amine Tarazi
To cite this article: Gamze Ozturk Danisman & Amine Tarazi (2020): Financial inclusion and bank stability: evidence from Europe, The European Journal of Finance, DOI: 10.1080/1351847X.2020.1782958
To link to this article: https://doi.org/10.1080/1351847X.2020.1782958
Published online: 26 Jun 2020.
Submit your article to this journal
Article views: 131
View related articles
https://doi.org/10.1080/1351847X.2020.1782958
Financial inclusion and bank stability: evidence from Europe
Gamze Ozturk Danisman aand Amine Tarazi b,c
aFaculty of Management, Kadir Has University, Istanbul, Turkey;bLAPE, Université de Limoges Limoges Cedex, France;cInstitut Universitaire de France (IUF), Paris, France
ABSTRACT
The Great Recession of 2007–2009 piqued the interest of policymakers worldwide, prompting various initiatives to stabilize the financial system and advance financial inclusion. However, few studies have considered their interconnectedness or whether any synergies or trade-offs exist between them. This paper investigates how financial inclusion affects the stability of the European banking system. The findings indicate that advancements in financial inclusion through more account ownership and digi-tal payments have a stabilizing effect on the banking industry. A deeper investigation shows that such a stabilizing impact is mainly driven by the targeting of disadvantaged adults who are young, undereducated, unemployed, and who live in rural areas. Hence, along with its known benefits to society as a whole, financial inclusion has the addi-tional benefit of improving the stability of the financial system. Such findings call for policy configurations that are specifically designed to achieve financial inclusion for disadvantaged individuals.
ARTICLE HISTORY
Received 6 February 2019 Accepted 9 June 2020
KEYWORDS
Financial Inclusion; Bank Stability; Account
Ownership; Digital Payments; Disadvantaged Adults
JEL CLASSIFICATIONS
G28; G21; G01
1. Introduction
After the Great Recession of 2008–2009, financial stability attracted considerable attention and sparkled as a top priority. Sub-prime credit problems originated in the U.S. and spread around the world, particularly to Europe (Anand, Kirman, and Marsili2013; Casu, Fabbri, and Wilson2014; Eross, Urquhart, and Wolfe2019). Gov-ernment interventions to stabilize the European banking system during the Great Recession reached EUR 1.5 trillion by the end of 2009, representing more than 13% of the European Union (EU)’s GDP (Betz et al.2014). The European sovereign debt crisis that started in 2011 generated further concerns about whether this might lead to yet another systemic crisis. These two crises clearly showed that instability in the financial system had dramatic consequences for the entire European economy (Cotter and Suurlaht2019; Danisman and Demirel
2019; Kapp2012). To induce stability in the financial system, various initiatives were introduced, including the Basel III implementations and the formation of the Financial Stability Board (Casu, Fabbri, and Wilson2014; Cihak, Mare, and Melecky2016). The EU set a legacy goal for reducing the share of non-performing loans (NPL) to support stability in the financial system. The share of NPLs was down to 3.8% by June 2018, but there is still much to achieve in terms of improving them. The rates in other major developed countries were relatively lower (e.g. around 1% in the U.S. and Japan). The European Commission and the European Central Bank offered pro-posals that concentrated on tackling the high stock of NPLs and enhancing stability in the financial system so as to prevent any further problems in the financial sector (European Central Bank2018; European Commission
2018).
The Great Recession also gave rise to an intensified interest in financial inclusion. Financial inclusion refers to the availability and accessibility of different types of financial services to individuals; these include accounts at financial institutions, options for digital payments, and access to credit. Financial inclusion became a top priority
CONTACT Gamze Ozturk Danisman [email protected]
for the World Bank and regulatory officials around the world. Numerous institutions have started implement-ing their own initiatives to promote financial inclusion (e.g. the World Bank 2020 goal of universal financial access, the United Nations Sustainable Development Goals, the Global Partnership for Financial Inclusion and the Maya Declaration) (Cihak, Mare, and Melecky2016; Klapper, El-Zoghbi, and Hess2016). The myriad ben-efits associated with financial inclusion discussed in the literature include increase in efficiency, reduction in costs, increased savings, enhanced potential for borrowing and investing, and improvements in economic wel-fare (Demirguc-Kunt, Klapper, and Singer2017; Karlan, Ratan, and Zinman2014; Sahay et al.2015; Sha’ban, Girardone, and Sarkisyan2019). Motivated by the increasing importance of financial inclusion and financial stability in the EU, this paper investigates the link between financial inclusion and financial stability. It uses a sample of 4,168 banks in 28 EU countries for the years 2010–2017 and employs dynamic panel data estimation techniques with two-step system GMM estimators. We further examine the financial inclusion–stability nexus for groups of people differentiated by gender, education level, age, employment status and place of residence to observe whether the relationship differs in terms of these important attributes.
Financial stability and financial inclusion have typically been considered separately in the literature, and the link between them is largely ignored. However, it is important to consider whether more financial inclusion promotes or deteriorates stability in the financial system, and any policy implementation needs to consider their interconnectedness (Cihak, Mare, and Melecky2016) and possible trade-offs. For instance, on the one hand, financial expansion by way of extending bank credits to more individuals and businesses may deteriorate the quality of loan portfolios and undermine the stability of the banking system in cases where banking supervision is weak (Khan2011; Sahay et al.2015). On the other hand, financial inclusion may foster stability in the banking system through the diversification of risks by lending to more individuals and businesses (Khan2011; Morgan and Pontines2014). Ignoring the interplay between financial inclusion and stability may lead to financial exclu-sion and systemic crises (Cihak, Mare, and Melecky2016). Morgan and Pontines (2014) point out the need for bolstering the empirical evidence on the link between financial inclusion and stability. Demirguc-Kunt, Klap-per, and Singer (2017) emphasize the need to improve our understanding of the benefits of financial inclusion and state that customizing financial products and services is essential. New empirical evidence is needed, both on whether more financial inclusion leads to stability in the financial system and on the potential benefits of targeting certain segments of society for financial inclusion.
Focusing on the EU is of importance because it allows to uncover the possible relationship between financial inclusion and financial stability in the presence of a mature banking industry. Moreover, even though finan-cial exclusion is generally seen as a developing country issue, according to the 2017 World Bank Global Findex database, 9% of adults in Europe are unbanked, that is, they do not even have a bank account. At first glance, 9% may appear to be a low share, but it represents a total of 37 million unbanked individuals. Furthermore, there are wide gaps between different segments of society. Existing research clearly shows that much remains to be done in the EU countries in terms of promoting financial inclusion, especially for disadvantaged adults (Deku, Kara, and Molyneux2016). For instance, in terms of the share of digital payments, the rate in EU countries in 2017 was 87% (which translates into 56 million people not using digital payments); the ratio is lower for dis-advantaged groups also, with 78% for unemployed adults (i.e. not in the labor force) and 72% for young adults. In our empirical investigation, we consider as proxies of financial inclusion, account ownership which is a stan-dard metric, and the use of digital payments, which also enables us to capture what remains to be improved in terms of financial technology (fintech) inclusion in Europe. As the EU, like many countries in the world, strug-gle with sluggish economic growth and uncertain prospects after the COVID-19 pandemic, inclusive financial technology through fintech is suggested as a solution that would help to improve the economic prospects (Fu and Mishra2020; World Bank2019).
The contribution of the paper to the literature is threefold. First, drawing on recent cross-country and time-series data on financial inclusion from the World Bank’s Global Findex database, we contribute to the currently limited literature on financial inclusion and financial stability and shed light onto this relationship from differ-ent angles by examining various types of risk to which banks are exposed (e.g. default risk, leverage risk and portfolio risk). We employ unique measures of financial inclusion such as account ownership and the practice of making and receiving payments digitally, whereas the literature generally uses credit risk for financial stability and credit expansion for financial inclusion, respectively (Cihak, Mare, and Melecky2016; Sahay et al.2015).
Second, individuals are disaggregated according to gender, education level, age, employment status, and place of residence (urban vs rural), enabling us to offer more direct policy implications in terms of which groups should be targeted. Finally, we add to the recent contributions in the literature (Ahamed and Mallick2019; Sahay et al.
2015) in showing that financial inclusion—in addition to benefitting the society as a whole (Demirguc-Kunt, Klapper, and Singer2017; Karlan, Ratan, and Zinman2014)—has a further benefit: stabilizing the financial sys-tem. Our findings reveal a positive relationship between financial inclusion and financial stability in the context of EU countries, and the positive link is even stronger for disadvantaged adults. The analysis shows that there is still much to achieve in terms of financial inclusion in the EU and that stability can be induced in the financial system, especially when the focus is on disadvantaged groups.
The remainder of the paper is structured as follows. Section2introduces the theoretical framework and relates our work to the literature on financial inclusion and financial stability. Section3presents the data and methodology, followed by Section4, which documents the results. Finally, Section5concludes and draws policy implications.
2. Related literature and research focus
Studies that explore the link between financial inclusion and financial stability are few, mainly because of the lack of time-series financial inclusion data. However, thanks to the IMF Financial Access Survey and the World Bank’s Global Findex database, the historical information on financial inclusion has recently been available. Another reason for the paucity of studies is that policies aimed at financial inclusion are relatively new; in many countries, they started gaining attention only after the Great Recession, so their long-term impacts are not yet clear (Demirguc-Kunt, Klapper, and Singer2017; Sahay et al.2015).
Financial inclusion can potentially exert a negative impact on financial stability. The negative externalities result primarily from the extension of credit to individuals without proper supervision. An increase in the num-ber of borrowers may deteriorate standards in lending and lead to a decrease in the quality of loan portfolios. Cihak, Mare, and Melecky (2016) find that, while enhancing financial inclusion contributes to increased stability in countries where procedures are properly supervised, it deteriorates stability in weakly supervised ones. How-ever, the findings are mixed when they use measures of financial inclusion other than credit expansion, e.g. the share of adults with access to accounts. Sahay et al. (2015) highlight the importance of a strong supervisory sys-tem in the case of credit expansions. They also highlight that other features of financial inclusion such as access to accounts, digital payments and diversification through more deposits should be encouraged, especially for low-income groups, stating that these have no negative consequences for financial stability. De la Torre, Feyen, and Ize (2013) point out that, if a rise in financial inclusion is coupled with weak supervision, it will have nega-tive outcomes on the stability of the system, especially in times of crisis. Another potential factor, cited by Khan (2011), is that, in order to reach smaller investors, banks may need to outsource some functions, which may harm their brand and raise the reputational risk.
Despite potential negative effects, however, most of the research points to the positive impacts of financial inclusion on the stability of the financial system. Three main explanations are proposed in the literature. First of all, when banks extend credit to SMEs or individual borrowers, they derive diversification benefits and experience a reduction in the volatility of their loan portfolios through a reduction in the relative size of a single borrower and its interconnectedness risk. In a study on Chilean banks, Adasme, Majnoni, and Uribe (2006) found that increasing financial inclusion by granting loans to SMEs decreases the risk level of bank loan portfolios which is because their NPL distributions are quasi-normal, making large losses a major concern. Morgan and Pontines (2014), using macro-level cross-country data, found that an increase in SME lending improves financial stability through reduced NPLs and a decrease in default risk.
Moreover, an increase in the number of small savers diminishes banks’ reliance on more volatile wholesale financing. Therefore, the stability of the industry improves by a decrease in pro-cyclicality risk. Hannig and Jansen (2010) state that when lower-income adults, who are more prone to economic problems than the general popu-lation, start participating in the financial industry, the industry becomes more resilient to economic cycles. They further suggest that financial institutions that serve lower-income groups can foster the local economy and are in a better position to handle economic crises. Han and Melecky (2013) find that achieving a higher level of bank
deposits through more financial inclusion helps stabilize the financial system owing to an increase in the share of stable funding, a reduction in the pro-cyclical risk of banks, and a decrease in the volatility of total bank assets during economic slowdowns. Specifically, they find that a 10% increase in deposits leads to a reduction of 4 per-centage points in large withdrawals of funds in periods of distress. Having examined 130 countries, Mehrotra and Yetman (2014) reveal that the volatility of consumption is lower for countries where the level of financial inclusion is higher. They further suggest an indirect positive link between financial inclusion and stability in that better risk management through more financial inclusion indirectly increases the stability of financial insti-tutions. Bachas et al. (2017) state that debit card usage encourages adults to monitor their accounts regularly, leading to an improvement in savings and enhanced trust in the financial system.
Finally, the share of individuals who are outside the formal financial system is decreased through more financial inclusion, which yields more effective implementation of monetary policy and induces stability in the financial system. Employment rises when financial institutions extend credit to SMEs, which are generally more labor-intensive. Prasad (2010) states that savings reduce reliance on foreign countries, promote the financing of local investments and improves stability. Another potential explanation is that financial inclusion benefits indi-viduals in the case of financial emergencies and helps them manage their financial risks, which in turn fosters financial stability (Demirguc-Kunt, Klapper, and Singer2017; Karlan, Ratan, and Zinman2014). Specifically, by shifting from cash transactions to digital transfers, individuals create a payment history that can be analyzed when they apply for credit. Lack of credit history can hinder their ability to access credit and payment history can be used as an alternative source of information for assessing credit risk. Lower-income adults, minority communities, young adults, and the elderly are the ones who would benefit from payment histories the most. In the present study, we expect findings that are consistent with the view that financial inclusion, in addition to its many benefits for society, improves the stability of the financial system.
Motivated from these findings in the literature, we go further and deeper in our investigation and expect the contribution of financial inclusion to financial stability to be higher when the targeted population is composed of disadvantaged individuals whose access to credit is made possible by easier and effective screening through pay-ment history. The contribution to stability is also expected to be higher when information is acquired by banks through such channels for individuals who are de facto more difficult to screen because they are for example either very young or live in remote areas, and etc. . . Beyond, the beneficial effect achieved through broader portfolio diversification, as highlighted in the literature, we hence consider how better information processing by banks through account ownership and/or digital payments offered to the part of the ‘excluded’ population which is ex-ante the most difficult to screen could also possibly play a role in improving stability. Taking advan-tage of the Global Findex database providing information on survey respondent’s individual characteristics, we focus on the financial inclusion of disadvantaged adults by considering the differences in gender, age, education level, employment and place of residence (rural versus urban areas).
3. Data and methodology
3.1. Data and variables
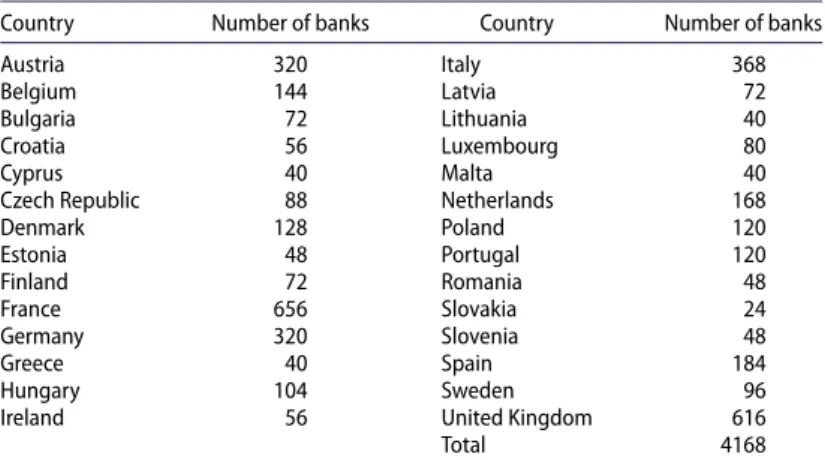
Our main source of bank-specific data is the Fitch Connect database from Fitch Solutions. We use a sample of 4,168 banks in 28 EU countries for the 2010–2017 period. The countries and the corresponding banks are displayed in Table1. All data is expressed in US dollars. In the final sample, only banks with consolidated state-ments are included in the analysis and the bank-specific variables are winsorized by the top and bottom 1% of their distribution.
The financial inclusion data is taken from the Global Findex database, which was launched by the World Bank in 2011. It is a unique and exhaustive database that draws on surveys that explore individuals’ access to financial services and how they borrow, save, and make or receive payments. It covers more than 140 countries in various parts of the world. The database has available data for the years 2011, 2014 and 2017. The data for the remaining years is generated by linear interpolation which takes into account the fact that financial inclusion changes gradu-ally and has the benefit of producing a smooth value-generating process by avoiding any jumps (Bartram, Brown, and Hund2007).1We use two financial inclusion variables from the database: account ownership (ACCOUNT)
Table 1.List of countries and number of banks.
Country Number of banks Country Number of banks
Austria 320 Italy 368
Belgium 144 Latvia 72
Bulgaria 72 Lithuania 40
Croatia 56 Luxembourg 80
Cyprus 40 Malta 40
Czech Republic 88 Netherlands 168
Denmark 128 Poland 120 Estonia 48 Portugal 120 Finland 72 Romania 48 France 656 Slovakia 24 Germany 320 Slovenia 48 Greece 40 Spain 184 Hungary 104 Sweden 96
Ireland 56 United Kingdom 616
Total 4168
Note: This table indicates the list of 28 European countries and the corresponding numbers of banks in our sample.
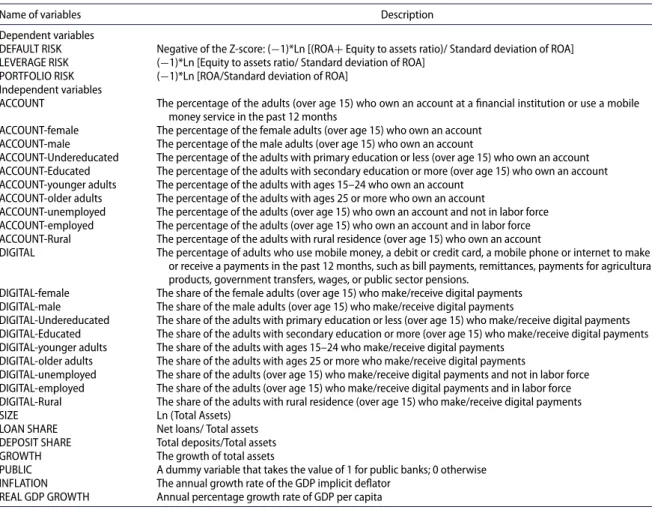
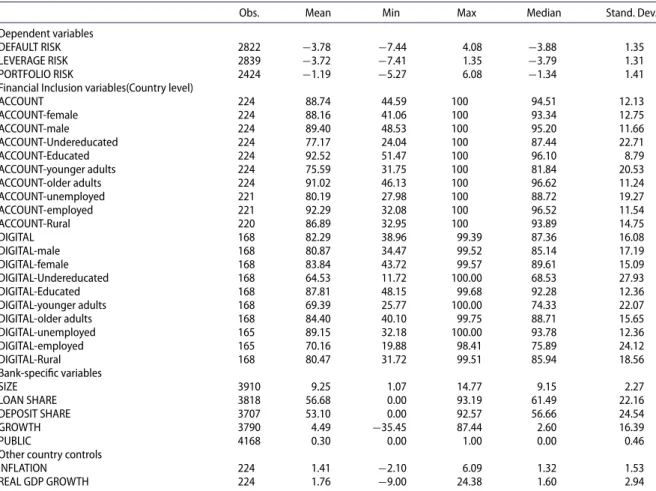
and digital payments (DIGITAL). The explanations for the variables are shown in Table2; the descriptive statis-tics are given in Table3. The Global Findex database also provides information on survey respondent’s individual characteristics such as gender (FEMALE vs. MALE), employment status (UNEMPLOYED vs. EMPLOYED), education (UNDEREDUCATED vs. EDUCATED), age (YOUNGER adults aged 15–24 vs. OLDER adults aged 25 and above) and RURAL residence. Table3shows that account ownership for the EU countries in the sam-ple (for the years 2010–2017) is quite high, at 88.74%, but ownership rates tend to be lower for disadvantaged groups—the unemployed (80.19%), the undereducated (77.17%) and young adults (75.59%). A similar picture emerges for digital payments: the percentage of adults using digital payments in the EU is as high as 82.29%, but it is lower for disadvantaged groups such as the undereducated (64.53%) and younger adults (69.39%).
The indicators for financial stability focus on bank-level data to take into account the essential role of banks in the financial system. We use three measures of bank stability: default risk, leverage risk and portfolio risk. DEFAULT RISK is captured by the Z-score of banks, a popular, well-accepted measure in the banking literature (Houston et al.2010; Laeven and Levine2009). Higher values of the index indicate more stability. It is calculated as:
Zit =
ROAit+ (E/Ait) Sd.(ROA)it
where ROA indicates the return on assets, E/A is the equity-to-asset ratio, and SD. (ROA) is the standard devi-ation of ROA. The SD. (ROA) is calculated using three-year rolling time windows in order to have variability in the denominator. The three-year rolling window method of calculating standard deviation causes a loss of observations on bank risk-taking variables (down to 2,205 bank-year observations in the regressions), but it is a robust way to measure standard deviation. With other methods, if the standard deviation is calculated over the entire sample period, then within bank variations would be determined solely from the variations in the numerator, but not the denominator (Beck, De Jonghe, and Schepens2013). A natural logarithm transforma-tion of the Z-score is used because it is highly skewed, and then multiplied by (−1) so that higher values indicate greater default risk. LEVERAGE RISK and PORTFOLIO RISK are obtained by decomposing the Z-score into two components. While leverage risk is approximated by the equity-to-assets ratio/ SD. (ROA), portfolio risk is obtained from the second component of the Z-score, which is ROA/SD. (ROA) (Barry, Lepetit, and Tarazi2011; Lepetit et al.2008). The leverage and portfolio risk are also transformed using the natural logarithm, and we then multiply these indices by (−1) so that higher values indicate greater risk.
We employ several bank characteristics as control variables which are widely accepted in the literature as determinants of bank risk (Berger et al.2015; Houston et al.2010; Laeven and Levine2009). These are SIZE, measured as the natural logarithm of total assets; LOAN SHARE, calculated as the share of net loans in total assets; DEPOSIT SHARE, calculated as the share of total deposits in total assets; GROWTH, representing the
Table 2.Description of the variables.
Name of variables Description
Dependent variables
DEFAULT RISK Negative of the Z-score: (−1)*Ln [(ROA+ Equity to assets ratio)/ Standard deviation of ROA] LEVERAGE RISK (−1)*Ln [Equity to assets ratio/ Standard deviation of ROA]
PORTFOLIO RISK (−1)*Ln [ROA/Standard deviation of ROA] Independent variables
ACCOUNT The percentage of the adults (over age 15) who own an account at a financial institution or use a mobile money service in the past 12 months
ACCOUNT-female The percentage of the female adults (over age 15) who own an account ACCOUNT-male The percentage of the male adults (over age 15) who own an account
ACCOUNT-Undereducated The percentage of the adults with primary education or less (over age 15) who own an account ACCOUNT-Educated The percentage of the adults with secondary education or more (over age 15) who own an account ACCOUNT-younger adults The percentage of the adults with ages 15–24 who own an account
ACCOUNT-older adults The percentage of the adults with ages 25 or more who own an account
ACCOUNT-unemployed The percentage of the adults (over age 15) who own an account and not in labor force ACCOUNT-employed The percentage of the adults (over age 15) who own an account and in labor force ACCOUNT-Rural The percentage of the adults with rural residence (over age 15) who own an account
DIGITAL The percentage of adults who use mobile money, a debit or credit card, a mobile phone or internet to make or receive a payments in the past 12 months, such as bill payments, remittances, payments for agricultural products, government transfers, wages, or public sector pensions.
DIGITAL-female The share of the female adults (over age 15) who make/receive digital payments DIGITAL-male The share of the male adults (over age 15) who make/receive digital payments
DIGITAL-Undereducated The share of the adults with primary education or less (over age 15) who make/receive digital payments DIGITAL-Educated The share of the adults with secondary education or more (over age 15) who make/receive digital payments DIGITAL-younger adults The share of the adults with ages 15–24 who make/receive digital payments
DIGITAL-older adults The share of the adults with ages 25 or more who make/receive digital payments
DIGITAL-unemployed The share of the adults (over age 15) who make/receive digital payments and not in labor force DIGITAL-employed The share of the adults (over age 15) who make/receive digital payments and in labor force DIGITAL-Rural The share of the adults with rural residence (over age 15) who make/receive digital payments
SIZE Ln (Total Assets)
LOAN SHARE Net loans/ Total assets DEPOSIT SHARE Total deposits/Total assets GROWTH The growth of total assets
PUBLIC A dummy variable that takes the value of 1 for public banks; 0 otherwise INFLATION The annual growth rate of the GDP implicit deflator
REAL GDP GROWTH Annual percentage growth rate of GDP per capita Note: This table displays the list of variables and their brief descriptions.
annual growth of total assets; and PUBLIC, as a dummy variable for publicly listed banks. Size is the only variable in the regression in levels. We, therefore, express it in 2012 US dollars to remove the effect of inflation.
We use two more country-level variables as proxies for the macroeconomic environment—REAL GDP GROWTH and INFLATION.
3.2. Methodology
Because bank risk-taking is persistent over time and to deal with endogeneity concerns, we use dynamic panel data estimation techniques. The current values of our dependent variable, bank risk-taking, are likely to depend on their one-year lagged values which can be accounted for by utilizing dynamic panel data estima-tion techniques (Ahamed and Mallick2019; Moudud-Ul-Huq2019; Soedarmono and Tarazi2016; Yusgiantoro, Soedarmono, and Tarazi2019). Dynamic panel data estimation considers the one-year lagged dependent vari-able as an explanatory varivari-able and further helps to endogenize the rest of the explanatory varivari-ables in the model. The asymptotically efficient two-step system GMM estimators are adopted with standard errors robust to het-eroskedasticity (Arellano and Bover1995; Blundell and Bond1998). The lags of the dependent variables and the regressors are used as instruments in the Arellano Bond estimation (Roodman2009a). While GMM-style instruments are used for the variables that are considered endogenous or predetermined, the strictly exogenous variables are instrumented by themselves. We consider the lagged dependent variables and the bank-specific variables as predetermined and the financial inclusion and macroeconomic variables as strictly exogenous and
Table 3.Descriptive Statistics.
Obs. Mean Min Max Median Stand. Dev.
Dependent variables
DEFAULT RISK 2822 −3.78 −7.44 4.08 −3.88 1.35
LEVERAGE RISK 2839 −3.72 −7.41 1.35 −3.79 1.31
PORTFOLIO RISK 2424 −1.19 −5.27 6.08 −1.34 1.41
Financial Inclusion variables(Country level)
ACCOUNT 224 88.74 44.59 100 94.51 12.13 ACCOUNT-female 224 88.16 41.06 100 93.34 12.75 ACCOUNT-male 224 89.40 48.53 100 95.20 11.66 ACCOUNT-Undereducated 224 77.17 24.04 100 87.44 22.71 ACCOUNT-Educated 224 92.52 51.47 100 96.10 8.79 ACCOUNT-younger adults 224 75.59 31.75 100 81.84 20.53 ACCOUNT-older adults 224 91.02 46.13 100 96.62 11.24 ACCOUNT-unemployed 221 80.19 27.98 100 88.72 19.27 ACCOUNT-employed 221 92.29 32.08 100 96.52 11.54 ACCOUNT-Rural 220 86.89 32.95 100 93.89 14.75 DIGITAL 168 82.29 38.96 99.39 87.36 16.08 DIGITAL-male 168 80.87 34.47 99.52 85.14 17.19 DIGITAL-female 168 83.84 43.72 99.57 89.61 15.09 DIGITAL-Undereducated 168 64.53 11.72 100.00 68.53 27.93 DIGITAL-Educated 168 87.81 48.15 99.68 92.28 12.36 DIGITAL-younger adults 168 69.39 25.77 100.00 74.33 22.07 DIGITAL-older adults 168 84.40 40.10 99.75 88.71 15.65 DIGITAL-unemployed 165 89.15 32.18 100.00 93.78 12.36 DIGITAL-employed 165 70.16 19.88 98.41 75.89 24.12 DIGITAL-Rural 168 80.47 31.72 99.51 85.94 18.56 Bank-specific variables SIZE 3910 9.25 1.07 14.77 9.15 2.27 LOAN SHARE 3818 56.68 0.00 93.19 61.49 22.16 DEPOSIT SHARE 3707 53.10 0.00 92.57 56.66 24.54 GROWTH 3790 4.49 −35.45 87.44 2.60 16.39 PUBLIC 4168 0.30 0.00 1.00 0.00 0.46
Other country controls
INFLATION 224 1.41 −2.10 6.09 1.32 1.53
REAL GDP GROWTH 224 1.76 −9.00 24.38 1.60 2.94
Note: The table shows summary statistics for the variables.
instrumented by themselves (Roodman2009b). For a reliable GMM estimation, the validity of the instruments is crucial, so specification tests are performed to validate the estimation. These include Arellano-Bond AR(1) and AR(2) tests for the first and second-order autocorrelation of the residuals and the Sargan test of overidenti-fying restrictions. The GMM-style instruments commonly result in an instrument proliferation problem which leads to an over-fitting of the endogenous variables. As stated by Roodman (2009b), the most common cause is using the deeper lags of GMM-style instruments. We eliminate this problem by using only the second lags of GMM-style instruments which result in a lower number of instruments as compared to the number of total observations. Furthermore, we use orthogonal transformations of instruments to account for the possible cross-sectional fixed effects and include Windmeijer’s (2005) finite sample correction (Bouvatier and Lepetit2012; Soedarmono, Pramono, and Tarazi2017). The estimated model is provided below:
Bank riskijt= α Bank riskijt−1+ β ∗ Fin. Incjt−1+ γ ∗ Xijt−1+ δ ∗ Yjt−1+ μj+ θt+ εijt
where bank, country and time are denoted by the subscripts i, j and t, respectively. All independent variables are one-period lagged to prevent the possible impact of reverse causality. Bank risk stands for the three bank risk-taking variables and Fin. Inc. corresponds to the two financial inclusion variables used in our analysis. X is a vector of bank-specific and Y is a vector of country-specific variables. Whileμjstands for unobserved country-fixed effects (dummy variables for each country),θtcorresponds to time-fixed effects (dummy variables for each year) andεijtrepresents the error terms.
Table 4.Financial inclusion and bank risk-taking relationship.
(1) Default Risk (2) Default Risk (3) Leverage Risk (4) Leverage Risk (5) Portfolio Risk (6) Portfolio Risk
L.ACCOUNT −0.015*** −0.018*** −0.007** (0.00) −0.004 −0.003 L.DIGITAL −0.012*** −0.015*** −0.008*** (0.00) (0.00) (0.00) L.SIZE 0.078** 0.091* 0.115** 0.126** 0.006 0.014 (0.05) (0.05) (0.06) (0.06) (0.06) (0.06) L.LOAN SHARE −0.004 −0.004 −0.003 −0.003 0.003 0.003 (0.01) (0.01) (0.01) (0.01) (0.01) (0.01) L.DEPOSIT SHARE −0.009** −0.009** −0.010* −0.010* −0.004 −0.003 (0.01) (0.01) (0.01) (0.01) (0.01) (0.01) L.GROWTH 0.009** 0.009* 0.011** 0.011** 0.002 0.002 (0.01) (0.01) (0.00) (0.00) (0.01) (0.01) L.PUBLIC −0.198 −0.266 −0.455 −0.548 0 −0.014 (0.42) (0.42) (0.39) (0.40) (0.10) (0.10) L.INFLATION 0.046 0.067 0.041 0.070* 0.023 0.032 (0.04) (0.04) (0.04) (0.04) (0.05) (0.05) L.REAL GDP GROWTH −0.02** −0.019** −0.017** −0.014 −0.040* −0.042* (0.01) (0.01) (0.01) (0.01) (0.02) (0.02) L.DEFAULT RISK 0.805*** 0.801*** (0.07) −0.072 L.LEVERAGE RISK 0.710*** 0.707*** (0.06) (0.06) L.PORTFOLIO RISK 0.702*** 0.699*** (0.06) (0.06) CONSTANT 0 0.091 −0.397 −0.181 0.186 0.085 (0.00) (0.56) (1.30) (0.59) (0.86) (0.80) Observations 2205 2205 2226 2226 1760 1760 Number of Banks 481 481 481 481 444 444 Number of instruments 54 54 54 54 51 51
Country Fixed Effects Yes Yes Yes Yes Yes Yes
Year Fixed Effects Yes Yes Yes Yes Yes Yes
AR1p-value 0.00 0.00 0.00 0.00 0.00 0.00
AR2p-value 0.17 0.16 0.97 0.96 0.22 0.208
Sarganp-value 0.115 0.148 0.068 0.104 0.217 0.203
Note: This table displays the findings of financial inclusion and bank risk-taking relationship. The regressions are estimated using dynamic panel data techniques with two-step system GMM estimators. Country and year dummies are included in the models. Robust standard errors in parentheses. *p < 0.10, ** p < 0.05,*** p < 0.010
4. Results
Table4reports the results of our baseline regressions. Columns 1 and 2 display the findings of the baseline regressions using default risk as the dependent variable. The financial inclusion variable of interest is account ownership in Column 1, and digital payments in Column 2. The negative and significant coefficients of the variables ACCOUNT and DIGITAL in Columns 1 and 2 indicate that an increase in financial inclusion through more accounts and digital payments leads to a significant reduction in bank default risk. Obtained coefficients are statistically significant at 1%. Thus, both types of financial inclusion increase the stability of the EU financial system. The results are both statistically and economically significant in that a 1% increase in account ownership leads to a reduction of 1.50% in bank default risk. Column 2 shows that a 1% increase in digital payments results in a 1.2% decrease in bank default risk. The diagnostic tests (the Sargan test and Arellano Bond AR(1) and AR(2) tests) presented at the bottom of Table4confirm the validity of the two-step system GMM dynamic model. Specifically, by the use of GMM estimators, we aim to control for any persistence in bank default risk through time and, therefore, the first lag of the dependent variable is included in the model. The significant AR(1) statistic justifies that there is a first-order serial correlation. The insignificant statistic value for AR(2) indicates that there is no second-order serial correlation. The Sargan test statistic, being insignificant, supports the validity of utilized instruments. The coefficient of the lagged bank default risk is positive and significant implying that default risk at any year increases next year’s default risk (persistence effect).
THE EUROPEAN JOURNAL OF FINANCE 9 (1) (2) (3) (4) (5) (6) (7) (8) (9)
Female Male Undereducated Educated Younger Adults Older Adults Unemployed Employed Rural
L.ACCOUNT −0.012*** −0.017*** −0.006*** −0.017 −0.04*** −0.017 −0.001** 0.002 −0.002** (0.00) (0.00) (0.00) (0.01) (0.00) (0.00) (0.00) (0.00) (0.00) L.SIZE 0.119** 0.123** 0.114** 0.115** 0.108* 0.123** 0.08 0.069 0.097* (0.06) (0.05) (0.06) (0.06) (0.06) (0.05) (0.05) (0.05) (0.05) L.LOAN SHARE −0.006 −0.006 −0.006 −0.006 −0.006 −0.006 −0.007 −0.007 −0.007 (0.01) (0.01) (0.01) (0.01) (0.01) (0.01) (0.01) (0.01) (0.01) L.DEPOSIT SHARE −0.005 −0.006 −0.005 −0.005 −0.005 −0.006 −0.007 −0.007 −0.003 (0.01) (0.01) (0.01) (0.01) (0.01) (0.01) (0.01) (0.01) (0.01) L.GROWTH 0.008** 0.009** 0.009** 0.009** 0.008** 0.009** 0.008** 0.008** 0.008** (0.00) (0.00) (0.00) (0.00) (0.00) (0.00) (0.00) (0.00) (0.00) L.PUBLIC −0.159 −0.14 −0.083 −0.17 −0.111 −0.165 −0.151 −0.134 0.007 (0.42) (0.42) (0.42) (0.42) (0.42) (0.41) (0.42) (0.42) (0.43) L.INFLATION 0.002 −0.004 0.002 −0.002 0.01 −0.004 −0.005 −0.002 −0.005 (0.02) (0.02) (0.02) (0.02) (0.02) (0.02) (0.02) (0.02) (0.02) L.REAL GDP GROWTH −0.019*** −0.023** −0.024* −0.02** −0.017* −0.022* −0.015 −0.014** −0.021** (0.01) (0.01) (0.01) (0.01) (0.01) (0.01) (0.01) (0.01) (0.01) L. DEFAULT RISK 0.814*** 0.797*** 0.825*** 0.816*** 0.834*** 0.797*** 0.837*** 0.848*** 0.845*** (0.07) (0.07) (0.07) (0.07) (0.07) (0.07) (0.07) (0.07) (0.07) CONSTANT −0.232 0.266 −0.712 0.464 −0.779 0.264 −0.615 −0.708 −0.845 (0.60) (0.64) (0.58) (0.75) (0.59) (0.65) (0.64) (0.67) (0.59) Observations 2205 2205 2205 2205 2205 2205 2184 2184 2205 Number of Banks 481 481 481 481 481 481 481 481 481 Number of instruments 50 50 50 50 50 50 50 50 50
Country Fixed Effects Yes Yes Yes Yes Yes Yes Yes Yes Yes
Year Fixed Effects Yes Yes Yes Yes Yes Yes Yes Yes Yes
AR1p-value 0.00 0.00 0.00 0.00 0.00 0.00 0.00 0.00 0.00
AR2p-value 1.79 1.78 1.82 1.76 1.82 1.77 2.03 2.05 1.8
Sarganp-value 0.302 0.316 0.288 0.289 0.292 0.311 0.12 0.112 0.194
Note: This table displays the findings of account ownership and bank risk-taking relationship, with a breakdown into individual characteristics in the columns. We use default risk as dependent variable in all regressions. Robust standard errors in parentheses. *p < 0.10, ** p < 0.05,*** p < 0.010
G. O. DANISMAN AND A. TARAZI
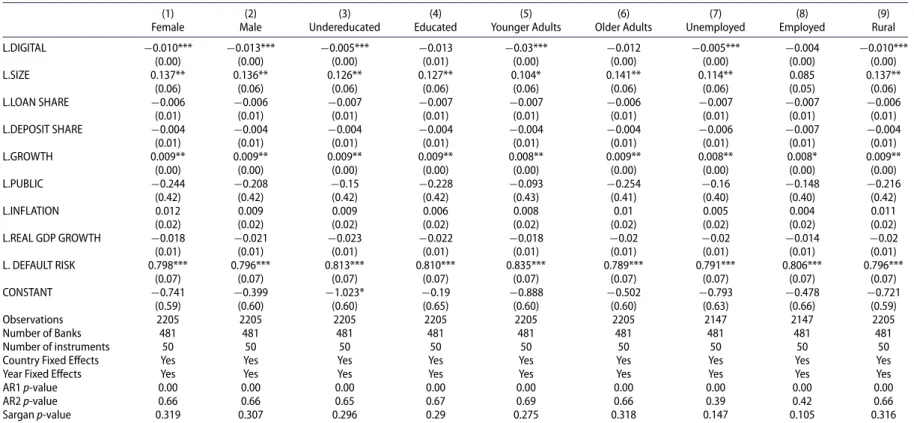
Table 6.Digital payments and bank risk-taking relationship: Breakdown into individual characteristics.
(1) (2) (3) (4) (5) (6) (7) (8) (9)
Female Male Undereducated Educated Younger Adults Older Adults Unemployed Employed Rural
L.DIGITAL −0.010*** −0.013*** −0.005*** −0.013 −0.03*** −0.012 −0.005*** −0.004 −0.010*** (0.00) (0.00) (0.00) (0.01) (0.00) (0.00) (0.00) (0.00) (0.00) L.SIZE 0.137** 0.136** 0.126** 0.127** 0.104* 0.141** 0.114** 0.085 0.137** (0.06) (0.06) (0.06) (0.06) (0.06) (0.06) (0.06) (0.05) (0.06) L.LOAN SHARE −0.006 −0.006 −0.007 −0.007 −0.007 −0.006 −0.007 −0.007 −0.006 (0.01) (0.01) (0.01) (0.01) (0.01) (0.01) (0.01) (0.01) (0.01) L.DEPOSIT SHARE −0.004 −0.004 −0.004 −0.004 −0.004 −0.004 −0.006 −0.007 −0.004 (0.01) (0.01) (0.01) (0.01) (0.01) (0.01) (0.01) (0.01) (0.01) L.GROWTH 0.009** 0.009** 0.009** 0.009** 0.008** 0.009** 0.008** 0.008* 0.009** (0.00) (0.00) (0.00) (0.00) (0.00) (0.00) (0.00) (0.00) (0.00) L.PUBLIC −0.244 −0.208 −0.15 −0.228 −0.093 −0.254 −0.16 −0.148 −0.216 (0.42) (0.42) (0.42) (0.42) (0.43) (0.41) (0.40) (0.40) (0.42) L.INFLATION 0.012 0.009 0.009 0.006 0.008 0.01 0.005 0.004 0.011 (0.02) (0.02) (0.02) (0.02) (0.02) (0.02) (0.02) (0.02) (0.02) L.REAL GDP GROWTH −0.018 −0.021 −0.023 −0.022 −0.018 −0.02 −0.02 −0.014 −0.02 (0.01) (0.01) (0.01) (0.01) (0.01) (0.01) (0.01) (0.01) (0.01) L. DEFAULT RISK 0.798*** 0.796*** 0.813*** 0.810*** 0.835*** 0.789*** 0.791*** 0.806*** 0.796*** (0.07) (0.07) (0.07) (0.07) (0.07) (0.07) (0.07) (0.07) (0.07) CONSTANT −0.741 −0.399 −1.023* −0.19 −0.888 −0.502 −0.793 −0.478 −0.721 (0.59) (0.60) (0.60) (0.65) (0.60) (0.60) (0.63) (0.66) (0.59) Observations 2205 2205 2205 2205 2205 2205 2147 2147 2205 Number of Banks 481 481 481 481 481 481 481 481 481 Number of instruments 50 50 50 50 50 50 50 50 50
Country Fixed Effects Yes Yes Yes Yes Yes Yes Yes Yes Yes
Year Fixed Effects Yes Yes Yes Yes Yes Yes Yes Yes Yes
AR1p-value 0.00 0.00 0.00 0.00 0.00 0.00 0.00 0.00 0.00
AR2p-value 0.66 0.66 0.65 0.67 0.69 0.66 0.39 0.42 0.66
Sarganp-value 0.319 0.307 0.296 0.29 0.275 0.318 0.147 0.105 0.316
Note: This table displays the findings of digital payments and bank risk-taking relationship, with a breakdown into individual characteristics in the columns. We use default risk as dependent variable in all regressions. Robust standard errors in parentheses. *p < 0.10, ** p < 0.05,*** p < 0.010
Our findings are in line with Morgan and Pontines (2014) who find that an increase in SME lending improves financial stability by achieving lower NPLs and default risk. We extend their findings and observe that financial inclusion through more accounts and digital payments decreases the risk of default, leverage risk, and the banks’ portfolio risk. The explanation is that more accounts and digital payments both encourage banks to lend to more individuals and businesses and lead to diversification benefits (Khan2011). There is also an increase in savings with more accounts, which in turn decreases the procyclicality risk in banking (Han and Melecky2013; Hannig and Jansen2010).
The control variables in Columns 1 and 2 that explain bank default risk are size, deposit share, growth, and real GDP growth, with the expected signs While larger and high-growth banks carry more default risk an increase in deposit share and real GDP growth decreases bank default risk. These results are in line with the literature which documents that larger and high growth banks have higher incentives to take risk. Meanwhile, higher deposit share and real GDP growth generate favorable conditions and contribute to diminishing risk (Berger et al.2015; Houston et al.2010; Laeven and Levine2009).
Columns 3–6 in Table4present the robustness checks and display the findings with alternative bank risk mea-sures: leverage risk (Columns 3 &4) and portfolio risk (Columns 5 &6). Our baseline findings remain unchanged with the alternative risk-taking measures. The variables of interest are even of higher significance level and their economic importance is consistent with our previous findings. Specifically, a 1% increase in account ownership leads to a reduction of 1.80% in leverage risk and a 0.7% decrease in portfolio risk. Moreover, a 1% increase in digital payments leads to a reduction of 1.50% in leverage risk and a 0.8% decrease in portfolio risk, respectively. Next, we examine the financial inclusion–stability nexus for groups of people differentiated by gender, edu-cation level, age, employment status and place of residence to determine from which groups of people the stabilizing effect of financial inclusion originates. Therefore, we analyze the link between account ownership and bank risk-taking (see Table5) and the corresponding link between digital payments and bank risk-taking (see Table6) by disaggregating the findings into individual characteristics using bank default risk as the depen-dent variable. These estimations are also performed with dynamic panel data techniques with asymptotically efficient two-step system GMM estimators and standard errors robust to heteroskedasticity. The coefficients of the ACCOUNT variable in Table5and DIGITAL variable in Table6are observed to be negative and significant for both male and female and no significant difference is observed between female and male groups in the rela-tionship between financial inclusion and stability. However, the coefficients of the ACCOUNT variable in Table5
and DIGITAL variable in Table6are negative and statistically significant only for undereducated, younger, and unemployed adults and the ones living in rural areas. Therefore, the stabilizing impact of financial inclusion originates mainly from the following disadvantaged groups: the undereducated with primary education or less, younger adults aged 15-24, the unemployed and individuals residing in rural areas. The diagnostic tests pre-sented at the bottom of Tables5and6confirm the validity of the two-step system GMM estimators. Specifically, the validity of the two-step system GMM estimation is confirmed because both the AR(2) and Sargan test are not significant, revealing that there is no second-order autocorrelation among errors, and overidentifying restric-tions are valid, respectively. Our findings are in line with those of Hannig and Jansen (2010), who suggest that financial institutions become more stable and can better handle economic crises when they address the needs of disadvantaged groups. We observe that the positive influence of financial inclusion on financial stability is higher when the targeted population is the disadvantaged individuals who are more difficult to screen and whose inclu-sion might add more value in terms of information processing by effective screening through account ownership and digital payment history. Therefore, in addition to the portfolio diversification benefits documented in the literature, better information processing through reaching such excluded populations could also be contributing to improvements in financial stability.
5. Conclusion
Drawing on the most recent cross-country and time-series data on financial inclusion from the World Bank Global Findex database, this paper examines the relationship between financial inclusion and financial stability in the context of EU countries. To gain deeper insights on such a relationship, the investigation focuses on detailed characteristics of disadvantaged individuals that are granted access to formal finance in the form of
banking accounts and digital payments (gender, age, education level, employment and place of residence). The study uses a sample of 4,168 banks in the 28 EU countries and deals with endogeneity concerns by using dynamic panel data estimation techniques with two-step system GMM estimators. The findings indicate that, above and beyond its benefits to society, financial inclusion is also beneficial for the stability of the European financial system. Moreover, the positive impact of financial inclusion on financial stability is found to be stronger for disadvantaged adults who are young, undereducated, unemployed, and live in rural areas. Our findings call for more cooperation between regulators in EU countries and supervisory agencies with the goal of increasing financial inclusion, targeting disadvantaged groups in particular.
Even though this paper uses the most recent cross-country data on financial inclusion from the World Bank Global Findex database, it includes only three waves of data, i.e. the years 2011, 2014 and 2017. Although a lack of longitudinal data is common in the financial inclusion literature, such a drawback provides an avenue for future research., In addition, the financial inclusion variable in the study is at country-level and more granu-larity and detailed data at the regional level would also allow to more deeply investigate the role of local banks and close customer-bank relationships in the contribution to stability. Future research could, therefore, exploit longitudinal data on different financial inclusion measures, focus on specific countries or regions and the role played by smaller local banks versus large entities.
Note
1. We would like to thank the anonymous referee for the helpful comments on the method of imputation. Disclosure statement
No potential conflict of interest was reported by the author(s). ORCID
Gamze Ozturk Danisman http://orcid.org/0000-0003-3684-6692
Amine Tarazi http://orcid.org/0000-0001-8385-2994 References
Adasme, Osvaldo, Giovanni Majnoni, and Myriam Uribe.2006. “Access and Risk - Friends or Foes? Lessons from Chile.” WPS4003. The World Bank. http://documents.worldbank.org/curated/en/519511468216004095/Access-and-risk-friends-or-foes-Lessons-from-Chile.
Ahamed, M. Mostak, and Sushanta K. Mallick.2019. “Is Financial Inclusion Good for Bank Stability? International Evidence.”
Journal of Economic Behavior & Organization 157 (January): 403–427.doi:10.1016/j.jebo.2017.07.027.
Anand, Kartik, Alan Kirman, and Matteo Marsili.2013. “Epidemics of Rules, Rational Negligence and Market Crashes.” The
European Journal of Finance 19 (5): 438–447.doi:10.1080/1351847X.2011.601872.
Arellano, Manuel, and Olympia Bover.1995. “Another Look at the Instrumental Variable Estimation of Error-Components Models.”
Journal of Econometrics 68 (1): 29–51.doi:10.1016/0304-4076(94)01642-D.
Bachas, Pierre, Paul Gertler, Sean Higgins, and Enrique Seira.2017. “How Debit Cards Enable the Poor to Save More.” Working Paper 23252. Working Paper Series. National Bureau of Economic Research. doi:10.3386/w23252.
Barry, Thierno Amadou, Laetitia Lepetit, and Amine Tarazi.2011. “Ownership Structure and Risk in Publicly Held and Privately Owned Banks.” Journal of Banking & Finance 35 (5): 1327–1340.doi:10.1016/j.jbankfin.2010.10.004.
Bartram, Söhnke M., Gregory W. Brown, and John E. Hund.2007. “Estimating Systemic Risk in the International Financial System.”
Journal of Financial Economics 86 (3): 835–869.doi:10.1016/j.jfineco.2006.10.001.
Beck, Thorsten, Olivier De Jonghe, and Glenn Schepens.2013. “Bank Competition and Stability: Cross-Country Heterogeneity.”
Journal of Financial Intermediation 22 (2): 218–244.doi:10.1016/j.jfi.2012.07.001.
Berger, Allen N., Sadok El Ghoul, Omrane Guedhami, and Raluca A. Roman.2015. “Internationalization and Bank Risk.” SSRN Scholarly Paper ID 2249048. Rochester, NY: Social Science Research Network. doi:10.2139/ssrn.2249048.
Betz, Frank, Silviu Oprică, Tuomas A. Peltonen, and Peter Sarlin.2014. “Predicting Distress in European Banks.” Journal of Banking
& Finance 45: 225–241.doi:10.1016/j.jbankfin.2013.11.041.
Blundell, Richard, and Stephen Bond.1998. “Initial Conditions and Moment Restrictions in Dynamic Panel Data Models.” Journal
of Econometrics 87 (1): 115–143.doi:10.1016/S0304-4076(98)00009-8.
Bouvatier, Vincent, and Laetitia Lepetit.2012. “Effects of Loan Loss Provisions on Growth in Bank Lending: Some International Comparisons.” International Economics 132 (April): 91–116.doi:10.1016/S2110-7017(13)60059-1.
Casu, Barbara, Daniela Fabbri, and John O. S. Wilson.2014. “Emerging Issues in Financial Institutions and Markets.” The European
Journal of Finance 20 (10): 847–849.doi:10.1080/1351847X.2013.833531.
Cihak, Martin, Davide Salvatore Mare, and Martin Melecky.2016. “The Nexus of Financial Inclusion and Financial Stability: A Study of Trade-Offs and Synergies.” WPS7722. The World Bank.http://documents.worldbank.org/curated/en/138991467994676130/ The-Nexus-of-financial-inclusion-and-financial-stability-a-study-of-trade-offs-and-synergies.
Cotter, John, and Anita Suurlaht.2019. “Spillovers in Risk of Financial Institutions.” The European Journal of Finance 25 (0): 1765–1792.
Danisman, Gamze Ozturk, and Pelin Demirel.2019. “Bank Risk-Taking in Developed Countries: The Influence of Market Power and Bank Regulations.” Journal of International Financial Markets, Institutions and Money 59 (March): 202–217. doi:10.1016/j.intfin.2018.12.007.
Deku, Solomon Y., Alper Kara, and Philip Molyneux.2016. “Access to Consumer Credit in the UK.” The European Journal of Finance 22 (10): 941–964.doi:10.1080/1351847X.2015.1019641.
De la Torre, Augusto, Erik Feyen, and Alain Ize.2013. “Financial Development: Structure and Dynamics.” The World Bank Economic
Review 27 (3): 514–541. The World Bank, Washington DC, USA.
Demirguc-Kunt, Asli, Leora Klapper, and Dorothe Singer.2017. “Financial Inclusion and Inclusive Growth: A Review of Recent Empirical Evidence.” WPS8040. The World Bank. http://documents.worldbank.org/curated/en/403611493134249446/Financial-inclusion-and-inclusive-growth-a-review-of-recent-empirical-evidence.
Eross, Andrea, Andrew Urquhart, and Simon Wolfe.2019. “Investigating Risk Contagion Initiated by Endogenous Liquid-ity Shocks: Evidence From the US and Eurozone Interbank Markets.” The European Journal of Finance 25 (1): 35–53. doi:10.1080/1351847X.2018.1462840.
European Central Bank.2018. - Press release - ECB announces further steps in supervisory approach to stock of NPLs. Accessed 25 December 2018.https://www.bankingsupervision.europa.eu/press/pr/date/2018/html/ssm.pr180711.en.html.
European Commission. 2018. - Press Release - Reducing Risk in the Banking Union: Commission Presents Mea-sures to Accelerate the Reduction of Non-Performing Loans in the Banking Sector.” n.d. Accessed 6 February 2019. http://europa.eu/rapid/press-release_IP-18-1802_en.htm.
Fu, Jonathan, and Mrinal Mishra.2020. “The Global Impact of COVID-19 on Fintech Adoption.” SSRN Scholarly Paper ID 3588453. Rochester, NY: Social Science Research Network.https://papers.ssrn.com/abstract= 3588453.
Han, Rui, and Martin Melecky. 2013. “Financial Inclusion for Financial Stability: Access to Bank Deposits and the Growth of Deposits in the Global Financial Crisis.” WPS6577. The World Bank. http://documents.worldbank.org/curated/en/ 850681468325448388/Financial-inclusion-for-financial-stability-access-to-bank-deposits-and-the-growth-of-deposits-in-the-Global-Financial-Crisis.
Hannig, Alfred, and Stefan Jansen.2010. “Financial Inclusion and Financial Stability: Current Policy Issues.” SSRN Scholarly Paper ID 1729122. Rochester, NY: Social Science Research Network. doi:10.2139/ssrn.1729122.
Houston, Joel F., Chen Lin, Ping Lin, and Yue Ma.2010. “Creditor Rights, Information Sharing, and Bank Risk Taking.” Journal of
Financial Economics 96 (3): 485–512.doi:10.1016/j.jfineco.2010.02.008.
Kapp, Daniel.2012. “The Optimal Size of the European Stability Mechanism: A Cost-Benefit Analysis.” 349. DNB Working Papers. Netherlands Central Bank, Research Department.https://ideas.repec.org/p/dnb/dnbwpp/349.html.
Karlan, Dean, Aishwarya Lakshmi Ratan, and Jonathan Zinman.2014. “Savings By and for the Poor: A Research Review and Agenda.” The Review of Income and Wealth 60 (1): 36–78.doi:10.1111/roiw.12101.
Khan, H. R.2011. Financial Inclusion and Financial Stability: Are They Two Sides of the Same Coin? Address by Shri H. R. Khan, Deputy Governor of the Reserve Bank of India, at BANCON 2011, organized by the Indian Bankers Association and Indian Overseas Bank, Chennai, India, 4 November.
Klapper, L., M. El-Zoghbi, and J. Hess. 2016. “Achieving the Sustainable Development Goals: The role of financial
inclu-sion.” CGAP and UN Secretary General’s Special Advocate for Inclusive Finance for Development. Retrieved from
https://www.unsgsa.org/files/2814/6489/8731/sdgs_paper_final_003.pdf.
Laeven, Luc, and Ross Levine.2009. “Bank Governance, Regulation and Risk Taking.” Journal of Financial Economics 93 (2): 259–275.doi:10.1016/j.jfineco.2008.09.003.
Lepetit, Laetitia, Emmanuelle Nys, Philippe Rous, and Amine Tarazi.2008. “Bank Income Structure and Risk: An Empirical Analysis of European Banks.” Journal of Banking & Finance 32 (8): 1452–1467.
Mehrotra, Aaron N., and James Yetman.2014. “Financial Inclusion and Optimal Monetary Policy.” SSRN Scholarly Paper ID 2542220. Rochester, NY: Social Science Research Network.https://papers.ssrn.com/abstract= 2542220.
Morgan, Peter, and Victor Pontines.2014. “Financial Stability and Financial Inclusion.” SSRN Scholarly Paper ID 2464018. Rochester, NY: Social Science Research Network. doi:10.2139/ssrn.2464018.
Moudud-Ul-Huq, Syed.2019. “Banks’ Capital Buffers, Risk, and Efficiency in Emerging Economies: Are They Counter-Cyclical?”
Eurasian Economic Review 9 (4): 467–492.doi:10.1007/s40822-018-0121-5.
Prasad, Eswar S.2010. “Financial Sector Regulation and Reforms in Emerging Markets: An Overview.” 16428. NBER Working Papers. National Bureau of Economic Research, Inc.https://ideas.repec.org/p/nbr/nberwo/16428.html.
Roodman, David.2009a. “How to Do Xtabond2: An Introduction to Difference and System GMM in Stata.” Stata Journal 9 (1): 86–136.
Roodman, David.2009b. “A Note on the Theme of Too Many Instruments*.” Oxford Bulletin of Economics and Statistics 71 (1): 135–158.doi:10.1111/j.1468-0084.2008.00542.x.
Sahay, Ratna, Martin Cihak, Papa M. N’Diaye, Adolfo Barajas, Srobona Mitra, Annette J. Kyobe, Yen N. Mooi, and Reza Yousefi.2015. “Financial Inclusion; Can It Meet Multiple Macroeconomic Goals?” 15/17. IMF Staff Discussion Notes. International Monetary Fund.https://ideas.repec.org/p/imf/imfsdn/15-17.html.
Sha’ban, Mais, Claudia Girardone, and Anna Sarkisyan.2019. “Cross-Country Variation in Financial Inclusion: A Global Perspec-tive.” The European Journal of Finance 26 (0): 319–340.
Soedarmono, Wahyoe, Sigid Eko Pramono, and Amine Tarazi.2017. “The Procyclicality of Loan Loss Provisions in Islamic Banks.”
Research in International Business and Finance 39: 911–919.doi:10.1016/j.ribaf.2016.05.003.
Soedarmono, Wahyoe, and Amine Tarazi.2016. “Competition, Financial Intermediation, and Riskiness of Banks: Evidence From the Asia-Pacific Region.” Emerging Markets Finance and Trade 52 (4): 961–974.doi:10.1080/1540496X.2015.1018039.
Windmeijer, Frank.2005. “A Finite Sample Correction for the Variance of Linear Efficient Two-Step GMM Estimators.” Journal of
Econometrics 126 (1): 25–51.doi:10.1016/j.jeconom.2004.02.005.
World Bank.2019. Europe and Central Asia Economic Update, Spring 2019: Financial Inclusion. Washington, DC: World Bank. © World Bank.
Yusgiantoro, Inka, Wahyoe Soedarmono, and Amine Tarazi.2019. “Bank Consolidation and Financial Stability in Indonesia.”