Optimization of EDTA–Ammonia Ratio for Chemically Deposited
Layers of ZnO Nanoparticles
M. Önal
a,* and B. Altıokka
a,**
aBilecik Şeyh Edebali University, Bilecik, 11210 Turkey
*e-mail: [email protected] **e-mail: [email protected]
Received October 14, 2019; revised November 28, 2019; accepted December 3, 2019
Abstract—Layers of zinc oxide (ZnO) on glass substrates were grown by chemical bath deposition method. This method refers to solvo-thermal methods of crystal growth. When either ethylene-diamine-tetraacetic acid (EDTA) or ammonia was used as a complex agent, very weak adhesion of ZnO nanoparticles to the sur-face of glass substrates was noted, and when washing, the samples on the sursur-faces were removed by a water f low under pressure. When EDTA and ammonia were used together, the adhesion of ZnO nanoparticles to glass substrates increased dramatically. According to X-ray diffraction data, all sediments belong to the hex-agonal syngony and correspond to the wurtzite-type ZnO structure. Optical absorption measurements showed that the band gap varied from 3.58 to 3.97 eV. The density of beams from ZnO nanowires on the sub-strate surface varied depending on the ratio between EDTA and ammonia.
DOI: 10.1134/S1063774520070135
INTRODUCTION
ZnO is an intriguing semiconducting material due to its band gap energy of 3.3 eV and exhibition of n-type feature [1]. Moreover, it has a large exciton binding energy (60 meV) and superior conducting properties based on oxygen vacancies in the wurtzite-type structure [2]. ZnO is considered as a potential material to be used in the fields of solid-state emission, piezoelectric transducers, solar cells, chemical sen-sors, ultraviolet laser diodes, photocatalysts, elec-troluminescent devices and transparent electrodes [1]. ZnO nanocrystalline structures can be produced by a variety of methods, such as ultrasonic spray pyrol-ysis, pulsed laser deposition, sol–gel methods and RF magnetron sputtering. In this work, ZnO nanof lowers were synthesized by the simple, safe and economic chemical bath deposition technique [3].
The issues of good adhesion and synthesis of homogeneous samples are a huge problem for this method because of the uncontrolled sample growth depending on unforeseeable chemical reactions. Therefore, a complex agent using an alkaline solution is preferred in many similar studies. Complex agents are generally chosen as monoethylamine, diethanol-amine, ethylenedidiethanol-amine, ammonia, triethanoldiethanol-amine, dimethylamine, and their mixtures [4]. In the litera-ture, in addition to ammonia, five complexing agents are used: N2H4 (hydrazine), ethylamine,
methyl-amine, triethylmethyl-amine, and dimethylamine [5].
There is only one study related to the agents pre-pared by mixing ethylene-diamine-tetraacetic acid (EDTA) and NH3 for the chemically deposited ZnO [6]. However, the X-ray diffraction (XRD) patterns and optimum molarities of EDTA and NH3 are not given. In addition, the samples were annealed for obtaining ZnO and quality of adhesion was not referred.
In this work, demonstrating a novel approach, cer-tain amounts of EDTA and NH3 were used together as
a complexing agent to obtain good adhered samples. In contrast to the literature data, the samples were found to not adhere well when EDTA and NH3 were
used separately; and when the samples were rinsed with relatively pressurized water by using a washing bottle, they were completely removed from the glass substrate. On the contrary, when EDTA (8, 12 and 16 mM) and NH3 were used in the final solution, the samples very tightly adhered to the glass substrates. Thus, the problem of poor adhesion was completely resolved in this study.
EXPERIMENTAL Method
The chemical bath deposition was employed to produce layers of ZnO nanoparticles. The bath con-tainer and the glass substrates were cleaned with 10% HCl acid and then rinsed with deionized water. The temperature of the baths was kept at 85 ± 2°C and the depositions were completed in 20 min for all
experi-SURFACE
ments. When either EDTA or NH3 was used, the
sam-ples adhered very poorly to the substrates and removed from the surface with water during the rinsing. In the 100 mL deionized water, firstly 65 mM ZnCl2 was
dis-solved and then 4, 8, 12, 16 and 20 mM of EDTA were added; according to the EDTA–ammonia ratios, the experiments were named beginning from Set 1 to Set 5, respectively. In all the experiments, the pH of the solutions was adjusted 10.1 with diluted NH3 and thereafter, the solutions started to be heated and
stirred with 600 rpm. The summarized experimental conditions are listed in Table 1. When pH of the solu-tions was above or below 10.1, the precipitation was not observed on the surfaces. After the depositions, the samples were washed with water outgoing from the nozzle of the washing bottle and left to dry under room conditions.
Analysis
The structural, optical and morphological charac-teristic of the layers of ZnO nanoparticles were ana-lyzed by using a PANalytical Empyrean XRD, JASCO V–530 with double beam UV-vis spectrometer and a Zeiss SUPRA 40VP scanning electron microscope, respectively.
RESULT AND DISCUSSION
Structural Analysis of Layers of ZnO Nanoparticles The thicknesses of the layers of ZnO nanoparticles were calculated by using the well-known gravimetric method. The thicknesses of the layers obtained in Set 2 and Set 3 averaged 560 nm. The thickness of the lay-ers of ZnO nanoparticles obtained in Set 4 was approximately 420 nm and the thicknesses obtained in Set 1 and Set 5 were on average 250 nm. These results showed that the adhesion of the layers of ZnO nanoparticles obtained in Sets 2–4 was relatively high and it depended on EDTA–NH3 molarities. But the chemical reactions taking place in experiments could not be estimated for this outcome of good adhesion.
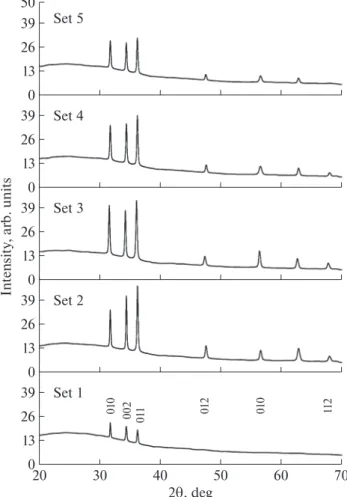
The structure of the layers of ZnO nanoparticles was studied by using XRD. Diffractograms are given in Fig. 1. All layers of ZnO nanoparticles are found to have hexagonal structures and to match well with ASTM card no 98-005-7450. The preferred orienta-tion of the layers of ZnO nanoparticles was calculated by using the texture coefficient (TC) [7, 8]:
(1)
where I0hkl is the standard intensity of the ref lection
from (hkl) plane given in ASTM card, Ihkl is the mea-sured relative intensity of the hkl ref lection. The calcu-lated TC are given in Table 2. The preferred orienta-tion of the layers of ZnO nanoparticles are found to be predominantly the (002) plane. However, from Table 2 it is clear that the method of chemical bath deposition of ZnO layers does not allow obtaining good ZnO tex-tures on glass substrates. This phenomenon is also confirmed by the scanning electron microscopy (SEM) as will be discussed bellow.
The size of crystallites in the layers of ZnO nanoparticles was calculated via full width at half
max-=
0 0 / , 1 hkl hkl hkl N hkl I I TC I N ITable 1. The summarized experimental details for ZnO Experi-ments Concentration, mM Tempe-rature, °C pH Deposi-tion time, min ZnCl2 EDTA Set 1 65 4 85 ± 2 10.1 20 Set 2 65 8 85 ± 2 10.1 20 Set 3 65 12 85 ± 2 10.1 20 Set 4 65 16 85 ± 2 10.1 20 Set 5 65 20 85 ± 2 10.1 20
Fig. 1. Diffractograms of ZnO obtained using various
EDTA–ammonia ratios. 13 26 39 0 30 40 50 60 70 20 Set 1 010 01 1 01 2 11 2 010 002 13 26 39 0 Set 2 13 26 39 0 Set 3 13 26 39 0 Set 4 13 26 39 50 0 Set 5 Int e n sity , arb. units 2T, deg
imum (FWHM) of the peaks and using Scherrer equa-tion:
(2) where λ is the wavelength of X-ray radiation (1.54056 Å), β is the FWHM, 2θC is the peak center [9–15]. The calculated crystallite sizes are summarized in Table 3. They vary between 29 and 48 nm. The thicknesses of layers of ZnO nanoparticles and EDTA–ammonia ratios are found to affect crystallite sizes.
Optical Properties of the Layers of ZnO Nanoparticles The optical absorbance of the layers of ZnO nanoparticles was measured using the UV-vis spec-trometer. The absorbance plots are given in Fig. 2. The layers of ZnO nanoparticles obtained in Set 1 and Set 5 showed relatively low absorbance. It was concluded that these results might be due to low thicknesses of layers of ZnO nanoparticles and low surface rough-ness.
Absorption coefficient (α) depends on the thick-ness of layers of ZnO nanoparticles (t) and also on band gap energy (Eg) according to Tauc plot model.
This model was used in many studies [16–18]:
(3) where n = 1/2 for directly allowed transitions, Eg is the
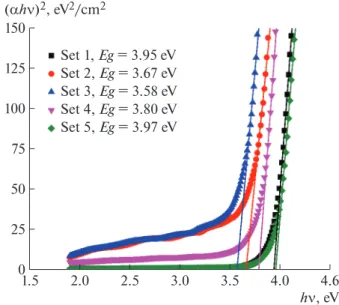
optical band gap energy, hν is the photon energy, and A is a constant. The direct band gap was estimated by extrapolating the linear portion of (αhν)2 to hν = 0
point [4, 11]. Tauc plots are given in Fig. 3 and esti-mated energy band gaps are listed in Table 3. The band gaps are between 3.58 and 3.97 eV, depending on the
× = C 0.089 180λ [ nm], 314β cos θ cs = − 2 g (α ν)h A h( ν E )n,
crystallite sizes. In the literature, the band gap of the ZnO is 3.3 eV [12, 13]. In our study, the band gap of layers of ZnO nanoparticles is greater than 3.3 eV. This may be due to small crystallite sizes.
Fourier Transform Infrared Photometry of the Layers of ZnO Nanoparticles
The Fourier transform infrared photometer (FTIR) spectra were recorded between 380 and 4000 cm–1 (Fig. 4). The band positions and absorption
peaks depend not only on the chemical composition Table 2. Calculated texture coefficients and preferred ori-entation of layers of ZnO nanoparticles
(hkl) Set 1 Set 2 Set 3 Set 4 Set 5 (010) 1.18 0.79 1.05 0.92 0.98 (002) 1.29 1.45 1.26 1.32 1.29 (011) 0.53 0.75 0.69 0.76 0.73
Table 3. The crystallite sizes (cs) and energy band gaps of the layers of ZnO nanoparticles
Experi-ments cs, nm Band gap, eV (010) (002) (011) Average Set 1 35 31 30 32 3.95 Set 2 46 47 30 41 3.67 Set 3 77 44 23 48 3.58 Set 4 33 36 32 37 3.80 Set 5 31 27 28 29 3.97
Fig. 2. Absorbance spectra of ZnO at wavelengths between
300 and 650 nm. 0.5 1.0 1.5 2.0 2.5 3.0 0 300 350 400 450 500 550 600 650 250 Wavelength, nm Absorbance, arb. units
Set 1 Set 2 Set 3 Set 4 Set 5
Fig. 3. Tauc plots and energy band gaps for layers of ZnO
nanoparticles. 25 50 75 100 125 150 0 2.0 2.5 3.0 3.5 4.0 4.6 1.5 hQ, eV (DhQ)2, eV2/cm2 Set 1, Eg = 3.95 eV Set 2, Eg = 3.67 eV Set 3, Eg = 3.58 eV Set 4, Eg = 3.80 eV Set 5, Eg = 3.97 eV
and structure of the samples but also on the morphol-ogy of the samples [19]. Metal oxides generally show absorption bands in the fingerprint region below
1000 cm–1, arising from interatomic vibrations [20]. In
a previous study [21], ZnO stretching was observed at around 887 and 605 cm–1. Thus, we can say that the
vibrations near 725 and 900 cm–1 are related to ZnO.
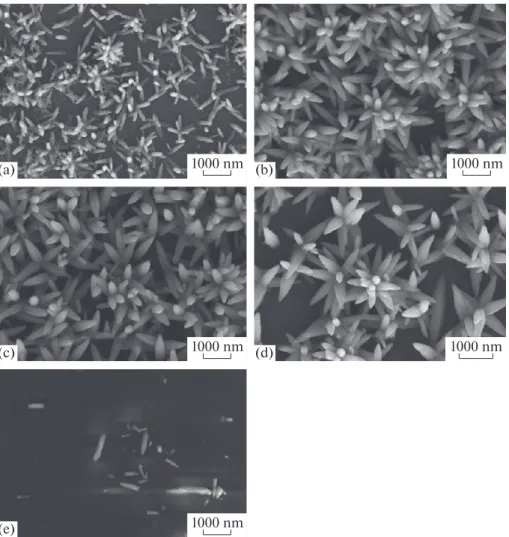
SEM Analysis of the Layers of ZnO Nanoparticles The 20 000 times magnified top view images of the layers of ZnO nanoparticles are given in Fig. 5. The nanorod-like structure of the surface of the samples obtained in Set 1 is observed (Fig 5a). The diameter and length of these sparse nanorods are approximately 150 and 750 nm, respectively. The surfaces of the sam-ples obtained in Set 2 and Set 3 are covered completely with nanof lower-like structures (Figs. 5b and 5c). These f lower-like structures decreased on the surface of the sample obtained in Set 4, as shown in Fig. 5d. The diameters of all f lower-like structures are approx-imately 350 nm. There are almost no f lowers or rod-like structures on the surface of the sample obtained in Set 5 (Fig. 5e). The possible reason for the relatively low absorbance of the samples obtained in Set 1 and Set 5 is a low surface roughness. Thus, these samples
Fig. 4. FTIR spectra versus wavenumber for layers of ZnO
nanoparticles. 20 40 60 80 100 0 1000 2000 3000 4000 Wavlength, nm T, % Set 1 Set 2 Set 3 Set 4 Set 5
Fig. 5. 20 000 times magnified top view SEM images of the layers of ZnO nanoparticles obtained in (a) Set 1, (b) Set 2, (c) Set 3,
(d) Set 4 and (e) Set 5.
1000 nm 1000 nm 1000 nm 1000 nm 1000 nm (а) (b) (c) (e) (d)
may be suitable for solar cells. On the contrary, the samples obtained in Sets 2–4 showed relatively high absorbance. So, these samples may be suitable for gas sensors because of the large surface area.
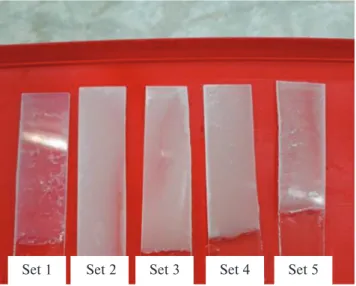
Visual Analysis of the Layers of ZnO Nanoparticles Figure 6 shows the photos of all layers of ZnO nanoparticles. It can be seen that the ZnO nanoparti-cles adhere poorly to the surfaces of the samples obtained in Set 1 and Set 5. The other samples adhere well to the surface of the substrates. These sample sur-faces turned out to be very compact. However, the reaction details for good adhesion cannot be analyzed.
CONCLUSIONS
In this study, layers of ZnO nanoparticles were grown by chemical bath deposition processes on the glass substrates. The great adhesion problem for chemically deposited ZnO was resolved by using cer-tain amounts of EDTA and NH3. When the
concen-tration of EDTA was below 8 mM and above 16 mM, the samples did not adhere well to the surfaces of the glass substrates. The optimum conditions for good adhesion were when the concentration of ZnCl2 was
65 mM, pH was 10.1 and the molarity of EDTA varied between 8 and 16 mM, as confirmed by photos of the samples. The structural analysis was carried out by XRD, all layers of ZnO nanoparticles had hexagonal crystal structures. While the band gap of bulk ZnO was
3.3 eV, the band gaps of the layers of ZnO nanoparti-cles were between 3.58 and 3.97 eV. The low crystallite sizes were concluded to be the reason for these high values of band gaps.
The SEM images showed that the surface of the samples was covered with nanof lowers. These nano-f lowers are common morphologies onano-f the ZnO parti-cles produced by the chemical bath deposition. The density of the nanof lowers depended on the EDTA– ammonia ratio.
REFERENCES
1. M. M. Ali, J. Basrah Res. (Sciences) 37, 49 (2011). 2. P. B. Taunk, R. Das, D. P. Bisen, et al., Karbala Int.
J. Modern Sci. 1, 159 (2015).
3. S. Temel, F. O. Gokmen, and E. Yaman, Eur. Sci. J., 13, 28 (2017).
4. F. Özütok and S. Demiri, Digest J. Nanomater. Bio-struct. 12, 309 (2017).
5. H. Khallaf, G. Chai, O. Lupan, et al., J. Phys. D 42, 135304 (2009).
6. Y. G. Taofeek and E. H. Olusegun, Int. J. Sci. Technol. Res. 1, 24 (2012).
7. R. R. Krishnan, G. Sanjeev, R. Prabhu, and V. P. M. Pil-lai, JOM 70, 739 (2018).
8. O. Reyes, D. Maldonado, J. Escorcia-García, and P. J. Sebastian, J. Mater. Sci.: Mater. Electron. 29, 15535 (2018).
9. A. K. Yildirim, Materiali in Tehnologije 52, 667 (2018). 10. A. S. Ibraheam, Y. Al-Douri, J. M. S. Al-Fhdawi, et al.,
Microsyst. Technol. 22, 2893 (2016).
11. A. K. Yıldırım, Int. J. Eng. Res. Online 6, 5 (2018). 12. R. Bhowmik, M. N. Murty, and E. S. Srinadhu, PMC
Phys. B 1, 20 (2008).
13. A. N. Fouda, M. Marzook, H. M. Abd El-Khalek, et al., Silicon 9, 809 (2017).
14. S. I. Drapak, S. V. Gavrylyuk, Z. D. Kovalyuk, and O. S. Lytvyn, Inorg. Mater. 47, 847 (2011).
15. L. N. Obolenskaya, M. A. Zaporozhets, G. M. Kuzmi-cheva, et al., Crystallogr. Rep. 60, 406 (2015).
16. B. Thomas, S. Deepa, and K. Prasanna Kumari, Ionics 25, 2 (2018).
17. K. L. P. Thi, L. T. Nguyen, N. H. Ke, et al., J. Electron. Mater. 47, 6302 (2018).
18. Z. Yuan, J. Electron. Mater. 44, 1187 (2015).
19. Z. R. Khan, M. S. Khan, M. Zulfequar, and M. Shahid Khan, Mater. Sci. Appl. 2, 340 (2011).
20. H. Kumar and R. Rani, Int. Lett. Chem., Phys. Astron. 14, 26 (2013).
21. M. R. Bodke, Y. Purushotham, and B. N. Dole, Cerâmica 64, 91 (2018).
Fig. 6. The photographs of the ZnO samples.
Set 1 Set 2 Set 3 Set 4 Set 5