CDMA 450 IN ISTANBUL METROPOLITAN REGION
C¸ A ˘GLAR KIZILIRMAK, SATILMIS¸ TOPCU AND HAYRETT˙IN K ¨OYMEN Communications and Spectrum Management Research Center (˙ISYAM)
Bilkent University, Bilkent, Ankara, Turkey E-mail: {caglar,topcu,koymen}@ee.bilkent.edu.tr
In this work, a complete design of PMR (Professional Mobile Radio) network based on CDMA 450 in ˙Istanbul metropolitan region is presented. Coverage and capacity analysis are performed by the developed simulation software tool. Trade off between several system parameters such as quality of service, user mobility, traffic distribution, data rate and bandwidth are considered to optimize the capacity and coverage of the network. Coverage and handoff areas are shown on the map by the aid of GIS (Geographical Information Systems) tool. System capacity and coverage are presented as the main results of the proposed network.
1
Introduction
Amongst the most important instruments to assure swift and resourceful disaster response is a well-coordinated emergency communications system (ECS). In the past, although the importance of ECS is apparent, they could not be as successful as commercial systems in following the developments in communication technology. Today, the latest events and crisis around the world emphasized once more the importance of ECS and the need for upgrading them for increased system capacity and cooperation capability between other emergency agencies.
For this purpose, CDMA 450 emerged in the PMR (Professional Mobile Radio) market in March 2004. CDMA 450 is a very significant contender with its wide area coverage and all advantages of 3G technology such as higher data rate, push-to-talk and location-based services etc. Presently these systems are not allowed to be used in Turkey, because the regulatory authority did not yet assigned frequency bands for their operation. However it is expected that this will soon be possible.
2
Capacity and Coverage Issues in a CDMA Network
In a CDMA network, since all mobiles occupy the same spectrum band at the same time, the internal interference plays a critical role in determining the capacity of the network. A CDMA system can support different number of mobiles in reverse (MS to BS) and forward links (BS to MS). The capacity of a CDMA system depends on the reverse link capacity which is generally said to be less than the forward link capacity [1].
Number of mobiles that can be supported by a cell in the reverse link, is given by [2]; M = 1 + Gp ηp (Eb/Nt)vf(1 + f )− N0W ηp Svf(1 + f ) (1) where, Gpis the processing gain (bandwidth/data rate), vfis the voice activity factor in the
uplink, S is the received signal power level by the base station from mobiles (which is equal for all mobiles due to the power control), ηpis the imperfect power control coefficient and
f is the other-cell interference factor that can be calculted as;
f = Pother Pincell
(2) In Eq. 2, Potherand Pincellrepresent the total power received from other cells’ mobiles and
own cell mobiles by the base station. This parameter is very sensitive in non-homogenous multi-cell structure where the site and traffic distribution are irregular.
As seen in Eq. 1, maximum number of mobiles is reached as S becomes very large. This maximum capacity, Mmax, is called as the pole capacity. Therefore, due to the change
in traffic distribution, number of active mobiles (M) in a cell would be some number lower than Mmax. Cell loading (ρ) is the ratio of active number of mobiles in a cell to its pole
capacity. ρ = M Mmax = M M + N0W ηp Svf(1+f ) (3) Concept of cell loading can easily be related to the cell size. As seen in Eq. 3, cell is fully loaded when S is very large, in other words number of active mobiles is close to its pole capacity. The only way to make S very high is to place mobiles very close to the base station, that means cell size should be very small.
In order to estimate the capacity and coverage limits in a realistic multi-cell CDMA network, a software tool is developed. This tool helps designer to evaluate the network performance under different conditions, for example when the cells are fully loaded or if there is a limit set for other-cell interference factor etc. Generally, in designing a CDMA network, practical limit for cell loading is 80% [2]. Also f should not be very large not to reduce the pole capacity. Again some limit can be set for f. Thus, our design tool would solve the network to find a state where ρ and f are less than certain values. Details of the cell design algorithm can be found in [4].
3
Results in ˙Istanbul Metropolitan Region
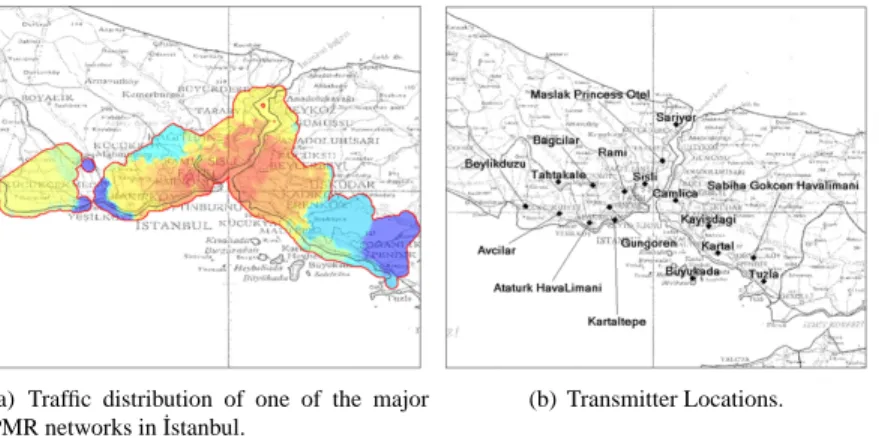
We now move our focus to designing a complete CDMA-PMR network in ˙Istanbul city. The traffic density is obtained from the results of the previous researches done by ˙ISYAM for a major PMR operator on public security which is one of the biggest PMR networks in the city. Figure 1(a), shows the traffic distribution of that PMR mobiles on map. Red areas indicate the dense traffic. There are 8000 mobile users and they generate about 8 Erlang traffic in busiest hour of Friday 13:00 - 14:00. Generated traffic is very low compared to the total number of mobiles which is the typical characteristics of a PMR network.
The traffic distribution data is vital for deciding on the base station locations. There are 17 base stations and 9 of them are selected according to the existing transmitter tow-ers. However, 8 of them should be newly set up which are Avcılar, Tahtakale, Ba˘gcılar,
G¨ung¨oren, Kartaltepe, S¸is¸li, Kartal and Tuzla. Table 1 gives the list of base stations with their locations, altitudes, effective radiated powers (ERP) and antenna configurations. Fig-ure 1(b) shows the transmitter locations.
(a) Traffic distribution of one of the major PMR networks in ˙Istanbul.
(b) Transmitter Locations.
Figure 1. Traffic distribution and transmitter locations.
Table 1. List of base stations
Base Site Latitude Longitude Altitude Antenna ERP Antenna Antenna
Name (m) height(m) (dBW) Type Direction
Atat¨urk HL 40 N 58 28 E 48 39.2 25 14 DIR Noth-West Beylikd¨uz¨u 41 N 00 28 E 37 199.4 43 14 DIR West
B¨uy¨ukada 40 N 51 29 E 07 200.6 20 3 DIR West C¸ amlıca 41 N 01 29 E 04 247.05 10 14 DIR East Maslak 41 N 06 29 E 01 99.9 78 14 DIR North-West
Sarıyer 41 N 11 29 E 04 200.13 50 14 Omni
-Rami 41 N 02 28 E 54 99.88 25 10 DIR North
Sabiha G. HL 40 N 53 29 E 17 99.88 25 10 Omni
-Ba˘gcılar 41 N 03 28 E 49 77.09 45 14 Omni
-S¸is¸li 41 N 03 28 E 58 99.88 45 14 Omni
-Tuzla 40 N 50 29 E 19 200.13 40 14 DIR South-East
Tahtakale 41 N 04 28 E 43 99.8 45 14 Omni
-Kayıs¸da˘gı 40 N 58 29 E 09 399.04 20 14 DIR South-East Kartal 40 N 54 29 E 11 77.19 45 14 DIR North-East
Avcılar 40 N 59 28 E 43 64.22 40 14 DIR North
G¨ung¨oren 41 N 00 28 E 52 49.9 10 10 DIR North-East Kartaltepe 40 N 58 28 E 53 11.09 40 10 DIR North-East
The design process starts with stating the coverage requirements, capacity requirements and quality requirements. In this simulation, coverage requirement is to cover most of the ˙Istanbul Metropolitan Area with sufficient intersection areas between cell boundaries. Our target coverage area is not limited by the considered PMR network’s traffic distribution. Moreover, voice service is assumed to be given with a data rate of 9.6 kbps as a quality requirement. Capacity requirement can be given as amount of traffic to be carried or the total number of users to be served. For this case, there is no strict capacity requirement, however cell loading is set as 80% and maximum other-cell interference factor as 80% by default which means number of active mobiles in each cell can not be lower than 22. (if f is 0.8, required Eb/Nt is 6.5 dB , processing gain is 128, voice activity factor is 0.5 and imperfect power control coefficient is 0.85, pole capacity becomes 28. If the cell is 80% loaded, number of mobiles becomes 22.)
Before going into cell design process, path losses for each base station over the area should be calculated. For this purpose, Rec. ITU-R P.370 propagation model is used with urban city correction [3]. Also Epstein-Peterson diffraction model is used to calculate additional losses due to diffraction. These path losses include only the losses due to the
terrain profile and distance from the transmitter. Effects of fading and mobile speed will be included in Eb/Ntcalculations.
The simulation and system parameters are summarized below; System Parameters:
• Operating at 450 MHz frequency band. • Single Carrier
• Bandwidth of 1.25 MHz. • Data rate of 9.6 kbps.
Study Area and Propagation Simulation:
• 160 km by 140 km study area in ˙Istanbul Metropolitan region.
• The digital terrain elevation data is in the DTED Level 1 (resolution of 3 by 3
arcsec-onds) format.
• Rec. ITU-R P.370 is chosen as the propagation model with urban city correction.
Base Stations:
• Noise Figure of 5 dB.
• Different ERP’s and antenna heights as given in Table 1. • Results are based on 17 base stations.
Mobile:
• Maximum transmit power of 24 dBm. • Antenna height of 1.5 m.
• Antenna gain of 0 dBd. • Noise Figure of 8 dB.
• Considered as uniformly distributed on land only. • Moves at average speed of 40 kmph.
Reverse Link:
• Required Eb/Ntis 6.5 dB.
• Voice activity of 0.5. • Imperfect power control.
Forward Link:
• Required Eb/Ntis 7 dB.
Then, simulation is performed to find out the coverage and capacity of this network. Figure 2(a) and Figure 2(b) show the other-cell interference factors and cell loadings for the 17 base stations in this network. It is clearly seen that these parameters vary for each cell. This is in contrast with the homogenous hexagonal multi-cell structure in which these parameters would be constant. The sites with the largest cell loadings have the smaller cell sizes.
It has been shown earlier that the other-cell interference factor f has a direct effect on pole capacity in a cell. Those cells that have a high value of f, see greater level of other-cell compared to the own cell interference. This may be because they are high-altitude sites that are visible over a large area, or they are centrally placed between many other cells.
Another reason for high other-cell interference levels may be the usage of omni directional antenna which allows other cells’ mobiles to see the base station in every direction. For example, the sites Tahtakale and Sabiha G. HL. use omni directional antennas and their f’s are larger than 80%. This condition is acceptable for this case since there is not much capacity needed in those regions. Also, for the sites with smaller coverage, f is lower. For example, site Kartaltepe is centrally placed and experiences too much interference from other cells’ mobiles (Pother), however since its coverage is small the power received from
its own mobiles (Pincell) is also high.
Other-cell interference factors, cell loadings and number of mobiles for each cell in the network are given in Figures 2.
(a) Other-cell interference factor (f) in each cell. (b) Cell loadings in each cell.
(c) Number of mobiles in each cell.
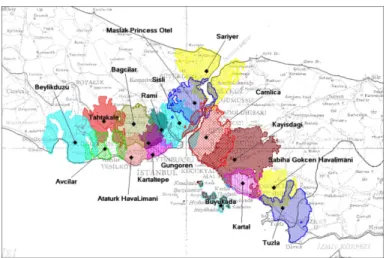
Figure 2. Other-cell interference factors, cell loadings and number of mobiles in each cell. In Figure 3, coverage areas of each cell in the network are given. Also, handoff regions are shown in Figure 4. The blue colored region shows the region where there is no handoff, but single connection. Red colored region shows the region where two-way handoff is possible. Finally green region shows 3-way handoff region which means mobile in that region can have service from three different base stations.
Figure 3. Coverage areas of each cell in the network. Cell loadings are 80% in each cell.
Figure 4. Handoff regions for approximately 80% loading in each cell.
4
Conclusions
In this work, a complete CDMA-PMR network is designed for ˙Istanbul metropolitan re-gion. If we compare the generated traffic by one of the existing PMR networks in the city and the traffic capacity of the proposed network, we see that this network can easily carry all the generated traffic of the existing network. The rectangular area in Figure 5 shows the part of the city where the traffic is the highest in the case of considered network. In the rectangular area, mobiles generate a traffic about 4 Erlang. That much traffic is interpreted as if there are always 4 mobiles in the system at the same time during an hour. In the same area, the network designed in this work can provide service to 87.74 users at the same time. Therefore, the capacity of the proposed network is almost 22 times the demand. Rest of the capacity can be used by different organizations. In CDMA-PMR, defining user groups and giving different services to different organizations with the same network are possible. The results in this work are presented for approximately 80% loading in each cell.
Figure 5. In the rectangular area, generated traffic by one of the major PMR networks is 4 Erlang and capacity of the proposed network is 87.74 Erlang.
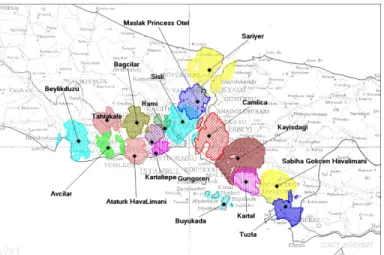
The number of base stations and their distributions over the area can allow reasonable overlapped areas to appear with 80% loading. However, a good design should allow the cell boundaries to overlap even if one or two of the cells are fully loaded. Assume the cell S¸is¸li is heavily loaded and the others are 80% loaded. In this case, coverage areas would be like in Figure 6. Size of the cell S¸is¸li decreases 42% and still overlaps with the cells Maslak and Rami. However, the intersection with G¨ung¨oren and Kartaltepe disappears and small gap arises in that area. Considering the possibility of the cell S¸is¸li is fully loaded, this small gap is acceptable although the mobiles in that area can not have service and would be blocked.
Figure 6. Coverage areas of each cell in the network. Cell loadings are 100% for cell S¸is¸li and 80% for all others.
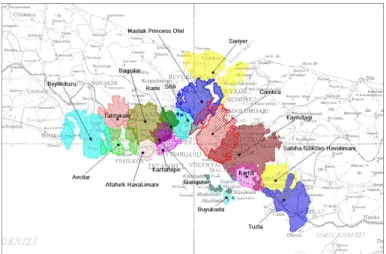
A further insight on relationship between cell loading and coverage can be gained if the simulation is run for 100% loading in each cell. This time, the coverage areas would be as
in Figure 7. As seen in Figure 7, coverage areas generally do not overlap and there are gaps between cell boundaries, which is not acceptable for moving mobiles. In this case, some new base stations should be added and the final network can carry much larger traffic. In PMR networks, that much traffic is very rarely needed and 80% loading is taken as a fair capacity and coverage limit.
Figure 7. Coverage areas of each cell in the network. Cell loadings are 100% in each cell. In this work, mobiles are assumed to be uniformly distributed on land only. Since prop-agation on sea is better than the land, there are wider intersection areas on sea. If mobiles are assumed to be uniform over all the area including the sea, other-cell interference levels would increase since cells overlap more.
Here, we assumed that only voice service is given and simulations are done on this basis. In case of different type of data services, multi-carrier option can be used. Moreover, in order to increase the capacity, cell sectoring can be preferred.
There are other effects which determine the performance of a CDMA network. For example, number of available codes and orthogonality between them, the performance of rake receivers etc. In this work, these issues were not addressed.
References
1. A.J. Viterbi and A.M. Viterbi, “Erlang capacity of a power controlled CDMA system,” IEEE
Selected Journal on Communications, 11(6):892-900, Aug. 1993.
2. V. K. Garg, “Wireless Network Evolution,” Prentice Hall,2001.
3. Recommendation ITU-R P.370-7, “VHF and UHF Propagation curves for the frequency range from 30 MHz to 1000 MHz”.
4. C. Kizilirmak, “CDMA-PMR Network Planning and Optimization in ˙Istanbul,”, Master Thesis, Institute of Engineering and Science, Bilkent University, Turkey, Aug. 2006.