CHARACTERIZATION
OF LAYERED MATERIALS
BY THE LAMB WAVE LENS
A. Atalar, H. Koymen, L. Degertekin
Bilkent University, Ankara TURKEY
ABSTRACT
Lamb wave lens is a new type of lens that can be replace the conventional lens of an acoustic microscope for some applica tions. When it insonifies a layered solid structure, it excites a single mode in the structure provided that the frequency is properly adjusted. Measuring the return signal as a function of frequency results in a characteristic curve showing clearly the excited modes. Since the number of excited modes, the frequen- cies at which they are excited and the efficiency of excitation are highly dependent on the elastic and physical parameters of the layered solid, a characterization method emerges. In this pa- per we describe this new characterization method for the layered structures using the Lamb wave lens. Theoretical and experi- mental results are presented for this method.
I. INTRODUCTION
Acoustic microscope is a powerful instrument for the quantita- tive characterization of materials [I, 21. In particular, impor- tant structural parameters like
film
adhesion [3], elastic constants [4, 51 and residual stresses [6] on layered solids can be measured. Subsurface images of such structures can also be obtained using the excited leaky layer waves [7, 81. However, such images are cluttered by the presence of many simultaneous modes in the solid object, inherently excited by the conventional lens. The Lamb wave lens, introduced earlier [9], can be used as the lens of an acoustic microscope to obtain subsurface images that are easy to interpret. It generates a conical wavefront which can excite leaky waves in a layered structure with a high efficiency. As opposed to the conventional spherical acoustic microscope lens which excites acoustic waves at all incidence angles on the object surface, the Lamb wave lens excites acoustic waves with a k e d incidence angle at the liquid-object interface. The efficiency of subsurface wave excitation of a conventional lens is rather poor, since an appreciable part of input power is wasted at incidence angles where there is no subsurface excitation. As the critical angle of a layered material depends on frequency [lo], the Lamb wave lens can selectively excite the leaky modes by matching the fixed incidence angle with the corresponding critical angle at a particular frequency. Recording the received signal amplitude, V, as a function of varying frequency, f , one obtains a uniqueV ( f ) curve which is highly dependent on elastic parameters of
1051-0117/90/0000-0359
$1.00
0
1990
IEEE
the layer, of the substrate and the quality of the bonding. This provides a characterization method for layered structures. V(f) characterization is similar to the well-known V(2) characteri- zation [ll]. The structure of V(2) is a result of interference between specularly reflected rays with leaky modes. When used with a layered structure, the presence of many modes makes the interpretation of V(2) rather difficult [12]. The proposed V(f) technique has some advantages: A fast frequency scan is suffi- cient to get V(f) while a slow mechanical scanning is needed for
V ( 2 ) . Moreover, the interpretation of V ( f ) is easier than that
of V ( 2).
In this paper, we first give a theoretical analysis of the
V(f)
characterization technique based on angular spectrum approach and ray acoustics. We find an expression which relates the sig- nal output to the reflection coefficient of the object, and to the geometrical parameters of the lens. To show the subsurface char- acterization potential of the system, layers with perfect bonding and with slippery interface are investigated. We find that the described method differentiates between those interfaces with a high sensitivity. For experimental confirmation we use a refrac- tive type Lamb wave lens. We present measured
V(f)
curves for layered materials along with calculated results. We also show that it is possible to get a quantitative information about layer elastic parameters from V(f) and priori data.11. LAMB WAVE LENS
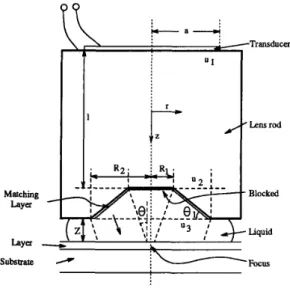
A layered solid immersed in a liquid supports leaky modes known as Rayleigh-like (LR) waves [13] and generalized Lamb waves [14]. Focusing of these leaky modes can be realized by the Lamb wave lens as delineated in Fig. 1. A conical recess replaces the spheri- cal cavity of the conventional lens. An antireflection layer exists on the conical surface to reduce mismatch loss. The central part is blocked by an absorbing material to avoid acoustic waves that come out of this region. If the inclination of generated conic waves is chosen to be a critical angle for a mode of Lamb waves, almost all the energy will be converted to a leaky Lamb wave mode. Since the Lamb wave modes are dispersive, the critical angle of a Lamb wave mode can always be made equal t o the fixed incidence angle of the Lamb wave lens by adjusting the ex- citation frequency. The excited evanescent Lamb waves converge and focus a t the intersection of the cone axis with the object surface. The focused waves then diverge and leak back into the liquid medium. Upon refraction from the conical surface, they are detected by the transducer. Note that, to avoid detection of specularly reflected rays, the distance between the object surface
Matching Layer Layer
.
Transducer Lens rod Blocked LiquidFigure 1: Gebmetry of the Lamb wave lens
and the lens must be sufficiently small. To satisfy this require- ment, the distance between the lens and the object surface, 2, must satisfy 2
<
(R1/tanB-(Rz- Rl)tanO1).The design of the Lamb wave lens involves the following con- siderations. The cone angle must be decided using the disper- sion curves for the layered material or materials of interest. The transducer size and the rod length must be chosen to minimize the diffraction loss and the interference from spurious pulses. For good efliciency the lens aperture must be of suitable size. The transducer bandwidth must be wide enough to allow a frequency scan.
111. RESPONSE OF THE LAMB WAVE LENS
The amplitude of the signal received at the transducer of a Lamb wave lens can be found by an application of the angular spectrum technique. Referring to Fig. 1, a circular transducer of radius a is placed a distance 1 away from the conical refracting surface. A planar reflecting surface is a distance 2 away from the refracting surface as shown. We write the scalar potential, U:, at the plane of the transducer as
1 T S l
0 r > l
u:(z,y) = A circ[(z2
+
~ ' ) ~ / ' / a ] where circ(r) =The angular spectrum, Ut, at the same plane is given by a jinc function:
Uf(k,,k,) = F{u:(z,y)} = 4a2A jinc[(a/*)(k: -t ki)'/2] = = 2?raZA Jl[u(k;
+
ki)1/2]/[a(k2+
ki)1/2]where 51 is the Bessel function of the first kind, It, and k, are the components of the kl vector in z and y directions. The spectrum,
Ut,
at z = I is written asU,'(ks, k,) = 4u2A jinc[(a/r)(k; t ki)1/2]exp(jkzZ)
; +
-2 * -
Figure 2: Geometry for the Ray Theory
The scalar potential, U:, at the plane of conical lens can be
found by an inverse Fourier Transformation:
Due to the limited aperture of the conical surface, only the part of the field distribution for which R1
5
(z2+
y2)1/25
Rz issignificant. At this point we use the ray theory to find the field at the surface of the conical refractor surface. We keep the am- plitude of the field fixed, but change its phase according to the path length for each ray. Then, we use the ray theory again to take care of refraction effect through the Snell's Law. Referring to Fig. 2, the field at the plane 3, u t , is approximately
(r'/r)u$(r')exp{j(kldl
+
k z d z ) } RI<
r'<
Rz elsewhere UB(T) =with TI = ( r
+
R~ tanel tan(el-
ez))/(i
+
tanel tan(el -e2)),
ICl sin O1 = kz sin B2, and dl = (r' - R1) tanel and dz = (Rz-
r') t a n & / cos(O1-
02). Here kl and kz are the wavenumbers in the lens rod and in the liquid medium. At this point we can transform into the angular spectrum domain to take care of the propagation in z direction and the reflection process at the object interface. The reflected angular spectrum at the same plane,U;,
is given by
where U$(k,,k,) = T { u $ ( z , y ) } . Here, exponential factor takes care of a total propagation distance of 2 2 and the reflection pro- cess at the surface of the layered structure is included through a multiplication by the reflection coefficient, ' R ( k , / k 2 ) . The volt- age output, V, of the transducer due to reflected field can be found from
v
=/'"]'"
k;u$(-k,, -k,)UJk,,It,) dk, dk,-m -CO
Since the problem has circular symmetry we can make the sub- stitution k, = (k:
+
k ; ) @ l 2 ) where k, is radial component of the wave number. Then, we write the output voltage, V, as a function of excitation frequency, f, asV(f) = 2*/+= k,k:u,+(k,)v,-(k,) dk,
Here, the V(f) is expressed in terms of lens geometry, the reflec- tion coefficient of the object material and operation frequency. The evaluation of V at a single frequency point involves two Fourier transformations and an integration operation. V(f) is a function of the reflection coefficient,
R,
where 72, in turn has a strong dependence on frequency. Hence, a V ( f ) curve can be obtained for a particular layered material. Note that, the ex- pression above does not include the frequency response of the transducer.W . V ( f ) CURVES
The output signal, V, of the Lamb wave lens reaches a maxi- mum when the frequency of excitation is such that the angle of incidence matches a Lamb wave mode critical angle. If the fre- quency does not satisfy this criterion the output signal is smaller. As the frequency is scanned, a characteristic V(f) curve is traced where the peaks signify the existence of modes. The V(f) curve is highly dependent on the phase transitions of the reflection coef- ficient. Since, any perturbation of elastic or physical parameters such as the thickness, density or elastic constants of the layer causes a shift in the position of the phase transitions, a shift in the positions of V(f) peaks is also expected. When the distance between the lens and the object, 2, is chosen to be less than a certain value, the output signal contains no specular components. In this case, the dependence of V on 2 variations is weak.
1.5 I I
-
Good Bond 1.0-
Y 0.5 0.0 0.8 0.8 1 .o 1.2-
Good Bond - Slippery BondI
1.0-
Y 0.5 0.0 0.8 0.8 1 .o 1.2Figure 3: Calculated V(f) curves for a good bond (solid), a slippery bond (dashed), and with perturbed layer parameters for a 6pm aluminum layer on silicon substrate
The material property discrimination ability of the Lamb wave lens is investigated by simulating the performance of a lens de- signed for operation in the 0.8 - 1.3 GHz range. For this lens
RI
= 42pm andRz
= 150pm. The sample used in simulationis a silicon substrate with a 6 pm thick aluminum layer. Fig. 3 shows the V ( f ) curve expected from this sample. Each peak
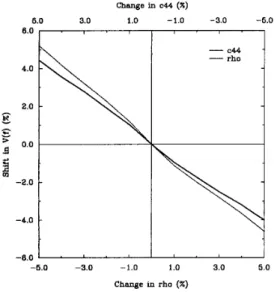
corresponds t o a different Lamb wave mode. In the same figure, V(f) curve for a slippery layer-substrate boundary is also shown. Here, the bond between the aluminum layer and the silicon sub- strate is assumed t o be slippery in the lateral direction. Since the reflection coefficient is drastically changed, the V ( f ) peaks shift in position. To see the parameter sensitivity of the method, we made simulations with perturbed values of parameters and observed the resultant change in the V ( f ) curves. As c44 of the layer material is increased, the peaks of V(f) shift toward higher frequencies, but the structure is preserved for small changes. The sensitivity to this parameter as measured by the ratio of relative peak frequency shift to fractional change in parameter is about 1. In other words, a 5% change in c44 causes nearly 5% shift in the peak positions. Similarly, a reduction in layer density, p, causes a shift in the same direction as shown in Fig. 3. Correspond- ing sensitivity figure for the layer density is slightly higher. The layer c11 and substrate parameters are found to have negligible effect. The shear velocity of the layer material has the greatest influence. 1.5 1.0 A v > 0.5 0.0
-
Good' Bond ' - Slippery Elxp. Good Bond Bond)a Elxp. [Slippery Bond)
5.0 7.0 9.0 11.0
f (mz)
Figure 4: V(f) curves for a 0.9 mm thick copper layer on an aluminum substrate with good and slippery bonds (measured and theoretical).
Realizability of V(f) characterization is experimentally tested by a lens working at 5-9 MHz range. A test sample, made by bonding 0.9 mm thick copper layer on an aluminum substrate, is scanned with this lens. The quality of bonding was not perfect, probably with some air bubbles at the interface. In Fig. 4, the measured V ( f ) values are compared with the calculated curve. The curves presented in the figure are obtained by normalizing the transducer output by the amplitude of the received signal under the specular reflection condition. Since the normalization is done both on experimental data and on calculated results, the effects of the frequency response of the transducer is eliminated.
Change 6.0 3.0 1.0 6.0 c44 (X) -1.0 -3.0 -6.0 -5.0 -3.0 -1.0 1 .o 3.0 5.0 Change in rha (56)
Figure 5: Calculated percentage shift in V ( f ) as a function of percentage changes in layer p and c44.
In the same figure, the calculated curve for the slippery bond case is also depicted. Some measured V ( f ) data for certain regions on the sample resembles this curve and such a measurement is
also indicated in the same figure.
Inversion of V ( 2 ) [12] of the conventional acoustic microscope results in the reflection coefficient which in turn gives informa- tion about the critical angles. To be able to perform the V ( 2 )
inversion operation, the phase of the received signal must also be available. This is a difficult task. On the other hand, the critical angle information is available from the V ( f ) curves directly with- out a need for inversion. V ( f ) curves result in peaks at positions corresponding to the critical angles of Lamb wave modes. The positions of the peaks are most affected by the nature of the bond (good
/
slippery) and by the shear elastic constant and density of the layer. Fig. 5 shows the calculated percentage shift in the peak positions as a function of changes in some layer parameters. One can estimate the value of a parameter by the position of the peaks, provided that the other parameter stays unchanged.CONCLUSIONS
The Lamb wave lens can substitute the conventional lens in acoustic microscopes for some applications due to its inherent ability to focus waves in a subsurface layer with a high efficiency. The new lens is suited to image layered structures with little lateral variation. A simple frequency scan results in a character- istic V ( f ) curve strongly dependent on the elastic parameters of the layer material. The positions of the V ( f ) peaks may be di-
rectly related t o these parameters. This characterization method clearly delineates various modes of leaky Lamb waves uninter- fered with specdarly reflected bulk waves.
References
[l] P.A. Reinholdtsen, C-H. Chou, and B.T. Khuri-Yakub “Quantitative acoustic microscopy using amplitude and phase imaging,” in Proc. of IEEE 1987 Ultrasonics Sym- posium, pp. 807-811,1987.
[2] J.M.R. Weaver, C.M.W. Daft, and G.A.D. Briggs “A quan- titative acoustic microscope with multiple detection modes,”
IEEE Tmns. Ultrason. Ferroelect. Fnq. Cont., vol. 36, pp. 554-560,1989.
[3] B. Derby, G.A.D. Briggs, and E.R. Wallach “Non- destructive testing and acoustic microscopy of diffusion bonds,“ J. Mater. Sci., vol. 18, 1983.
[4] D.A. Sinclair, I.R. Smith, and S.D. Bennett “Elastic con- stants measurement with a digital acoustic microscope,”
IEEE Tmns. Sonics Ultrason., vol. 31, pp. 271-278,1984. [5] J. Kushibiki, T. Ueda, and N. Chubachi “Determination of
elastic constants by LFB acoustic microscope,n in Proc. of
IEEE 1987 Ultrasonics Symposium, pp. 817-821,1987. [6] S.W. Meeks, D. Peter,
D.
Home, K. Young, and V. Novotny“Residual stress mapping with a scanning phase-measuring acoustic microscope,” in Proc. of IEEE Ultrasonics Sympo- sium, pp. 809-812,1989.
[7] G.L. Fitzpatrick, B.P. Hildebrand, and A.J. Boland “Leaky elastic interface waves and images of subsurface material properties,” in Rev. Prog. Quan Nondes. Eval., volume 3, pp. 1185-1194, New York, 1984. Plenum.
[SI G.C. Smith and M.G. Gee “Observation of a sub-surface defect in sapphire by Rayleigh wave reflection in the scan- ning acoustic microscope,” J . Mater. Sci. Lett., vol. 5, pp. 1133-1134,1986.
[9] A. Atalar and H. Koymen “A high efficiency Lamb wavelens for subsurface imaging,” in Proc. of IEEE 1989 Ultrasonics Symposium, pp. 813-816,1989.
[lo] D.B. Bogy and S.M. Gracewski “Reflection coefficient for plane waves in a fluid incident on a layered elastic half- space,”
J.
Appl. Mech., vol. 50, pp. 405414,1983. [ll] T. Kundu, A.K. Mal, and R.D. Weglein “Calculation of theacoustic material signature of a layered solid,” J. Acoust.
Soc. Am., vol. 77, pp. 353-361,1985.
[12] K.K. Liang, G.S. Kino, and B.T. Khuri-Yakub “Material characterization by inversion of V(Z),” IEEE Tmns. Sonics
Ultrason., vol. 32, pp. 213-224,1985.
[13] D.E. Chimenti, A.H. Nayfeh, and D.L. Butler “Leaky J. Appl. Phys., Rayleigh waves on a layered halfspace,”
vol. 53, pp. 170-176,1982.
[14] D.E. Chimenti and A.H. Nayfeh “Leaky Lamb waves in fibrous composite laminates,” J. Appl. Phys., vol. 58, pp. 45314538,1985.