[15:03 16/5/2011 Bioinformatics-btr178.tex] Page: 1583 1583–1584
BIOINFORMATICS
APPLICATIONS NOTE
Vol. 27 no. 11 2011, pages 1583–1584doi:10.1093/bioinformatics/btr178Systems biology
Advance Access publication April 9, 2011Reliability-Oriented bioinformatic networks visualization
Ahmet Emre Alada ˘g
1, Cesim Erten
1,∗, Melih Sözdinler
21Department of Computer Engineering, Kadir Has University, Cibali, Istanbul 34083 and2Department of Computer Engineering, Bogaziçi University, Bebek, Istanbul 34342 Turkey
Associate Editor: Trey Ideker
ABSTRACT
Summary: We present our protein-protein interaction (PPI) network
visualization system RobinViz (reliability-oriented bioinformatic
networks visualization). Clustering the PPI network based on gene ontology (GO) annotations or biclustered gene expression data, providing a clustered visualization model based on a
central/peripheral duality, computing layouts with algorithms
specialized for interaction reliabilities represented as weights, completely automated data acquisition, processing are notable features of the system.
Availability: RobinViz is a free, open-source software protected
under GPL. It is written in C++ and Python, and consists of almost 30 000 lines of code, excluding the employed libraries. Source code, user manual and other Supplementary Material are available for download at http://code.google.com/p/robinviz/.
Contacts: [email protected]
Supplementary information: Supplementary data are available at
Bioinformatics online.
Received on December 29, 2010; revised on March 13, 2011; accepted on March 31, 2011
1 INTRODUCTION
An observation applicable to most PPI networks is that they contain proteins and interactions in large quantities. From an information visualization perspective, it is not desirable to present the drawing of a large graph at a single shot for readability purposes. A classical technique employed commonly in the graph drawing field is clustered visualizations. In PPI settings, simply applying this technique out of a blackbox without incorporating suitable biological semantics is usually not enough. We construct a visualization model that applies the clustered visualization technique on the PPI networks domain by incorporating biological data in the form of GO annotations and gene expression analysis results. The core of the model consists of the central/peripheral duality to represent the clustered visualization. Central view contains an abstract graph representing a clustering of the PPI network based on GO annotations or biclustering analysis of gene expression data. Each central cluster has its own peripheral window for a detailed view and analysis of intracluster interactions. Within this model, both the created abstract graphs and the PPI network itself are weighted. Edge weights in the PPI network represent the reliability of the interactions, whereas those in the created abstract graphs represent the abundance of reliable cross-talks between clusters. An additional feature of RobinViz is its incorporation of these weights
∗To whom correspondence should be addressed.
in the layout algorithms of all the involved graphs. Finally, the incorporation of biclustering of gene expression data within the PPI visualization model of RobinViz may prove to be of value in its own for biclustering analysis. Although several systems (Iragne
et al., 2005; Shannon et al., 2003; Smoot et al., 2011; Vlasblom et al., 2006) incorporate the mentioned biological concepts in
their PPI network visualizations in various ways, the suggested visualization model is more general and intuitive. Moreover, the reliability orientation of the layout algorithms designed specifically for this purpose is not reflected in most of the suggested systems; see Supplementary Material for a detailed comparison of RobinViz with other related systems.
2 SYSTEM OVERVIEW
RobinViz is designed with a non-programmer user in mind. Therefore, no data formatting or data processing is necessary from the user’s perspective. The only interaction is with a user-friendly wizard and all the data acquisition, filtering and processing are done automatically according to user’s selections provided in a sequence of dialogue boxes. With respect to the actual data usage, the current version of RobinViz implements real-time data retrieval from five major online databases: Biogrid (Stark et al., 2006) for the input PPI network construction, Hitpredict (Patil et al., 2010) for the assignment of interaction reliability values, GO tree (Carbon
et al., 2009) for determining partitioning categories when the
co-ontology concept is in use, GO annotations (Ashburner et al., 2000) for the actual network partitioning according to category–gene associations and GEO (Barrett and Edgar, 2006) for determining the expression matrix to apply biclustering on when co-expression is in use. Furthermore, RobinViz enables online automatic updates to extract the most recent versions of these databases. To construct the underlying PPI network to be visualized, user can select multiple experiments from multiple organisms in the appropriate dialogue box. Since various data sources with possibly different naming conventions are employed, we construct an SQLite database which allows the system to do conversions between multiple naming conventions. Appropriate repositories are downloaded from the BioGrid database and the protein names are unified. The data from all the interactions are merged and an underlying PPI network is constructed. The network is further amended with interaction reliability values by collecting the reliabilities from the HitPredict database, normalizing them and associating each with the corresponding interaction.
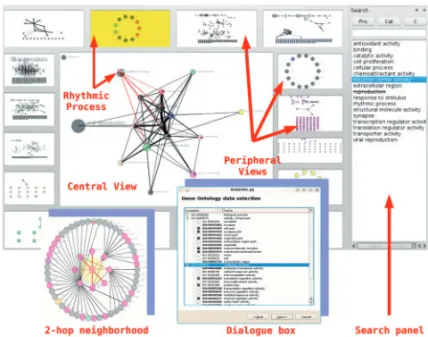
In order to integrate biological verification data in visualization, we provide a two-level visualization model: central view graph and peripheral view graphs; see Figure 1. Both types of graphs
© The Author 2011. Published by Oxford University Press. All rights reserved. For Permissions, please email: [email protected] 1583
[15:03 16/5/2011 Bioinformatics-btr178.tex] Page: 1584 1583–1584 A.E.Alada ˘g et al.
Fig. 1. Snapshot depicting some of the concepts discussed in the text.
are weighted. Each central node is a collection of proteins from the underlying PPI network. An edge between a pair of central nodes corresponds to the union of interactions between the proteins included in them. Associated with each central node, there is a peripheral view graph containing all of its proteins and the edges connecting them in the underlying network. If co-ontology is used as the verification concept of choice, each user-selected category from the provided GO tree becomes a central node. Next a set of GO annotation resources are selected by the user to assign the proteins associated with that node. The marked annotations are merged and filtered according to the set of categories. The user may also choose co-expression as the verification concept. In this case, one of the three popular biclustering algorithms from literature, CC, BIMAX and REAL implemented within the system are presented as alternatives. Once the algorithm and its specific parameters are decided, the biclusters are computed accordingly. The set of proteins corresponding to the genes found in each bicluster constitutes a central node. Edges and the peripheral views are then computed as described previously. With regards to the weights, if the co-ontology concept is in use the weight of a central node is determined by the
PPI hit ratio, a combined measure of the size of the corresponding
PPI subnetwork in the peripheral view and of the density of the high reliability interactions in it. With the co-expression concept, user is provided with additional options including H-value and
functional enrichment values—common measures of biclustering
correlation. The weight of an edge between two central nodes is the weighted sum of the reliability values of interactions between the proteins included in them. Finally, the interaction reliability value itself is the weight assigned to a peripheral graph edge. With such a visualization model, each edge in the central graph provides clues of potential false positives of the underlying PPI network as far as the provided verification concept and the corresponding central nodes are concerned. Analogously, each disconnected pair of proteins in a peripheral view provides information regarding the false negatives. We note that the verification process may also be viewed from
the opposite direction, giving rise to a bidirectional verification model; see Supplementary Material for further details. With regards to the layout computations, we note that drawing constraints of weighted graphs are not the same as those of unweighted graphs. In drawings of weighted graphs, the neighborhood of a heavy-weight node should not be too cluttered, heavy-weight edges should not be too long and the crossings between heavy-weight edges should be avoided. We provide weighted extensions of the popular graph drawing algorithms in use, including the Spring Embedder, the Sugiyama Style Layered Drawing and various circular-track based methods, each extension aiming to satisfy the mentioned constraints. A node coloring mechanism is embedded in the system to provide further clues on GO categories. Each node in a peripheral view is drawn as a colored pie. Each color represents a high-level GO category that the protein corresponding to the node is associated with. The pie chart of a central node is colored according to the colors of the nodes in the corresponding PPI subnetwork thus giving a clue regarding the high-level GO categories inside the corresponding peripheral view. Further details regarding a node can be obtained by right clicking on the node. Enrichment analysis results including Bonferroni corrected P-values and enrichment
ratios based on high-level GO functional categories are available.
A second option available to nodes from both views is the online information. To investigate the interactions of a specific protein in more detail, user can display 1-hop or 2-hop neighborhood of a specific protein from a peripheral view. We note that in this case not only the interactions residing in the peripheral view graph but also all the interactions from the underlying PPI network are visualized. In the co-expression mode, heatmap and parallel coordinate visualizations are also generated for a detailed analysis of the bicluster corresponding to a central node. Further aids include search panel, selection focus, animation aids, session save/load capabilities, and preconfigured parameter settings.
Funding: The Scientific and Technological Research Council of
Turkey (TUBITAK; 109E071, in part), TUBITAK, BIDEB (to M.S.).
Conflict of Interest: none declared.
REFERENCES
Ashburner,M. et al. (2000) Gene Ontology: tool for the unification of biology. Nat.
Genet., 25, 25–29.
Barrett,T. and Edgar,R. (2006) Gene expression omnibus: microarray data storage, submission, retrieval, and analysis. Methods Enzymol., 411, 352–369.
Carbon,S. et al. (2009) AmiGO: online access to ontology and annotation data.
Bioinformatics, 25, 288–289.
Iragne,F. et al. (2005) Proviz: protein interaction visualization and exploration.
Bioinformatics, 21, 272–274.
Patil,A. et al. (2010) HitPredict: a database of quality assessed protein–protein interactions in nine species. Nucleic Acids Res., 39, D744–D749.
Shannon,P. et al. (2003) Cytoscape: a software environment for integrated models of biomolecular interaction networks. Genome Res., 13, 2498–2504.
Smoot,M. et al. (2011) PiNGO: a Cytoscape plugin to find candidate genes in biological networks. Bioinformatics, 27, 1030–1031.
Stark,C. et al. (2006) Biogrid: a general repository for interaction datasets. Nucleic
Acids Res., 34 (Suppl. 1), D535–D539.
Vlasblom,J. et al. (2006) Genepro: a cytoscape plug-in for advanced visualization and analysis of interaction networks. Bioinformatics, 22, 2178–2179.
1584