IMAGE PROCESSING METHODS FOR
COMPUTER-AIDED INTERPRETATION OF
MICROSCOPIC IMAGES
a thesis
submitted to the department of electrical and
electronics engineering
and the graduate school of engineering and science
of bilkent university
in partial fulfillment of the requirements
for the degree of
master of science
By
Musa Furkan Keskin
September, 2012
I certify that I have read this thesis and that in my opinion it is fully adequate, in scope and in quality, as a thesis for the degree of Master of Science.
Prof. Dr. A. Enis C¸ etin(Advisor)
I certify that I have read this thesis and that in my opinion it is fully adequate, in scope and in quality, as a thesis for the degree of Master of Science.
Asst. Prof. Dr. Sinan Gezici
I certify that I have read this thesis and that in my opinion it is fully adequate, in scope and in quality, as a thesis for the degree of Master of Science.
Assoc. Prof. Dr. U˘gur G¨ud¨ukbay
Approved for the Graduate School of Engineering and Science:
Prof. Dr. Levent Onural Director of the Graduate School
ABSTRACT
IMAGE PROCESSING METHODS FOR
COMPUTER-AIDED INTERPRETATION OF
MICROSCOPIC IMAGES
Musa Furkan KeskinM.S. in Electrical and Electronics Engineering Supervisor: Prof. Dr. A. Enis C¸ etin
September, 2012
Image processing algorithms for automated analysis of microscopic images have become increasingly popular in the last decade with the remarkable growth in computational power. The advent of high-throughput scanning devices allows for computer-assisted evaluation of microscopic images, resulting in a quick and unbiased image interpretation that will facilitate the clinical decision-making pro-cess. In this thesis, new methods are proposed to provide solution to two image analysis problems in biology and histopathology.
The first problem is the classification of human carcinoma cell line images. Cancer cell lines are widely used for research purposes in laboratories all over the world. In molecular biology studies, researchers deal with a large number of specimens whose identity have to be checked at various points in time. A novel computerized method is presented for cancer cell line image classification. Microscopic images containing irregular carcinoma cell patterns are represented by subwindows which correspond to foreground pixels. For each subwindow, a covariance descriptor utilizing the dual-tree complex wavelet transform (DT-CWT) coefficients as pixel features is computed. A Support Vector Machine (SVM) classifier with radial basis function (RBF) kernel is employed for final classification. For 14 different classes, we achieve an overall accuracy of 98%, which outperforms the classical covariance based methods.
Histopathological image analysis problem is related to the grading of follicular lymphoma (FL) disease. FL is one of the commonly encountered cancer types in the lymph system. FL grading is based on histological examination of hematoxilin and eosin (H&E) stained tissue sections by pathologists who make clinical deci-sions by manually counting the malignant centroblast (CB) cells. This grading
iv
method is subject to substantial inter- and intra-reader variability and sampling bias. A computer-assisted method is presented for detection of CB cells in H&E-stained FL tissue samples. The proposed algorithm takes advantage of the scale-space representation of FL images to detect blob-like cell regions which reside in the scale-space extrema of the difference-of-Gaussian images. Multi-stage false positive elimination strategy is employed with some statistical region properties and textural features such as gray-level co-occurrence matrix (GLCM), gray-level run-length matrix (GLRLM) and Scale Invariant Feature Transform (SIFT). The algorithm is evaluated on 30 images and 90% CB detection accuracy is obtained, which outperforms the average accuracy of expert hematopathologists.
Keywords: Cancer Cell Line Classification, Dual-Tree Complex Wavelet
Trans-form, Covariance Descriptors, Follicular Lymphoma Grading, Scale-Space Repre-sentation, Centroblast Detection, Blob Detection, Scale Invariant Feature Trans-form.
¨
OZET
M˙IKROSKOP˙IK G ¨
OR ¨
UNT ¨
ULER˙IN B˙ILG˙ISAYAR
DESTEKL˙I YORUMLANMASI ˙IC
¸ ˙IN ˙IMGE ˙IS
¸LEME
Y ¨
ONTEMLER˙I
Musa Furkan Keskin
Elektrik ve Elektronik M¨uhendisli˘gi B¨ol¨um¨u, Y¨uksek Lisans Tez Y¨oneticisi: Prof. Dr. A. Enis C¸ etin
Eyl¨ul, 2012
Hesaplama g¨uc¨undeki kayda de˘ger b¨uy¨ume ile birlikte, imge i¸sleme algorit-malarının mikroskopik g¨or¨unt¨ulerin otomatik analizinde kullanımı son on yılda giderek pop¨uler hale gelmi¸stir. Y¨uksek i¸slem hacimli tarama cihazlarının or-taya ¸cıkı¸sı mikroskopik g¨or¨unt¨ulerin bilgisayar destekli yorumlanmasına imkan tanımı¸stır. Bu geli¸sme, klinik karar alma s¨ure¸clerini kolayla¸stıracak olan hızlı ve objektif g¨or¨unt¨u yorumlama sonucunu do˘gurmu¸stur. Bu tezde, biyoloji ve histopatoloji alanlarından iki g¨or¨unt¨u analizi problemine ¸c¨oz¨um ¨uretme amacıyla, yeni y¨ontemler sunulmu¸stur.
Bu problemlerden ilki, insandan elde edilen kanser h¨ucre ¸cizgi g¨or¨unt¨ulerinin sınıflandırılmasıdır. Kanser h¨ucre ¸cizgileri t¨um d¨unyada laboratuvarlarda ara¸stırma amacıyla yaygın bir bi¸cimde kullanılmaktadır. Molek¨uler biyoloji ¸calı¸smalarında ara¸stırmacılar, ait oldu˘gu sınıf s¨urekli olarak do˘grulanması gereken ¸cok sayıda numune ile ¸calı¸smaktadır. Kanser h¨ucre ¸cizgi g¨or¨unt¨ulerinin sınıflandırılması i¸cin ¨ozg¨un bir bilgisayar destekli y¨ontem sunulmu¸stur. D¨uzensiz kanser h¨ucre paternleri i¸ceren mikroskop g¨or¨unt¨uleri, ¨onplan piksellerine kar¸sılık gelen yerel pencereler ile temsil edilmi¸stir. Her yerel pencere i¸cin, ¸cift-a˘ga¸c karma¸sık dalgacık d¨on¨u¸s¨um¨u (DT-CWT) katsayılarını piksel ¨oznitelikleri olarak kullanan bir kovaryans tanımlayıcısı hesaplanmı¸stır. Sınıflandırma amacıyla RBF ¸cekirdekli Destek Vekt¨or Makinası (SVM) kullanılmı¸stır. 14 farklı sınıf i¸cin, % 98 ortalama do˘gruluk oranı elde edilmi¸stir, ki bu klasik kovaryans tabanlı y¨ontemlerden daha iyi bir sonu¸ctur.
Histopatolojik g¨or¨unt¨u analizi problemi ise folik¨uler lenfoma (FL) hastalı˘gının derecelendirilmesi ile ilgilidir. FL, lenf sisteminde sık kar¸sıla¸sılan kanser
vi
¸ce¸sitlerinden biridir. FL derecelendirmesi, hematoksilin ve eozin (H&E) ile leke-lendirilmi¸s doku par¸calarının patologlar tarafından histolojik incelemeye tabi tu-tulması ile ger¸cekle¸stirilir ve patologlar k¨ot¨u huylu sentroblast (CB) h¨ucrelerini el ile sayarak klinik kararlar alırlar. Bu derecelendirme y¨ontemi, g¨ozlemci i¸cinde ve g¨ozlemciler arasında ciddi bir de˘gi¸skenlik ve ¨ornekleme kaynaklı hatalar ile kar¸sı kar¸sıyadır. H&E lekeli FL doku ¨orneklerinde CB h¨ucrelerinin tespiti amacıyla bilgisayar destekli bir y¨ontem sunulmu¸stur. Onerilen algoritma, Gauss farkı¨ g¨or¨unt¨ulerinin ¨ol¸cek-alan u¸cde˘gerlerinde yer alan blob benzeri h¨ucre b¨olgelerini tespit etmek i¸cin, FL g¨or¨unt¨ulerinin ¨ol¸cek-alan temsilinden faydalanmaktadır. Bazı istatistiksel b¨olge ¨oznitelikleri ve gri-d¨uzey birliktelik matrisi (GLCM), gri-d¨uzey sıra-uzunluk matrisi (GLRLM) ve ¨Ol¸cek De˘gi¸simsiz ¨Oznitelik D¨on¨u¸s¨um¨u (SIFT) gibi dokusal ¨oznitelikler kullanılarak, ¸cok a¸samalı yanlı¸s alarm eleme stratejisi uygulanmı¸stır. Algoritma, 30 g¨or¨unt¨u ¨uzerinde de˘gerlendirilmi¸s ve %90 CB tespit do˘gruluk oranı elde edilmi¸stir. Bu oran, uzman hematopatologların ortalama do˘gruluk oranından ¨ust¨und¨ur.
Anahtar s¨ozc¨ukler : Kanser H¨ucre C¸ izgisi Sınıflandırılması, C¸ ift-A˘ga¸c Karma¸sık Dalgacık D¨on¨u¸s¨um¨u, Kovaryans Tanımlayıcıları, Folik¨uler Lenfoma Derece-lendirilmesi, Ol¸cek-Alan Temsili, Sentroblast Tespiti, Blob Tespiti,¨ Ol¸cek¨ De˘gi¸simsiz ¨Oznitelik D¨on¨u¸s¨um¨u.
Acknowledgement
I would like to express my gratitude to Prof. Dr. Enis C¸ etin for his supervision, guidance and suggestions throughout the development of this thesis.
I would also like to thank Asst. Prof. Dr. Sinan Gezici and Assoc. Prof. Dr. U˘gur G¨ud¨ukbay for reading, commenting and making suggestions on this thesis.
I wish to extend my thanks to all friends and colleagues for their valuable help in the development of this thesis.
I would also like to thank T ¨UB˙ITAK for providing financial support through-out my graduate study.
I would like to thank my colleagues in Clinical Image Analysis Laboratory at The Ohio State University for their support during my Columbus days. Special thanks to Assoc. Prof. Dr. Metin Nafi G¨urcan and Dr. Khalid Niazi.
I would like to express my special thanks to my family and my fiancee for their sincere love, support and encouragement.
Contents
1 Introduction 1
2 Human Cancer Cell Line Classification in Microscopic Images 5
2.1 Related Work on Cancer Cell Line Classification . . . 8
2.1.1 Dual-Tree Complex Wavelet Transform . . . 8
2.1.2 Directional Differences . . . 10
2.1.3 Covariance Descriptor . . . 11
2.2 Image Segmentation and Subwindow Selection . . . 13
2.3 DT-CWT and Covariance Based Feature Extraction . . . 16
2.4 Classification Algorithm . . . 24
2.5 Cancer Cell Line Image Dataset . . . 25
2.6 Experimental Results . . . 26
2.7 Summary . . . 30
3 Detection of Centroblasts in Follicular Lymphoma Images Using
CONTENTS ix
3.1 Related Work on Follicular Lymphoma Grading . . . 33
3.2 The Detection Procedure . . . 35
3.3 Centroblast Detection via Scale-Space Approach . . . 37
3.3.1 Nonlinear Filtering Based FL Image Binarization . . . 38
3.3.2 Detection of Cells Using Scale-Space Image Representation 40 3.4 Cell Classification . . . 44
3.4.1 FP Elimination Using Size Information . . . 44
3.4.2 Statistical Features . . . 45 3.4.3 Textural Features . . . 46 3.4.4 SIFT Descriptor . . . 46 3.4.5 Classifier Learning . . . 47 3.5 Experimental Results . . . 49 3.6 Summary . . . 57 4 Conclusions 58 Bibliography 61
List of Figures
2.1 Sample cancer cell line image from BT-20 class viewed at 20× magnification . . . 6
2.2 Sample cancer cell line image from MV class viewed at 20× mag-nification . . . 7
2.3 Filterbanks for the dual-tree complex wavelet transform . . . 9
2.4 Image masks obtained (a) after EM segmentation and (b) after closing and median filtering on top of EM output using the image in Figure 2.1 . . . 15
2.5 Random subwindow selection process on a sample cancer cell line image . . . 16
2.6 2D analytic complex wavelet obtained from two 1D analytic com-plex wavelets . . . 18
2.7 Oriented 2D wavelet given by the real part of the analytic 2D wavelet 19
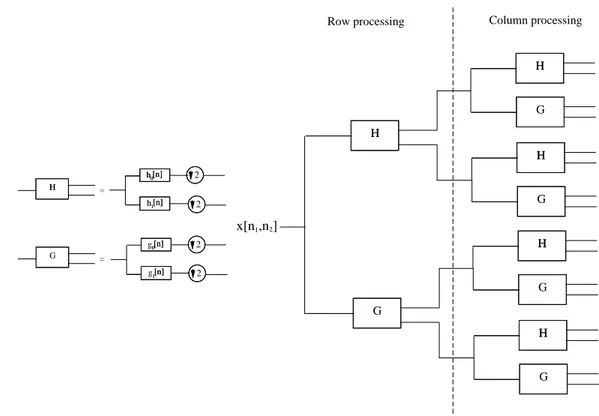
2.8 Implementation scheme of the 2D DT-CWT. Four real separable DWT’s are employed in 2D DT-CWT. . . 20
2.9 Sample image. . . 21
LIST OF FIGURES xi
3.1 Sample image of H&E-stained FL tissue sections at 40x magnifi-cation. . . 33
3.2 Sample images of a typical (a) centroblast cell and (b) non-centroblast cell. . . 34
3.3 Sample simulated (a) and real (c) images along with the detection results (b), (d) indicating the blob-like structures in the images by using red circles whose radius is determined from the scale at which the blob is detected . . . 36
3.4 Image processing pipeline for the proposed CB detection system. . 37
3.5 Detection results for a sample image patch showing (a) the original version and (b) the binarized version . . . 39
3.6 Cellular region detection results for a sample image patch using (a) the original image and (b) the binarized image . . . 41
3.7 Scatter plot of statistical and textural (GLCM and GLRLM) fea-tures extracted from cropped cells of training images . . . 48
3.8 Scatter plot of SIFT features extracted from cropped cells of train-ing images . . . 49
3.9 ROC curve of average sensitivity (%) versus average number of false positives in the test set for (a) N path = 1 and (b) N path = 2 53
3.10 ROC curve of average sensitivity (%) versus average number of false positives in the test set for (a) N path = 3 and (b) N path = 4 54
3.11 ROC curve of average sensitivity (%) versus average number of false positives in the test set for (a) N path = 5 and (b) N path = 6 55
List of Tables
2.1 Impulse Response of Kingsbury’s 8thOrder Q-shift Analysis Filters for the Dual-Tree CWT . . . 17 2.2 Sizes of the Covariance Matrices Used . . . 24
2.3 Names of Cancer Cell Lines Used in This Study . . . 25
2.4 Overall Image and Subwindow Classification Accuracies in (%) of the Covariance and Normalized Covariance Methods for 10x Can-cer Cell Line Image Dataset . . . 27
2.5 Overall Image and Subwindow Classification Accuracies in (%) of the Covariance and Normalized Covariance Methods for 20x Can-cer Cell Line Image Dataset . . . 28
2.6 Overall Image and Subwindow Classification Accuracies in (%) of the Covariance and Normalized Covariance Methods for 40x Can-cer Cell Line Image Dataset . . . 29
3.1 Results of the 1st FP Elimination Stage . . . . 50
3.2 Results of the 1st FP Elimination Stage Without Binarization . . 51
3.3 Feature Sets Used in Cell Classification . . . 52
Chapter 1
Introduction
Computer-aided clinical image analysis has attracted huge interest from both sig-nal processing and medical researchers due to its potential to surmount the chal-lenges associated with the subjective examination of microscopic images. Quanti-tative tools for characterization of biomedical images mitigate the effects of inter-and intra-reader variability on diagnosis inter-and complement the clinical decision by acting as a second reader. Computer-assisted diagnosis (CAD) systems can prevent pathologists from wasting their time on image regions where decisions can be made in a straightforward manner; the percentage of the benign prostate biopsies in the U.S. is around 80%, which may be handled by computerized image analysis, leaving more space for pathologists to deal with challenging cases [1]. Biologists would also need automated tools to discriminate between a large num-ber of different cell types since the biochemical tests performed for identification of cells may be very costly. The goal of this thesis is to develop new algorithms for computer-aided analysis of biomedical images by employing image processing and machine learning techniques. The main objective is to devise automated methods for feature detection, extraction and classification that would provide robust interpretation of biological and histopathological images.
In this thesis, two different microsopic image analysis problems are considered. The first part of the thesis focuses on the discrimination of human carcinoma cell line images which are widely used in molecular biology studies. The identity of
cancer cell lines that are employed in cancer research needs to be verified recur-ringly during a research project. Distinct morphologies of different types and even sub-types of cancer cells reflect, at least in part, the underlying biochemi-cal differences, i.e., gene expression profiles [2]. The morphology of cancer cells can infer invasiveness of tumor cell and hence the metastatic capability. Hu-man cancer cell lines are also utilized in drug screening and development [3]. Hence, mislabeling cell lines or failure to recognize any contamination may lead to misleading results. It is of vital importance to incorporate an automated mor-phological analysis tool for cancer cells during molecular biology research, that will enable the correct detection and labelling of different cell lines. The change in morphologies upon treatment with agents that induce cellular responses such as cell death or cell growth arrest can also be distinguished with such algorithms [4]. Currently, short tandem repeat (STR) analysis is being used as a standard for the authentication of human cell lines. However, this process takes a long time and has to be carried out by an expert. Automated analysis, on the other hand, will provide the scientists a fast and easy-to-use tool that they can use in their own laboratories to verify their cell lines.
In this thesis, dual-tree complex wavelet transform (DT-CWT) based feature extraction and classification method is developed to differentiate distinct types of cancer cell line images. DT-CWT is a recently developed image decomposi-tion method that possesses orientadecomposi-tion selectivity and shift invariance properties lacking in the classical discrete wavelet transform. It has been used in a va-riety of signal and image processing tasks including denoising [5], classification [6], texture analysis [7], compression [8] and watermarking [9]. In DT-CWT, two maximally decimated discrete wavelet transforms are executed in parallel, where the wavelet functions of two different trees form an approximate Hilbert transform pair, thereby leading to a directionally selective and shift invariant transform [10]. Region covariance descriptors are utilized to construct feature matrices from DT-CWT complex coefficient magnitudes in detail subbands at several decomposition scales. In the region covariance framework each pixel is mapped to a set of pixel properties whose covariances are measured and used
as a region descriptor [11]. It is experimentally observed that the proposed DT-CWT based algorithm generates distinctive features and is superior to classical covariance based methods.
The second microscopic image analysis problem that is addressed in the the-sis concerns histopathology imagery. Follicular lymphoma (FL) grading using computer-assisted image analysis is investigated. FL is a cancer type arising in the lymphatic system and it is one of the most commonly encountered lymphoid malignancies in the western world [12]. As recommended by World Health Or-ganization, grading of FL relies on histological examination of hematoxilin and eosin (H&E)-stained tissue sections by pathologists who manually count the av-erage number of large cancerous cells called centroblasts (CB) in ten standard microscopic high-power fields (HPF) and assign each FL case to one of the three grades based on the average CB count per HPF [13]. Qualitative evaluation of FL images by human readers poses serious problems such as inter- and intra-observer variability and sampling bias [14]. Since the choice of ten HPFs for counting CBs is random, heteregenous distribution of malignant cells would make the grading method biased. Moreover, manual counting is a time-consuming and laborious task for pathologists. Computer-aided FL prognosis system is highly required in a clinical setting to guide the pathologist and help reach more accurate clinical decisions. In the literature, model-based intermediate representations (MBIR) are employed to model the distribution of cytological components in FL images and perform grading on an image level [15]. Adaptive likelihood [16] and local fourier transform (LFT) [17] based cell segmentation approaches are also utilized for FL grading.
A new algorithm is proposed in this thesis for computer-aided detection of CB cells in FL images using scale-space representations, which can be defined as the collection of images obtained by successive convolutions with a scale-space kernel. The intuition behind this approach is that CB and non-CB (centrocyte) cells appear as dark blob-like regions in each channel of the H&E stained RGB images of FL. Utilizing the fact that scale-space extrema of the difference-of-Gaussian images correspond to blob-like structures in the image [18], a modified version of the Scale-Invariant Feature Transform (SIFT) algorithm [19] is used
to identify salient regions, which, in this case, are CB and non-CB cells. Iden-tification of candidate CB regions is followed by false positive reduction stages. Most of the false positives can be eliminated based on size information inherently provided by the scale-space processing. At later stages, statistical region fea-tures, co-occurrence and run-length properties and SIFT descriptor encoding the texture distribution are employed to further reduce the number of non-CB cells. A comparative analysis of different feature sets points to the fact that SIFT is effective in feature detection, but is outperformed by other texture descriptors in the phase of feature extraction from cell regions. Sensitivity of the whole system is found to be better than the average sensitivity of six expert board-certified pathologists.
The rest of the thesis is organized as follows. Chapter 2 presents the DT-CWT and covariance based image classification framework developed for differentiation of human cancer cell lines. In Chapter 3, a computer-assisted method utilizing the scale-space image representation is proposed to detect centroblast cells for follicular lymphoma grading. In the last chapter, conclusions are made and the contributions are highlighted.
Chapter 2
Human Cancer Cell Line
Classification in Microscopic
Images
Cancer cell lines are cancer cells derived from human body, which are cultivated in a laboratory environment. They may proliferate in time and spread over dishes where they were first seeded. Human cancer cell lines constitute essential research instruments in scientific molecular biology studies [20, 21]. They are widely uti-lized in cancer research and drug discovery. However, use of cell lines suffers greatly from cross-contamination with other cell lines [22], misidentification and over-subculturing [21], which may lead to misleading, irrelevant research results and wasting of millions of dollars invested in cancer research [23]. The frequency of inter- and intra-species cross-contamination can be as high as 18-35% and cell misidentification rate can reach up to 18% [24, 25], which are deemed intolera-ble in the area of cancer and drug research where consequences on human life can be tremendous. Therefore, the identity of cancer cell lines have to be con-firmed continuously throughout the course of the research being conducted. Short tandem repeat (STR) profiling was proposed as a method for cell line authentica-tion to preclude data misinterpretaauthentica-tion, thereby eliminating the aforemenauthentica-tioned
Figure 2.1: Sample cancer cell line image from BT-20 class viewed at 20× mag-nification
problems associated with the use of cancer cell lines [26]. STR profiling is cur-rently an international reference standard for identification of human cell lines. However, applying STR method takes a long time and an expert is required to carry out STR profiling. In addition, STR is a very costly process, necessitating efficient and rapid tools that can perform the task of cell identification in an automated manner. Computer-assisted identification of cancer cells can alleviate the burden of manual labeling, eliminate disadvantages of STR and thus facilitate cancer research. Figures 2.1 and 2.2 show sample human cancer cell line images of type BT-20 and MV, respectively, acquired with Olympus CKX41 inverted microscope.
In this chapter, an image classification framework based on dual-tree com-plex wavelet transform (DT-CWT), directional difference scores and covariance features is proposed to automatically classify human cancer cell line images be-longing to 14 different classes. Covariance descriptors obtained through the use of DT-CWT coefficients and directional difference scores are classified using the
Figure 2.2: Sample cancer cell line image from MV class viewed at 20× magni-fication
multi-class Support Vector Machine (SVM) [27] classifier. The performance of the proposed algorithm is compared with the classical covariance descriptors.
The rest of the chapter is organized as follows. In Section 2.1, related work on cancer cell line classification in microscopic images is presented. Section 2.2 describes the image segmentation and subwindow selection procedure used in extracting regions-of-interest (ROIs) from cell line images. In Section 2.3, DT-CWT and covariance based feature extraction methods applied to human cancer cell line images are proposed. Classification strategy is described in Section 2.4. Cancer cell line image dataset used in the experimental studies is introduced in Section 2.5 and experimental results and observations are presented in Section 2.6. MATLABTM R2012a computational environment is used for experimental studies and simulations.
2.1
Related Work on Cancer Cell Line
Classifi-cation
Previous work on computerized identification of cancer cell lines is limited as STR analysis has become the standard way of checking the identity of cell lines in molecular biology community. Modelling of cell morphology has been studied by several groups, for example for fission yeast in [28] and for escherichia coli bacteria in [29]. In the fission yeast case, differential expression of protein affects the cell size and, therefore, cell fate, while in the escherichia coli case, the topo-logical organization is analyzed with respect to the underlying signaling network. In [30], Bayesian classification algorithm exploiting the sparsity in a transform domain for differentiation of cell line images is proposed in which eigenvalues of the conventional covariance descriptor computed from fixed-size image blocks are used as features. We incorporate the complex wavelet transform into region co-variance descriptors for feature extraction from microscopic images. In addition, a new set of features based on directional differences is proposed and used in covariance descriptors.
In Subsection 2.1.1, CWT is briefly explained. Detailed description of DT-CWT based features is presented in Section 2.3. In Subsection 2.1.2, directional difference scores are proposed and explained. In Subsection 2.1.3, covariance and normalized covariance based methods are presented, which will be used in Section 2.3 for encoding complex wavelet subbands of cell line images.
2.1.1
Dual-Tree Complex Wavelet Transform
Wavelet theory has been providing a basis for many signal processing applications over the years. It has been introduced by the pioneering works of Daubechies [31], Mallat [32] and Grossman et al. [33]. Wavelets can be defined as dilated, trans-lated and rotated versions of a locally oscillating prototype function, that are used to represent signals in both time and frequency domains at multiple decomposi-tion levels. The discrete wavelet transform (DWT), which is aimed at processing
x[n] 0 g [n] 1 g [n] 0 h [n] 1 h [n] 0 h [n] 1 h [n] 0 g [n] 1 g [n] Real Tree Imaginary Tree 2 0 h [n] 1 h [n] 0 h [n] 1 h [n] 2 2 2 2 2 2 2 0 h [n] 1 h [n] 0 h [n] 1 h [n] 2 2
Figure 2.3: Filterbanks for the dual-tree complex wavelet transform
discrete-time signals, can be implemented using orthogonal or biorthogonal fil-terbanks and can be efficiently exploited for signal analysis. A computationally efficient implementation of the wavelet transform is provided by lifting structures [34]. Wavelets have proved useful in a broad range of applications, including image and video coding [35, 36], audio compression [37], speech recognition [38], texture classification and retrieval [39, 40] and denoising [41]. Recently, motion detection [42], and fire and flame detection [43] algorithms based on wavelet do-main analysis of video were proposed.
The classical DWT has several limitations hampering its effectiveness in signal and image analysis, such as shift variance and lack of directionality [10]. When the input is shifted slightly, the discrete wavelet coefficients may change significantly. Higher dimensional DWT is implemented using separable filterbanks along each dimension and thus fails to capture directional information except at 0 and 90 degrees, for example, for a 2D DWT. To overcome such limitations of DWT, the dual-tree complex wavelet transform (DT-CWT) was proposed whereby two filter pairs are used in parallel to decompose a given signal [44].
DT-CWT has recently emerged as a promising alternative to the classical DWT in a variety of signal and image processing tasks including denoising [5], classification [6], texture analysis [7], compression [8] and watermarking [9]. DT-CWT has desirable properties such as shift invariance, directional selectivity and
lack of aliasing. In the dual-tree CWT, two maximally decimated DWTs are executed in parallel in a way that enables the wavelet functions of two different trees to form an approximate Hilbert transform pair [10]. These two wavelet trees are named real and imaginary trees, respectively. Low-pass analysis filters in real and imaginary trees must be offset by a half-sample in order to have one wavelet basis as the approximate Hilbert transform of the other wavelet basis [45]. Analyticity allows one-dimensional DT-CWT to be approximately shift-invariant and free of aliasing artifacts often encountered in DWT-based processing. Two-dimensional DT-CWT is also directionally selective in six different orientations, namely,{±15, ±45, ±75}. Analysis filterbanks for one-dimensional DT-CWT are shown in Figure 2.3.
In the biomedical image analysis literature, DT-CWT is used to predict the histological diagnosis of colorectal lesions in colonoscopy images by employing a probabilistic framework where a joint statistical model for complex wavelet coef-ficient magnitudes is proposed [46]. In [47], authors model the marginal distri-butions of DT-CWT coefficient magnitudes by Rayleigh and Weibull probability density functions to classify the zoom-endoscopy images for colorectal cancer di-agnosis. In [48], MR images of human brain and wrist are classified using textural features extracted via DT-CWT decomposition.
Cancer cell line images contain significant amount of oriented singularities. Attributes like orientation selectivity and shift invariance render DT-CWT a good choice for the processing of microscopic images with lots of edge- or ridge-like singularities. As a part of this thesis, microscopic cancer cell line images are represented in complex wavelet domain. It is explained in Section 2.3 how coefficients in this domain are exploited for cell line image analysis.
2.1.2
Directional Differences
In order to account for the large morphological variation of the images in our dataset, we evaluate differences between pixels in various directions. Inspired by
the local binary pattern (LBP) approach [49], a new directional feature computa-tion approach is introduced for texture characterizacomputa-tion. Consider a point p1 on a
two-dimensional function I(x, y). Now consider a second point p2. The Euclidean
distance between p1 and p2 is d and p2 lies on line that has an orientation of angle
α with respect to the x-coordinate, i.e., p2 lies on a circle whose center point is
p1 and has a radius d. The difference between p1 and p2 can be written as
T (d, α) =|I(x, y) − I(x + d · cos α, y + d · sin α)| (2.1)
Now consider we want to compute a couple of difference values for equidistant concentric circles where the largest circle has radius R and the smallest has radius
R/A, where A is an integer with values ranging from [1, R]. When the parameters R and A are fixed, the equation (2.1) can be rewritten as
T (i, α) = I(x,y) − I(x + iR
A · cos α, y + i R
A · sin α)
(2.2)
where i ∈ 1, 2, ..., A. We can compute a score for each α value by computing a function with respect to i, as
sα =Fi(T (i, α)) (2.3)
In this thesis, Fi is chosen to be the median function. In that case, sα is
simply the median of all the differences between the center pixel and the points at distances iRA at the fixed orientation α. sα is computed for each pixel of the
image and these scores are used as features in covariance matrix computation. For each input image, eight output images of the same size are generated as the result of the functionFi, corresponding to 8 different orientations when the radius
d is chosen as 5 in the experiments. In Section 2.3, directional difference scores
are used in covariance descriptors for cancer cell line image analysis.
2.1.3
Covariance Descriptor
Region covariance provides a powerful descriptor for representing image regions, which was proposed by Tuzel et al. [50]. It has attained a great deal of interest
from computer vision community. Covariance descriptors enable the combination of different features over an image region of interest. In the region covariance framework each pixel is mapped to a set of pixel properties whose variances and correlations with one another are utilized in a covariance matrix as region descriptor. Given an intensity image I of size m× n, we define a mapping ϕ from image domain to feature domain as
F (i, j) = ϕ(I, i, j) (2.4) where each pixel (i, j) in I is mapped to a set of features and F is the m× n × d dimensional feature function. Let fi,j, 1≤ i ≤ m, 1 ≤ j ≤ n, be the d-dimensional
feature vectors extracted for the (i, j)th pixel of the image. Then, the covariance
matrix of the image I can be computed as
C = 1 N − 1 m ∑ i=1 n ∑ j=1 (fi,j − µ)(fi,j − µ)T (2.5)
where N = m× n and µ is the mean of the feature vectors inside the region I, which can be calculated as
µ = 1 N m ∑ i=1 n ∑ j=1 fi,j (2.6)
The covariance matrix is symmetric positive-definite and of size d× d. There exists a very efficient multiplier-less implementation of covariance descriptors, called co-difference matrices, which have been shown to yield comparable perfor-mances to the original ones [51].
In [50], covariance features are employed for object detection and texture clas-sification tasks. Each object region is represented by five overlapping subregions and a covariance matrix is constructed from each subregion. Pixel features used in constructing covariance matrices include pixel x and y coordinates, R, G and B values from the RGB space, first and second derivatives of the image intensity in both x and y directions. Desired object locations are determined in the tar-get image by executing an exhaustive search, where generalized eigenvalue-based dissimilarity measure is employed to compute the distance between covariance
matrices. In [52], pedestrian detection is achieved by encoding positive and neg-ative pedestrian regions via covariance descriptors. Spatio-temporal covariance descriptors representing spatio-temporal blocks of video are proposed in [53] for flame detection. [54] uses covariance features to describe one-dimensional speech signals for speech emotion classification. Covariance descriptors are utilized for classification of colonic polyps in CT colonography images [55].
Feature vectors extracted from each pixel must be selected taking into account the specific properties of the application domain. It may be adequate to use image intensity, color values and derivatives in x and y directions in detection tasks such as object detection, pedestrian detection and flame detection, whereas biomedical images require more sophisticated approaches that can encode ROI’s in a discriminative manner. Feature vectors used in this thesis will be detailed in Section 2.3.
2.2
Image Segmentation and Subwindow
Selec-tion
In this chapter, ROI extraction process from cancer cell line images is described. First, image segmentation is performed to obtain cellular regions and then ROI’s are selected from foreground cellular regions.
The images in our dataset exhibit a large amount of background. Clearly, the background is not discriminative. Therefore, we address the issue of segmenting the images into foreground and background before calculation of covariance matri-ces from image patches. For our dataset, a simple thresholding scheme like Otsu’s method [56] does not provide satisfactory segmentation results, since foreground pixels have a large variance and may therefore have values higher and lower than the background pixels. Hence, the distribution of cellular and background com-ponents is modeled using a Gaussian mixture model. The mixture parameters
Θ = (αF, αB, µF, µB, σF, σB) are estimated using the expectation maximization
mean and variance of the distributions of foreground and background pixels, re-spectively. EM is an iterative algorithm that obtains the maximum likelihood estimates of distribution parameters using training samples. This is achieved by assuming the existence of additional hidden parameters. In the expectation step, the expectation of the complete-data log-likelihood is calculated with respect to the hidden data y given the observations x and the current estimates Θ(i−1) as follows:
Q(Θ, Θ(i−1)) = E[log p(x, y|Θ)|x, Θ(i−1)] (2.7) where x denotes pixel values and y denotes the mixture component that generates the pixel value. In the maximization step, a new parameter set Θ is determined that maximizes the expectation in Equation (2.7):
Θ(i) = arg max
Θ Q(Θ, Θ
(i−1)) (2.8)
After the parameter estimation process is finished, the posterior probability of each pixel x can be computed as
p(ci|x) = αip(x|ci)P (ci) ∑ j αjp(x|cj)P (cj) , (2.9)
where i denotes foreground or background components and p(x|ci) = N (x; µi, σi)
is the value of the Gaussian distribution parametrized by the mean and variance of the corresponding component. For segmentation, x is assigned to the component that yields the higher posterior probability.
The resulting image obtained by EM segmentation of the image in Figure 2.1 is shown in Figure 2.4(a). As can be seen from the result, the image is noisy. Hence, a morphological closing operation is applied, followed by median filtering. Figure 2.4(b) illustrates the final image mask obtained after closing and median filtering.
Once the foreground cellular regions are identified via segmentation, ROI’s can be selected from those regions. Since cancer cell line images contain lots of flat, background-like regions, it is not reasonable to compute the covariance matrix over the whole image region. Exclusion of background regions in covariance
(a) EM segmentation (b) EM segmentation followed by closing and median filtering
Figure 2.4: Image masks obtained (a) after EM segmentation and (b) after closing and median filtering on top of EM output using the image in Figure 2.1
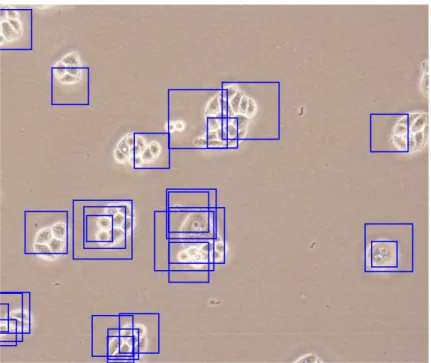
computation helps to increase the class separability in classification. We propose to use random subwindow selection method for cancer cell line images [58]. Each image is represented by possibly overlapping s square subwindows selected at random locations and with random edge lengths. The edge length of the largest possible subwindow is equal to that of the shorter edge of the image, while the size of the smallest possible subwindow is 10 times lower than that of the largest one. We enforce a foreground percentage constraint on the selected subwindows to avoid gathering background regions. A randomly chosen subwindow is discarded, if its foreground percentage is below a threshold, which is determined to be 50%. Random window selection process continues until the total number of windows becomes s. We compute a covariance matrix for each subwindow and an image is represented by s covariance matrices. Random subwindow selection process is illustrated in Figure 2.5 for a sample cancer cell line image. Random sampling approach avoids the need to scan the whole image to regularly take samples, which is computationally expensive, and provides scale-invariance of analysis windows by considering cells of any size for processing.
Figure 2.5: Random subwindow selection process on a sample cancer cell line image
2.3
DT-CWT and Covariance Based Feature
Extraction
In this section, DT-CWT based feature extraction technique that employs covari-ance descriptors is proposed for ccovari-ancer cell line images. DT-CWT is a recently developed image decomposition method that possesses orientation selectivity and shift invariance properties lacking in the classical DWT. In the literature, it was used for texture analysis and classification, video compression and image water-marking [6, 7, 8, 9].
In contrast to the real DWT, two sets of filters are employed in the two trees, which are called real and imaginary trees, respectively. Two different DWTs are executed in parallel in dual-tree structure where the real part of DT-CWT is provided by the first one and the imaginary part by the second one. The reasoning behind the use of dual-tree is to obtain an analytic complex wavelet at
the end:
ψc(t) = ψh(t) + jψg(t) (2.10)
where ψh(t) and ψg(t) denote wavelet functions of real and imaginary trees,
re-spectively. If ψc(t) is approximately analytic (has support on only one-side of the
frequency axis), the resulting transform can possess the properties such as lack of aliasing, directionality and shift invariance just like the Fourier transform whose complex basis functions are analytic [10]. For ψc(t) to be approximately analytic,
it is required that one wavelet basis is the approximate Hilbert transform of the other wavelet basis:
ψg(t)≈ H{ψh(t)} (2.11)
In order to satisfy the condition in (2.11), low-pass analysis filters in real and imaginary trees must be offset approximately by half-sample [45]:
g0[n]≈ h0[n− 0.5] (2.12)
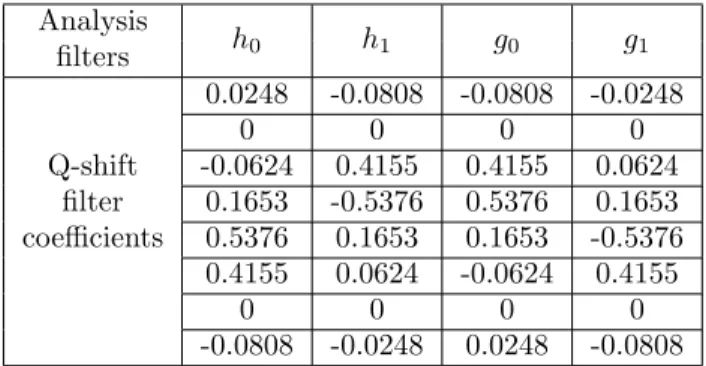
In the literature, two low-pass filters are jointly designed such that half-sample delay, perfect reconstruction and finite support conditions are simultaneously satisfied, using several filter design methods [10]. Q-shift filters are employed in this thesis for DT-CWT decomposition. Analysis q-shift filters for real and imaginary trees are shown in Table 2.1 [59].
Analysis h0 h1 g0 g1 filters Q-shift 0.0248 -0.0808 -0.0808 -0.0248 0 0 0 0 filter -0.0624 0.4155 0.4155 0.0624 coefficients 0.1653 -0.5376 0.5376 0.1653 0.5376 0.1653 0.1653 -0.5376 0.4155 0.0624 -0.0624 0.4155 0 0 0 0 -0.0808 -0.0248 0.0248 -0.0808
Table 2.1: Impulse Response of Kingsbury’s 8th Order Q-shift Analysis Filters for the Dual-Tree CWT
Two-dimensional (2D) extension of DT-CWT is used for analysis of cancer cell line images. 2D DT-CWT of an image is obtained by four real separable trans-forms [60]. Real-part and imaginary-part analysis filters are applied successively
Figure 2.6: 2D analytic complex wavelet obtained from two 1D analytic complex wavelets
to rows and columns of the image. Implementation details for 2D DT-CWT [10] are as follows. Let ψ(x) = ψh(x) + jψg(x) denote an approximately analytic
com-plex wavelet in the Fourier domain. The 2D separable wavelet ψ(x, y) = ψ(x)ψ(y) obtained by row-column implementation can be expressed as
ψ(x, y) = [ψh(x) + jψg(x)][ψh(y) + jψg(y)] (2.13)
= ψh(x)ψh(y)− ψg(x)ψg(y) + j[ψg(x)ψh(y) + ψh(x)ψg(y)] (2.14)
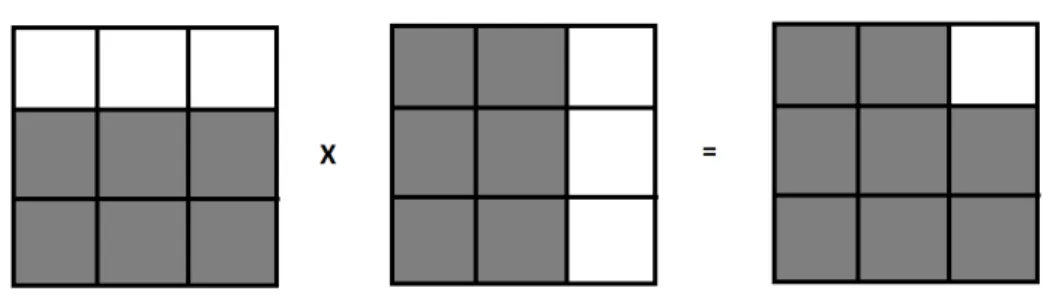
Since ψ(x) is analytic, it is supported only on one side of the frequency axis. Hence, the multiplication of these two analytic wavelets results in a 2D complex wavelet that has support only on one quadrant of the 2D frequency domain. This process is illustrated in Figure 2.6, in which boxes represent 2D Fourier domain idealized diagrams of the wavelet functions where the functions are supported on white regions and have no support on black regions. The real part of this 2D complex wavelet is given by
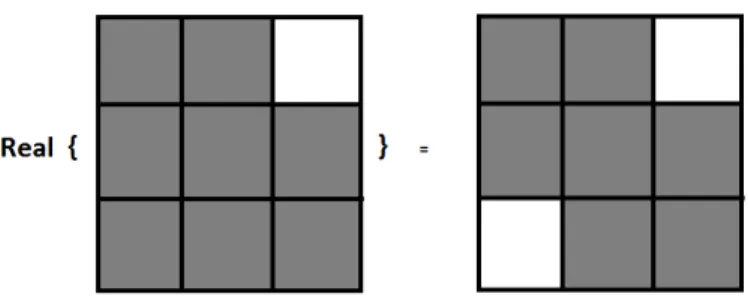
ℜ{ψ(x, y)} = ψh(x)ψh(y)− ψg(x)ψg(y) (2.15)
which is implemented by taking the difference of high-pass subbands of the real and imaginary trees in a separable row-column processing.
Real wavelets should be symmetric with respect to the origin; hence, taking the real part of the resulting spectrum in Figure 2.6 yields the 2D real oriented wavelet as shown in Figure 2.7. It highlights image structures oriented at 45o,
and thus is oriented at−45o. The real part of the 2D complex wavelet ψ2(x, y) =
Figure 2.7: Oriented 2D wavelet given by the real part of the analytic 2D wavelet
move the support to the left side of the frequency plane, thereby generating a 2D complex wavelet supported only on the 2nd quadrant of the plane similar to the
procedure in Figure 2.6. For other four orientations, the following four complex 2D wavelets should be employed: ϕ(x)ψ(y), ψ(x)ϕ(y), ϕ(x)ψ(y), and ψ(x)ϕ(y). If the aforementioned procedure is repeated by taking imaginary parts of the 2D complex wavelets instead of real parts, six real and imaginary orientations,
{±15, ±45, ±75}, are obtained. 2D DT-CWT implementation scheme is shown in
Figure 2.8. As seen from the figure, four separable transforms, FHH, FHG, FGH,
FGG, are executed in parallel for 2D DT-CWT decomposition, where FAB denotes
row-column separable transform with the filterbank A used for row processing and the filterbank B used for column processing.
The 1st level 2D DT-CWT subbands are obtained by taking the sum and
difference of respective subbands shown at the output of filterbanks in Figure 2.8. Twelve 2D DT-CWT detail subband images are computed as follows:
d1,2 = xh0h1 ± xg0g1 (2.16) d3,4 = xh1h0 ± xg1g0 (2.17) d5,6 = xh1h1 ± xg1g1 (2.18) d7,8 = xg0h1 ± xh0g1 (2.19) d9,10= xg1h0 ± xh1g0 (2.20) d11,12 = xg1h1 ± xh1g1 (2.21)
where each of the six orientations corresponds to two detail subbands, one of them being real and another being imaginary. Low-pass subbands, xh0h0, xh0g0,
G H H G H H H H G G H H G H H
Row processing Column processing
x[n1,n2] 0 h0 x 0 h0 0 h0 x 1 h 0 h0 x 0 g 0 h0 x 1 g 1 h x 0 h0 1 h x 1 h 1 h x 0 g 1 h x 1 g 0 g0 x 0 h0 0 g0 x 1 h 0 g0 x 0 g 0 g0 x 1 g 1 g x 0 h0 1 g x 1 h 1 g x 0 g 1 g x 1 g 1 h [n] 0 h [n]0 h [n] 1 h [n] H H 0 g [n] 1 g [n] 0[n] 1[n] G = = 2 2 2 2
Figure 2.8: Implementation scheme of the 2D DT-CWT. Four real separable DWT’s are employed in 2D DT-CWT.
decomposition levels. At each decomposition level, we obtain a total of sixteen subbands consisting of six real detail subbands, six imaginary detail subbands and four approximation subbands. Two-dimensional dual-tree decomposition is an oversampled transform with a redundancy factor of 4 (2d for d-dimensional
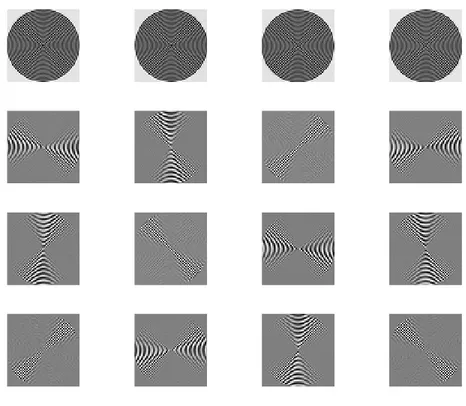
signals). A sample image and its 2nd level 2D DT-CWT subbands are shown
in Figures 2.9 and 2.10, respectively. In Figure 2.10, the first row contains the approximation subbands and the remaining rows contain the detail subbands at six different orientations. In our work, we perform three-level 2D DT-CWT decomposition of each biomedical image of size m× n and use the detail subband coefficients. Each subband at the ithlevel is of size m/2i×n/2i. The original image
I(x, y) is decimated by 8 in both directions to obtain a single intensity image Ia(x, y) which represents the original image. Let W
R,(i)
θ (x, y) and W Im,(i) θ (x, y)
denote, respectively, the real and imaginary part of the ith level complex wavelet coefficient at the position (x, y) corresponding to directional detail subbands at orientation θ, where θ∈ {±15, ±45, ±75}. The magnitude of the complex wavelet
coefficient is then given by
Mθ(i)(x, y) = √
WθR,(i)(x, y)2+ WIm,(i)
θ (x, y)2 (2.22)
Figure 2.9: Sample image.
In this thesis, covariance descriptors are utilized to encode cancer cell line im-age windows in complex wavelet domain. Complex wavelet coefficient magnitudes in detail subbands are used as pixel features in covariance computation. Conven-tional covariance approach includes only gray-scale and color values, and their derivatives in horizontal and vertical directions, which limits the discriminatory power of the covariance representation. Augmenting covariance matrices with directional information through the use of 2D DT-CWT may help to enhance the classification accuracy. Directional difference scores introduced in Subsection 2.1.2 are also included in the feature vectors.
Intensity value, first and second order derivatives in horizontal and vertical directions are also included in the feature vector in addition to DT-CWT and directional difference features. 1st, 2nd and 3rd level DT-CWT coefficients are
tested to observe the effect of decomposition level on classification performance. With M(i)θ (x, y) = [Mθ(i) 1 (x, y)...M (i) θ6 (x, y)], (2.23) and sα(x, y) = [sα1(x, y) ... sα8(x, y)] (2.24) where θ1...θ6 corresponds to the six orientations of DT-CWT detail subbands
{±15, ±45, ±75}, M(i)
θ (x, y) is as defined in Equation (2.22) and α1...α8
corre-spond to the eight orientations of directional difference score estimation, the fol-lowing feature mapping functions are employed to compute covariance matrices:
ϕ1(I, x, y) = [ Ia(x, y) ∂Ia ∂x ∂Ia ∂y ∂2Ia ∂x2 ∂2Ia ∂y2 ]T (2.25) ϕ2(I, x, y) = [ Ia(x, y) M (1) θ (x, y) ]T (2.26) ϕ3(I, x, y) = [ Ia(x, y) ∂Ia ∂x ∂Ia ∂y ∂2Ia ∂x2 ∂2Ia ∂y2 M(1) θ (x, y) ]T (2.27) ϕ4(I, x, y) = [ Ia(x, y) ∂Ia ∂x ∂Ia ∂y ∂2Ia ∂x2 ∂2Ia ∂y2 M(1) θ (x, y) sα(x, y) ]T (2.28) ϕ5(I, x, y) = [ Ia(x, y) M(2)θ (x, y) ]T (2.29) ϕ6(I, x, y) = [ Ia(x, y) ∂Ia ∂x ∂Ia ∂y ∂2Ia ∂x2 ∂2Ia ∂y2 M(2) θ (x, y) ]T (2.30) ϕ7(I, x, y) = [ Ia(x, y) ∂Ia ∂x ∂Ia ∂y ∂2Ia ∂x2 ∂2Ia ∂y2 M(2) θ (x, y) sα(x, y) ]T (2.31) ϕ8(I, x, y) = [ Ia(x, y) M (3) θ (x, y) ]T (2.32) ϕ9(I, x, y) = [ Ia(x, y) ∂Ia ∂x ∂Ia ∂y ∂2Ia ∂x2 ∂2Ia ∂y2 M(3) θ (x, y) ]T (2.33) ϕ10(I, x, y) = [ Ia(x, y) ∂Ia ∂x ∂Ia ∂y ∂2Ia ∂x2 ∂2Ia ∂y2 M(3) θ (x, y) sα(x, y) ]T (2.34) where the first and second order intensity derivatives are calculated using the filters [−1, 0, 1] and [1, −2, 1], respectively. Sizes of the covariance matrices ob-tained by using the above feature vectors are shown in Table 2.2. ϕ1 is used
to evaluate the performance of the conventional covariance descriptors including only intensity and color values and their derivatives, as in [11, 61]. The 1st level
DT-CWT coefficient magnitudes in detail subbands are tested in ϕ2, ϕ3 and ϕ4,
with intensity, first and second order intensity derivatives and directional differ-ence scores, respectively. The effect of the 2nd and 3rd level DT-CWT coefficients
are tested in the remaining feature vectors.
Covariance matrices are calculated for each subwindow of the image as ex-tracted in Section 2.2. [11] proposes to use the generalized eigenvalue based
Figure 2.10: Second level 2D DT-CWT subbands of the image in Figure 2.9
distance metric for calculating the dissimilarity of two covariance matrices as the Euclidean distance is meaningless for covariance matrices, which do not lie in Euclidean space. Kullback-Leibler (KL) divergence is used in [62] for comparing covariance matrices. However, both distance metrics are computationally expen-sive and require an extenexpen-sive amount of time for distance calculation in huge datasets, as is the case with our dataset. Therefore, covariance matrices are vec-torized and classified in the resulting feature space using SVM [61]. We adopt the vectorization approach and include only the upper or lower diagonal elements of the covariance matrix in classification.
In [63], normalized covariance descriptors are introduced and utilized for real-time wildfire detection. We also test the normalized covariance matrices in cancer cell line classification. Each entry ˆC(i, j) of a normalized covariance matrix is
Table 2.2: Sizes of the Covariance Matrices Used
Mapping Function ϕ1 ϕ2 ϕ3 ϕ4 ϕ5 ϕ6 ϕ7 ϕ8 ϕ9 ϕ10
Matrix Size 5× 5 7 × 7 11 × 11 19 × 19 7 × 7 11 × 11 19 × 19 7 × 7 11 × 11 19 × 19
obtained from the covariance matrix C as follows:
ˆ C(i, j) = √ C(i, j), if i = j C(i,j) √ C(i,i)C(j,j), otherwise (2.35)
2.4
Classification Algorithm
For each subwindow sampled from images as explained in Section 2.2, a covari-ance matrix is computed using Equation (2.5) for each of the feature mapping functions in (2.25)-(2.34). The image signature is composed of s covariance ma-trices of the same size. Each class is represented by s×#(images in each class) covariance matrices. Covariance matrices are symmetric positive-definite and do not lie in the Euclidean space; so, they are vectorized resulting in d(d + 1)/2-dimensional feature vectors for d× d matrices. Proposed by Boser et al. [64], SVM is a supervised machine learning algorithm that learns the decision bound-aries between classes using separating hyperplanes. LIBSVM library [27] is used for SVM implementation. A multiclass SVM classifier is trained with RBF kernel in the d(d + 1)/2-dimensional vector space using the training points. For each test subwindow, the corresponding covariance descriptor is vectorized and fed into the trained SVM model for prediction. Therefore, there exist s labels for each microscopic image corresponding to s subwindows, and the image in question is assigned the label that gets the majority of votes among s labels. The above process is re-executed using normalized covariance matrices defined in Equation (2.35) instead of covariance matrices.
2.5
Cancer Cell Line Image Dataset
The dataset used in this study consists of 280 microscopic human carcinoma cell line images with each of the 14 classes having 20 images. Images in the dataset were acquired at 10x, 20x and 40x magnifications; thus, we have a total of 840 images in the dataset. The size of each image is 3096× 4140 pixels. 7 classes belong to breast cancer cell lines and the other classes belong to liver cancer. Each cell type has a specific phenotype in terms of nuclei (spherical vs. ovoid), nucleoli (prominent vs. hardly noticeable), size (large vs. small) and shape (round vs. cell pods) [65]. The names of the cancer cell lines used in our study are shown in Table 2.3. Aggressive cancer cells with metastatic properties switch from an epithelial-like (epithelioid) morphology to a spindle-shaped fibroblast-like (fibroblastoid) morphology during epithelial-mesenchymal transition (EMT), which is an indication of the invasiveness and metastatic capability of cancer cells. While epithelioid cells have polygonal shape with regular dimensions and sharp boundaries, fibroblastoid cells have elongated shapes and are bipolar or multipolar.
Table 2.3: Names of Cancer Cell Lines Used in This Study Breast cancer Liver cancer
cell line cell line
BT-20 Focus Cama-1 Hep40 MDA-MB-157 HepG2 MDA-MB-361 Huh7 MDA-MB-453 MV MDA-MB-468 PLC T47D SkHep1
6 hepatocellular carcinoma (Focus, Hep40, Huh7, Mahlavu, PLC, SkHep1), 1 hepatoblastoma (HepG2) and 7 breast cancer (Cama-1, MB-157, MDA-MB-361, MDA-MB-453, MDA-MB-468, T47D, BT-20) cell lines were seeded into dishes with 20% confluency and grown at 37oC under 5% CO
2 in standard
Non-Essential Aminoacid and 1% penicillin/streptomycin (GIBCO Invitrogen) up to 70% confluency. The cell lines used in this study were original and verified by STR analysis. Pictures were taken with Olympus CKX41 inverted microscope using Olympus DP72 camera with 10x, 20x and 40x objective.
2.6
Experimental Results
Feature vectors extracted via DT-CWT decomposition and covariance matrices are experimented on the cancer cell line image dataset mentioned in Section 2.5. We adopt a 20-fold cross-validation strategy for the experiments. The dataset is divided into 20 disjoint subsets and each subset consisting of 14 images is used exactly once as the test set. For k = 1...20, the kth subset is formed by taking the kth indexed image of each class. We run 20 experiments, choosing each image as the test image only once for each class, and obtain the average image classification accuracy over 20 runs. The number of selected random subwindows is taken to be s = 100. The above experiment is performed for both covariance and normalized covariance matrices, and for ten different mapping functions in (2.25)-(2.34). Separate experiments are carried out for three different datasets associated with the magnification factors 10x, 20x and 40x, respectively.
Experimental results are presented on three different tables corresponding to three different magnifications. Both image classification accuracies and sub-window classification accuracies are shown on tables. Subsub-window accuracies are computed for the sole purpose of obtaining the intermediate results; what is im-portant is the accuracy of classification on an image level which is accomplished by majority voting among the selected subwindows. Tables 2.4-2.6 present over-all image and subwindow classification accuracies of 14 different classes over the cancer cell line image datasets at 10x, 20x and 40x magnifications, respectively. The highest image accuracy in each of these tables is highlighted in bold.
Table 2.4: Overall Image and Subwindow Classification Accuracies in (%) of the Covariance and Normalized Covariance Methods for 10x Cancer Cell Line Image Dataset
Feature Covariance Method Normalized Covariance Method Mapping Image Subwindow Image Subwindow Function Accuracy Accuracy Accuracy Accuracy
ϕ1 89.6 59.6 90.4 61.0 ϕ2 83.2 55.8 88.9 59.1 ϕ3 94.6 68.0 95.4 68.0 ϕ4 97.5 70.6 98.2 74.1 ϕ5 82.1 55.3 87.9 59.3 ϕ6 96.1 68.6 96.8 69.4 ϕ7 96.8 70.1 98.6 75.0 ϕ8 81.8 55.1 86.4 59.3 ϕ9 95.7 68.8 96.8 69.4 ϕ10 96.8 71.1 98.9 75.0
discriminative than the classical covariance matrices as both the image and sub-window classification accuracies improve in almost all cases when normalization is performed. The best overall image recognition rates for 10x, 20x and 40x datasets are 98.9%, 97.5% and 96.4%, respectively, all obtained by normalized covariance method.
For all the magnification factors, the feature mapping function ϕ10 containing
19 features leads to the highest image classification accuracy. It includes the 3rd
level DT-CWT detail subband complex coefficient magnitudes and directional difference scores in addition to intensity and intensity derivatives. It is observed that ϕ4 and ϕ7, which include 1st and 2nd level DT-CWT coefficients,
respec-tively, as the only difference from ϕ10 are the best or the second best functions
in all datasets. This shows that discriminative ability of the covariance descrip-tor increases as more features are included in the feature vecdescrip-tor from which the covariance matrices are constructed. For instance, ϕ2 is a subset of ϕ3, which
is a subset of ϕ4; when intensity derivatives and directional difference scores are
sequentially added to the feature vector, the algorithm becomes more accurate. However, the effect of DT-CWT decomposition level on classification performance is not pronounced since the accuracy of image classification only slightly differs among feature mapping functions corresponding to different DT-CWT levels such
Table 2.5: Overall Image and Subwindow Classification Accuracies in (%) of the Covariance and Normalized Covariance Methods for 20x Cancer Cell Line Image Dataset
Feature Covariance Method Normalized Covariance Method Mapping Image Subwindow Image Subwindow Function Accuracy Accuracy Accuracy Accuracy
ϕ1 86.8 58.9 87.9 60.3 ϕ2 82.1 56.3 90.4 60.3 ϕ3 92.1 68.1 93.9 68.9 ϕ4 95.7 71.5 97.5 74.6 ϕ5 82.9 56.3 88.9 59.6 ϕ6 91.8 68.9 96.1 70.0 ϕ7 96.1 72.0 97.5 74.9 ϕ8 82.9 56.4 89.3 59.9 ϕ9 91.8 68.7 96.1 70.1 ϕ10 96.4 72.0 97.5 75.0 as ϕ2, ϕ5 and ϕ8.
Conventional covariance method represented by ϕ1 is generally outperformed
by DT-CWT based covariance descriptors ϕ2, ϕ3, ϕ5, ϕ6, ϕ8 and ϕ9. Directional
information is embedded into covariance representation by the use of subband coefficients of DT-CWT, which possesses orientation selectivity. The experimen-tal results demonstrate that classical covariance descriptors fail to capture the textural characteristics of cancer cell line images and result in unsatisfactory classification performance, whereas the proposed DT-CWT based covariance ap-proach is well suited for the task of recognizing human cancer cell line images. Exploitation of directional information at six different orientations through the use of DT-CWT boosts the image recognition accuracy. Approximate shift in-variance property of DT-CWT also adds a certain level of robustness to feature extraction step since it is capable of accurately localizing singularities without causing undesirable positive and negative oscillations around them.
The length of the feature vector corresponding to ϕ10, which achieves the
highest success rate, is 19 × 20/2 = 190, as seen from Table 2.2. 66-length feature vector of ϕ9 leads to an accuracy of 96.8% for 10x dataset, causing 2.1%
Table 2.6: Overall Image and Subwindow Classification Accuracies in (%) of the Covariance and Normalized Covariance Methods for 40x Cancer Cell Line Image Dataset
Feature Covariance Method Normalized Covariance Method Mapping Image Subwindow Image Subwindow Function Accuracy Accuracy Accuracy Accuracy
ϕ1 73.9 51.3 81.8 52.7 ϕ2 71.8 50.2 81.8 56.7 ϕ3 89.3 62.4 92.9 65.5 ϕ4 92.5 64.9 96.4 70.3 ϕ5 72.9 50.7 90 60.7 ϕ6 89.3 63.8 92.9 67.1 ϕ7 92.9 65.3 95.7 71.4 ϕ8 73.2 50.9 90.4 60.8 ϕ9 88.6 63.8 93.2 67.2 ϕ10 92.9 65.4 96.4 71.6
classification accuracy or the speed of the algorithm must be compromised. It takes approximately 20 seconds to classify a cancer cell line image acquired at 20x magnification with a MATLAB implementation using ϕ10, where the computation
of directional difference scores lasts 8 seconds. Utilizing ϕ9 instead of ϕ10 for
feature extraction provides 8 seconds improvement in speed while degrading the accuracy by 2%. With a C++ implementation, average image classification time for both cases can drop below a second, which suggests that real-time application is possible. If the biologist that will use the developed system prioritizes speed (accuracy), the functions ϕ3, ϕ6 or ϕ9 (ϕ4, ϕ7 or ϕ10) can be preferred for feature
computations.
Experimental results in Tables 2.4-2.6 indicate that the proposed cancer cell line image recognition algorithm provides promising classification accuracies and can be used as a reliable decision maker for laboratory studies. Based on the magnification at which the cell line images are acquired, the best feature vector can be selected by taking into account the trade-off between speed and accuracy of the resulting algorithm.
2.7
Summary
The proposed automated system for human breast and liver cancer cell line im-ages can aid the biologist as a second reader and avoid the need for costly and time-consuming biochemical tests. Our approach aims to carry out the automated analysis by extracting a feature vector from the images. DT-CWT and region covariance based computational framework is successfully applied to classify the cancer cell line images. These feature parameters reflect the large morphological diversity of the images. Notice, however, that our software learns the specific co-variances of these features from the training set, so the model for each image class is not rigid and therefore allows for larger variation in the image data, while main-taining its high effectivity. We adopt a covariance-based approach by exploiting pixel-level attributes to construct local region descriptors encoding covariances of several attributes inside a region of interest. Pixel attributes are extracted using directional difference scores and the 2D DT-CWT coefficients. Since back-ground regions occur frequently in a cancer cell line image, we randomly sample subwindows from the foreground image regions after foreground-background seg-mentation and each microscopic image is represented by covariance matrices of certain number of subwindows sampled randomly from the whole image. Finally, an SVM classifier is trained to learn the class boundaries. Promising classification results are obtained by our experiments, which reveal the ability of the proposed features to characterize breast and liver carcinoma cell line textures.
It is experimentally demonstrated in this study that discrimination of 14 different classes of human cancer cell lines can be accomplished with high accuracy. We have developed a classification software utilizing the above-mentioned methods to be used by biologists. The software can be tested at http://signal.ee.bilkent.edu.tr/cancerCellLineClassificationEngine.html. The work presented in this chapter is published in [66, 67, 68].
Chapter 3
Detection of Centroblasts in
Follicular Lymphoma Images
Using Scale-Space Representation
This chapter deals with the problem of centroblast (CB) detection in follicular lymphoma (FL) images. FL is a cancer of the lymphatic system and it is one of the commonly encountered lymphoid malignancies in the western world. FL is a B-cell lymphoma that has a follicular center cell origin [15, 69]. FL patients may require highly variable treatments depending on the level of aggressiveness of the disease. Aggressive (fast-growing) FL should be exposed to early treatment using aggressive chemotherapy, whereas treatment may not be necessary for indolent (slow-growing) FL, in which case patients have higher chances of survival [15]. Therefore, accurate treatment of FL is of vital importance, which relies on accu-rate risk assessment of the disease. FL risk stratification is currently performed by histological examination of FL tissue samples, as recommended by World Health Organization (WHO) [13]. According to this grading method, pathologists man-ually count the average number of malignant cells called centroblasts (CB) in ten standard microscopic high-power fields (HPF) randomly selected from hematox-ilin and eosin (H&E) stained FL tissue sections. FL grading is then performed based on the average CB count per HPF as follows: grade I (0-5 CB/HPF), grade
II (6-15 CB/HPF) and grade III (16 CB/HPF or higher).
Qualitative visual assessment of FL slides is a time-consuming and diligent task, and subject to substantial inter- and intra-reader variability [14]. Visual image interpretation by human readers also suffers from the sampling bias, which is caused by the random choice of ten HPFs in counting CB cells. The histological grading method tends to be biased, especially if the distribution of malignant cells exhibits high heterogeneity, thereby leading to inconsistent and unreliable clinical decisions that may misguide patient treatment. Computerized image analysis, on the other hand, allows for exploitation of quantitative features extracted from FL images and reduces the subjectivity in clinical decision-making process. Quanti-tative FL image analysis tools can potentially guide pathologists to review only relevant areas of the microscopic tissues or only slides with relevant information, which would alleviate the sampling bias. Computer-aided FL grading system is highly required in a clinical setting to help pathologists in this difficult task. A sample H&E-stained FL image is shown in Figure 3.1 and typical CB and non-CB cells are shown in Figure 3.2(a) and 3.2(b), respectively.
In this chapter, a new algorithm based on scale-space image representation is presented for computer-aided detection of CB cells in H&E stained FL tissue samples. Blob-like cellular structures in FL images are detected by deriving the scale-space extrema of the difference-of-Gaussians (DoG) pyramid as used in the well known Scale-Invariant Feature Transform (SIFT) algorithm. For classifi-cation of the detected cells, statistical region features, gray-level co-occurrence matrices (GLCM), gray-level run-length matrices (GLRLM) and SIFT descriptor are utilized and the resulting feature vectors are trained using a quadratic dis-criminant analysis (QDA) classifier. Elimination of false positives is achieved in a two-stage procedure where size information provided by the scale of the detected blobs is exploited in the first stage and the trained QDA model is used to further refine the detection process. The detection performance of the proposed system is compared with a direct application of the SIFT algorithm and with human readers.