Planetary and Space Science 50 (2002) 633–636
www.elsevier.com/locate/pss
Cosmic ray intensity variation during a CME
G. Kandemir
a; ∗, M . Ge%ckinli
b, C. Firat
b, M. Yilmaz
a, B. Ozugur
aaPhysics Department, Faculty of Engineering, Kadir Has University, Gayrettepe 80810, Istanbul, Turkey bInstitute of Nuclear Energy, Istanbul Technical University, Maslak 80626, Istanbul, Turkey
Abstract
The June 6, 2000 coronal mass ejection was an exceptional full halo, which made it possible to measure cosmic ray (CR) decrease with a simple experimental set-up. Variation in the local secondary cosmic ray density has been investigated by means of gamma rays. The experiment site was located in Istanbul (41.1N, 29.0E). CR electrons and slow gamma rays have been eliminated. The CR density has dropped drastically starting on June 8, 2000. The counts have been compared with the pre-shock levels and some other cases of CMEs. During strong solar modulation, the local counts of secondary CR intensity values dropped down as much as 24%. ? 2002 Elsevier Science Ltd. All rights reserved.
Keywords: Cosmic rays; CME; Solar modulation; Gamma rays; Solar Aares
1. Introduction
Cosmic ray (CR) intensity is modulated by the sun. Solar modulation is mainly observed as (1) a daily variation, (2) a 27-day variation, (3) an anti-correlation with 11-year solar activity, (4) Forbush decreases (FD) of a few days duration and (5) Aare generated CR increases that last only a few minutes. During the last Cve solar cycles neutron monitors, scintillation counters and ionization chambers have recorded CR intensity changes.
Forbush-type CR intensity decreases follow some impor-tant coronal mass ejections (CMEs). Forbush decreases and their connection to eDects on Earth are investigated during both solar maximum and minimum. Maximum years of so-lar activity are ideal times to investigate FD. Development of an FD is described in e.g., Fenton et al. (1984), Cane et al. (1994, 1996), Makela et al. (1998), Cane (2000). When the sun releases a considerable amount of material and mag-netic disturbance, CRs interact with this plasma. CME ma-terial arrives at Earth within a few days. This fast moving plasma sweeps out some CRs and decreases the number. Thus, a CR intensity decrease, called an FD is recorded. It generally takes less than a day to reach the minimum. Re-covery back to the previous CR intensity values continues for several days after the CME.
∗Corresponding author. Fax: +90-216-422-2468. E-mail addresses: [email protected] (G. Kandemir), [email protected] (M. Ge%ckinli).
Sometimes recurrent FD are observed; these originate from corotating high speed solar wind streams. Generally, FD are non-recurrent; such FD are associated with CMEs. Cane et al. (1994) indicate that while a CME is passing, CR counts drop sharply and recover again with a sharp increase. Generally, FD have two components, or, they are observed with “two steps”. The Crst step or decrease is due to the shock. The fast CME material creates a shock wave in the medium ahead of the CME. This turbulent shock region in-cludes closed magnetic Celd lines. Therefore, a decrease of CR occurs inside this region.
The second step is due to the CME. Cane (2000) explains the continuation of the CME in the interplanetary medium; the interplanetary counterpart of the CME is “ejecta”. Cane indicates that according to the position of the observer, there are three possibilities: CR decrease may be observed with both shock and ejecta, only with the shock or only with ejecta. Cane (2000) indicates that most observations are of the two-step type. Only very energetic CMEs may pro-duce shock-only-type FD for the observer. Makela et al. (1998) give examples for the cases that prolonged connec-tion to magnetic turbulence of the shock result in a grad-ual decrease and a slow recovery, while the direct eDect of the ejecta is a sharp decrease and a sharp recovery. They describe three CR decreases observed by the SOHO spacecraft during 1997. It is generally thought that cumu-lative eDects result in a net decrease of CR while a se-ries of solar activity events cause step decreases in the CR intensity.
0032-0633/02/$ - see front matter ? 2002 Elsevier Science Ltd. All rights reserved. PII: S 0032-0633(02)00043-0
634 G. Kandemir et al. / Planetary and Space Science 50 (2002) 633–636
If a Aare is also involved with a CME, before the FD, neutron monitors usually detect a sharp increase due to so-lar protons generated by the Aare. There is no clear rela-tionship between Aares and CMEs. Although they seem to originate from the same place and start at the same time, there are several ejections with no relation to Aares (e.g., Hundhausen, 1996). In a study comparing CMEs and the characteristics of the resulting interplanetary plasma, Lind-say et al. (1999) mention that the speeds of CMEs in the corona may depend on whether they are Aare or prominence associated as they compare CMEs and the characteristics of the resulting interplanetary disturbance. A simple explana-tion is possible for this relaexplana-tion: Major events include im-portant Aares. This leads to a tendency to relate them (Cane, 2000). A similar statistical relation exists between FD and magnetic storms. Not all solar Aares and CMEs are followed by magnetic storms. In one of the earlier studies, Shukla et al. (1979) indicate that large solar wind streams associ-ated with solar Aares produced large decreases of CR inten-sity and variations of geomagnetic Celd; streams that are not associated with any Aare produce only geomagnetic Celd variations and that they do not change the CR intensity. Therefore, it may be expected that only some important CMEs cause enough disturbance that leads to a geomag-netic storm. Models for maggeomag-netic clouds indicate thickness of magnetosheaths of CMEs (Russell and Mulligan, 2000). It would be interesting to interpret the Forbush decreases by means of the magnetosheaths of the CMEs.
2. Aim of the experiment
Our experiment has been performed using a basic coin-cidence circuit set aiming to locally detect Aare and CME eDects on secondary CR. The aim of the experiment is to investigate
1. The possibility to observe the Aare triggered CR intensity increases
2. To observe the CME originated CR intensity decreases (FD), to measure their amount and to see if the decreases due to the shock and ejecta are separable.
3. The experimental set-up
The Institute of Nuclear Physics of the Istanbul Tech-nical University (41.1N and 29.0E) did the CR intensity measurements. The experimental set-up employed two iden-tical Teledyne Isotopes scintillation counters, each contain-ing a Tl activated NaI crystal, 7:6 cm in diameter × 7:6 cm in height. These are integrally mounted to photomultiplier tubes and hermetically sealed with Al shielding, thus elimi-nating CR electrons and the gamma rays which are too slow. Actually, the experiment was adjusted for the measurement of slow gamma ray photons, since these are more
sensi-tive to CR intensity changes. The energy range of our ex-periment is about 0.5–1:5 MeV. The power supply applied 1000 V to the photomultiplier tubes. The coincidence circuit and the timer are driven by a PC. Same experimental set-up has been used in a previous study where variation of CR in-tensity during a solar eclipse has been measured (Kandemir et al., 2000). The electron–photon Auxes recorded by sim-ilar scintillation counters as well as NMwhich observe proton–neutron Auxes observed secondary CR which are the products of primary CR protons, alpha particles and heavier nuclei with much higher energies. Only NMcan detect some lower energy neutrons and they may detect the solar protons produced during Aare events. Thus, photons recorded by our detector are the soft component of secondary CR which are generated in the electron–photon cascade in the atmosphere. 4. The experiment
The sun was extraordinarily active during June and July 2000. Totally, there were seven X class X-ray Aares re-ported during this period. NOAA’s Space Environment Cen-ter reported two X-type Aares on June 6 and one on June 7 (The other X-type Aares were on June 18, July, 11, 12 and 14). It has been reported by NASA Space Weather Bureau that an interplanetary shock wave from June 6 CME passed NASA’s ACE satellite at 08:41 UT on June 8 and arrived at Earth about an hour later. It has also been reported that ACE recorded a sudden increase of solar wind velocity from 522 to 734 km=s in 1 min, i.e., from 08:41 UT to 08:42 UT as well as recording a doubling of proton density in the same time interval.
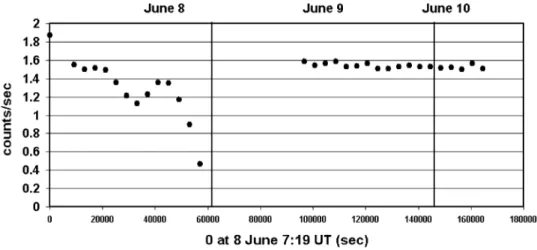
CR intensity decreases that seem to be due to the shock and ejecta on June 8 are recorded in our Istanbul Technical University experiment. The Crst decrease in Fig. 1 seems to indicate the shock on June 8. Its start, which should be the arrival of the shock, is with 1.55 counts=second (c=s) at 9:52 UT (also at 9000 s in Fig. 1). The minimum value at the ejecta is 1:50 c=s at 10:00 UT (13; 000 s). Recovery near the pre-shock values is with 1:51 c=s at 12:05 UT (17; 000 s). The values 1.55 and 1:51 c=s indicate a decrease of 2.45%. The second sharper decrease of counts start with 1:49 c=s at 13:12 UT (21; 000 s) and probably indicate the arrival of the ejecta. Its minimum value recorded in our experiment is 1:125 c=s at 16:32 UT (33; 000 s). This means that the counts drop by 24.4%. Measurements recover up to 1:36 c=s at 18:45 UT (41; 000 s). There was an interruption in the experiment until 10:10 UT the next day when the counts were at the level of 1:58 c=s.
Our experiment seems to detect FD; but it is not capable of detecting the solar protons. Fig. 2 gives CR counts for June 8, 2000 and for the following 40 days. The counts are recorded every 4000 s. Daily averages are deCned as their mean value. The measurements start with 1:55 c=s on June 8 and drop down to 1:4 c=s after the FD and remain around the level of 1:4 c=s until the end of June. This trend seems to continue
G. Kandemir et al. / Planetary and Space Science 50 (2002) 633–636 635
Fig. 1. CR counts of June 8–10, 2000. X -axis values start on 8 June, 2000 at 7:20 UT and ends on 10 June, 2000 at 5:00 UT.
Fig. 2. Daily average values of CR counts for 40 days starting on June 8, 2000. Counts start at 7:19 UT on June 8 and end on July 17, 2000.
during July as can be seen from Fig. 2. A cumulative eDect of solar activity seems to lower the CR intensity during the very active period of June–mid July 2000. The X-5 class Aare on July 14 is known to cause a full halo CME and a severe magnetic storm on July 15–16. In our experiment, it was not possible for this CME to recognize the shock and ejecta as done for the previous CME.
5. Results of the experiment
1. The experiment was not sensitive for any Aare events. This is in agreement with expectation. Only NMcan detect solar low energy protons.
2. It was possible to observe the Forbush decrease starting on June 8 which was caused by full halo CMEs associated with the Aares of June 6 and 7. The experiment indicates that during some strong solar modulation, local counts of secondary CR intensity values may drop down as much as 30% compared to the pre-shock values.
3. The trend of values during the active period June–July 2000 indicate a net decrease of CR. A recovery is ob-served towards the end of July.
Acknowledgements
We would like to express our thanks to the Director of the Nuclear Energy Institute of Istanbul Technical Univer-sity, Prof. Dr. Ertugrul Yazgan and to the Chairman of the Division in charge of the laboratories, Prof. Dr. Sar-man Gencay for permission to use the laboratories. This research has made use of NASA’s Astrophysics Data Sys-tem Bibliographic Services, information on the web pages of NASA Space Weather Bureau and NOAA, Space Envi-ronment Center.
References
Cane, H.V., 2000. Space Sci. Rev. 93 (1=2), 55–57.
Cane, H.V., Richardson, I.G., von Rosenvinge, T.T., Wibberenz, G., 1994. J. Geophys. Res. 99, 21,429–21,441.
636 G. Kandemir et al. / Planetary and Space Science 50 (2002) 633–636 Cane, H.V., Richardson, I.G., von Rosenvinge, T.T., 1996. J. Geophys.
Res. 101, 21,561–21,572.
Fenton, A.G., Fenton, K.B., Humble, J.E., 1984. Astron. Soc. Aust. Proc. 5, 590–593.
Hundhausen, A.J., 1996 In: Kivelson, M.G., Russell, C.T. (Eds.), Introduction to Space Physics. Cambridge University Press, Cambridge, pp. 91–128.
Kandemir, G., Guclu, M.C., Geckinli, M., Firat, C., Boydag, S., Ozguc, A., Yasar, T., 2000. In: Livingston, W., Ozguc, A. (Eds.), The Last Total Eclipse of the Millennium in Turkey. ASP Conference Series, Vol. 205, pp. 202–207.
Lindsay, G.M., Luhman, J.G., Russell, C.T., Gosling, J.T., 1999. J. Geophys. Res. 104, 12,515–12,523.
Makela, P., Torsti, J., Teittinen, M., Valtonen, E., Riihonen, E., Ipavich, F., 1998. Observations of galactic cosmic ray modulation during Earth-directed coronal mass ejections. Geophys. Res. Lett. 25, 2951– 2954.
Russell, C.T., Mulligan, T., 2000. In: Intercomparative Magnetosheath Studies, Antalya, Turkey, September 4–8. (Abstract Book, 35). Shukla, J.P., Shukla, A.K., Singh, R.L., Agrawal, S.P., 1979. Indian J.