Low-temperature photoluminescence study of GaS
0.5Se
0.5layered crystals
A. Aydınlı
a,*, N.M. Gasanly
b,1, K. Go¨ks¸en
ba
Department of Physics, Bilkent University, Ankara, 06533, Turkey
b
Department of Physics, Middle East Technical University, Ankara, 06531, Turkey (Refereed)
Received 23 January 2001; accepted 28 February 2001
Abstract
Photoluminescence (PL) spectra of GaS0.5Se0.5 layered single crystals have been studied in the
wavelength range of 565– 860 nm and in the temperature range of 15–170 K. Two PL bands centered at 585 nm (2.120 eV) and 640 nm (1.938 eV) were observed at T⫽ 15 K. Variations of both bands were studied as a function of excitation laser intensity in the range from 10⫺3to 15.9 W cm⫺2. These bands are attributed to recombination of charge carriers through donor-acceptor pairs located in the band gap. Radiative transitions from shallow donor levels located at 0.029 and 0.040 eV below the bottom of the conduction band to deep acceptor levels located 0.185 and 0.356 eV above the top of the valence band are suggested to be responsible for the observed A- and B-bands in the PL spectra, respectively. A simple energy level diagram explaining the recombination process is proposed. © 2001 Elsevier Science Ltd. All rights reserved.
Keywords: A. Chalcogenides; A. Semiconductors; D. Optical Properties; D. Luminescence
1. Introduction
GaS0.5Se0.5is a well known layered crystal and is based on the GaSe–GaS system, and has
an indirect band gap of 2.27 and 2.334 eV at T⫽ 300 and 15 K, respectively [1–3]. GaSe
and GaS crystals crystallize in a layered structure and form a series of mixed crystals
* Corresponding author. Tel.:⫹90-312-290-1579; fax: ⫹90-312-266-4579. E-mail address: [email protected] (A. Aydinli).
1
On leave from Physics Department, Baku State University, Baku, Azerbaijan.
0025-5408/01/$ – see front matter © 2001 Elsevier Science Ltd. All rights reserved. PII: S 0 0 2 5 - 5 4 0 8 ( 0 1 ) 0 0 6 3 5 - 3
GaSxSe1⫺x(0ⱕ x ⱕ 1). Characteristic of these mixed crystals is the fact that the interlayer bonding is weak and van der Waals like, whereas the intralayer bonding is covalent and strong. There are four modifications of the crystal structure for GaSe, i.e.,ε, , ␥, ␦, while GaS solidifies only in the modification. The crystal structure of GaSxSe1⫺xis frequently
polymorphic and depends on x. For x ⫽ 0.5, the GaSxSe1⫺x mixed crystal is a mixture of
the ε- and -polytypes [4]. The exact nature of the crystalline structure present in a
semiconductor may be important in determining the electrical and optical properties of the crystal. It has already been established that different crystal modifications in GaSe lead to slightly different band gaps [5].
In view of possible optoelectronic device applications in the visible region [6], a great deal of attention has been devoted to the study of the optical and electrical properties of binary
layered gallium chalcogenides [7–10]. Long-wavelength optical phonons in GaSxSe1⫺x
layered mixed crystals were studied by IR reflection and Raman scattering experiments [11–14]. Recently, we have studied the photoluminescence (PL) of GaS layered crystal in the 9 –300 K temperature range and observed broad emission bands. They were assigned to donor-acceptor pair (DAP) recombination [15]. PL spectra of GaS0.5Se0.5crystals have been measured at T⫽ 77 K in the visible range and deep level luminescence observed at 536, 585, and 645 nm has been attributed to gallium vacancies without any explanation [16]. Near band edge luminescence from a series of GaSxSe1⫺xmixed crystals have also been measured at T⫽ 4.2 K and attributed to recombination on shallow donor and acceptor states (EA⫽ ED⫽
25 meV). They were thought to be due to structural defects [2]. However, to our knowledge, there is no data on temperature and excitation intensity dependence of PL spectra in GaS0.5Se0.5crystals in the literature.
In the present paper, we report the results of PL investigation of GaS0.5Se0.5crystals in the 565– 860 nm wavelength and in the 15–170 K temperature ranges. The PL emission from GaS0.5Se0.5at wavelengths shorter than 565 nm are of excitonic origin and do not enter in the scope of this work. The shift of the emission band peak energy as well as the change of the intensity of the emission band with temperature and excitation laser intensity is also studied. Analysis of the data suggests that the radiative transitions originate from recombi-nation of photoexcited carriers over donor-acceptor pairs or defects acting as such. Finally, a scheme for the impurity levels taking part in the observed PL is proposed.
2. Experimental
GaS0.5Se0.5 polycrystals were first synthesized from high-purity elements (at least
99.999% pure) prepared in stoichiometric proportions. Then single crystals of GaS0.5Se0.5 were grown by the modified Bridgman method. The analysis of X-ray diffraction data showed that GaS0.5Se0.5 crystallized in a hexagonal unit cell, with lattice parameters: a⫽
0.3671 and c⫽ 1.5719 nm. The samples were prepared by cleaving an ingot parallel to the
crystal layer (i.e., perpendicular to the c-axis). Typical sample dimensions were 4⫻ 3 ⫻ 0.7 mm3. The electrical conductivity of the samples was n-type as determined by the hot probe method. A “Spectra-Physics” argon ion laser operating at 488.0 nm was used as the excitation source. The PL was collected from the laser illuminated face, in a direction close 1824 A. Aydinli et al. / Materials Research Bulletin 36 (2001) 1823–1832
to the normal to the c-axis. To minimize the possibility of laser-induced damage, a cylin-drical lens with a focal length of 20 cm was used in the focusing optics. A “CTI-Cryogenics M-22” closed-cycle helium cryostat was used to cool the crystals from room temperature down to 15 K. The surface of the sample was freshly cleaved, just prior to loading onto the
cold finger of the cryostat. The temperature was controlled within an accuracy of⫾0.5 K.
The PL spectra were analyzed in the 565– 860 nm wavelength range using a “U-1000 Jobin-Yvon” double grating spectrometer and a cooled GaAs photomultiplier equipped with the necessary photon counting electronics. All spectra have been corrected for the spectral response of the optical apparatus. A set of neutral-density filters was used to adjust the excitation laser intensity from 10⫺3to 15.9 W cm⫺2.
3. Results
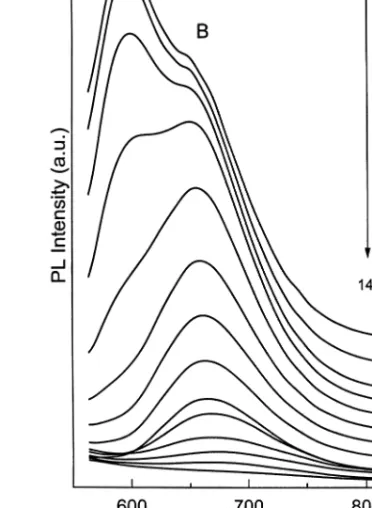
Typical deep level luminescence spectra of the GaS0.5Se0.5 single crystals are shown in Fig. 1 as a function of temperature from 15 up to 170 K in the wavelength region 565– 860 Fig. 1. PL spectra of GaS0.5Se0.5in the temperature range of 15–170 K. Excitation laser intensity L⫽ 15.9 W
nm at a constant excitation density of 15.9 W cm⫺2. The observed PL bands vanish above 170 K. We observe two emission bands centered at 585 nm (2.120 eV, A-band) and 640 nm (1.938 eV, B-band) in the PL spectrum at 15 K. In contrast with GaS crystal [15] there are no signs of bands in the near infrared part of the spectrum. It is seen from the spectra that the observed bands change their intensities and positions as the temperature increases. While the intensities of both bands decrease with increasing temperature, it is clear from Fig. 1 that A-band quenches earlier than the B-band. Both peaks show varying degrees of red shift with increasing temperature. The full temperature dependence of the band gap of GaS0.5Se0.5has been reported in [1–3,5], and the temperature coefficient of the band gap was shown to be negative. As the peak energy due to a donor-acceptor pair transition should decrease with the band-gap energy, the observed red shift of the two bands is in agreement with the hypothesis of a recombination over donor-acceptor pairs.
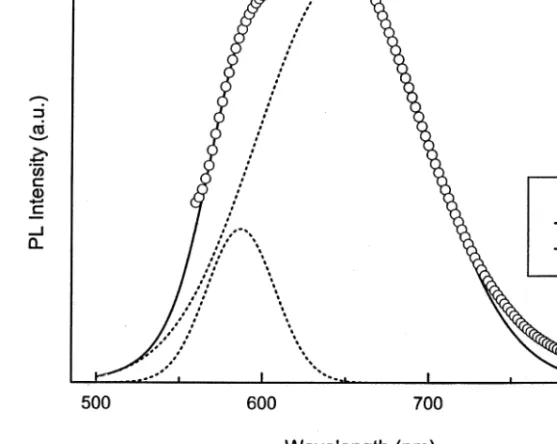
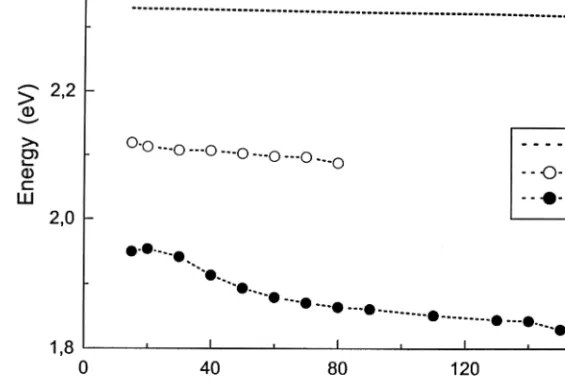
All spectra have been analyzed by using a fitting procedure to deconvolve the bands. A typical result of fitting two Gaussian peaks to A- and B-bands is shown in Fig. 2. The best fit to the data correspond to Gaussian lineshapes. The procedure yields the peak position, full-width at half-maximum (FWHM) and intensity of the bands. The data obtained from this analysis for the peak energy position as a function of temperature are displayed in Fig. 3. For comparison, the variation of the indirect band gap of GaS0.5Se0.5as a function of temperature is also plotted. First, it should be noted that the band-gap energy of GaS0.5Se0.5does not show a large decrease upon increasing
Fig. 2. Deconvolution of the PL spectra into two Gaussian lineshapes at T⫽ 40 K. 1826 A. Aydinli et al. / Materials Research Bulletin 36 (2001) 1823–1832
the temperature from 15 to 170 K. Furthermore, the magnitude of the observed peak energy shift for both bands is greater than that of the band-gap energy with temperature while the peak energy of the A-band shows a red shift of 0.032 eV, the B-band shows a red shift of 0.130 eV. The difference in energy shift of both bands suggests that the centers responsible for the observed recombination is not necessarily the same, but similar. The observed red shift for both bands is indicative of donor-acceptor pair recombination [17] and, the observed behavior of the peak energy positions for both bands satisfies the temperature dependence expected for the donor-acceptor pair recombination.
From Fig. 1, it is clear that the emission band intensities for both bands decrease with increasing temperature. Rapid thermal quenching is observed at temperature as low as 50 K for A-band and 90 K for B-band. The experimental data for the temperature dependence of the PL intensities at the emission band maximum can be fitted by the following expression:
I(T)⫽ Io exp
冉
⌬E
kT
冊
(1)where Io is a proportionality constant, ⌬E is the thermal activation energy, and k is the
Boltzmann constant. Fig. 4 shows the temperature dependence of the emission band maxi-mum intensity as a function of reciprocal temperature in the 15–170 K range. Fitting Eq. (1) to the high temperature parts of the plot in Fig. 4, we find an activation energy of about 0.029
eV for the A-band and 0.040 eV for the B-band. Since GaS0.5Se0.5 is an n-type
semicon-ductor as measured by the hot probe technique, we consider that the impurity levels are donor Fig. 3. Temperature dependencies of the A- and B-bands peak energies for GaS0.5Se0.5. Temperature dependence
levels located 0.029 and 0.040 eV below the bottom of the conduction band. The energy values of these donor levels are compared with two donor levels at 0.013 and 0.017 eV that we recently identified in the visible part of the spectrum of GaS [15]. Such shallow donor levels in GaS0.5Se0.5 may originate from deviations in stoichiometry in the form of point defects. In the past, Ga vacancies have been invoked to account for these defects as the origin of the observed PL spectra [16].
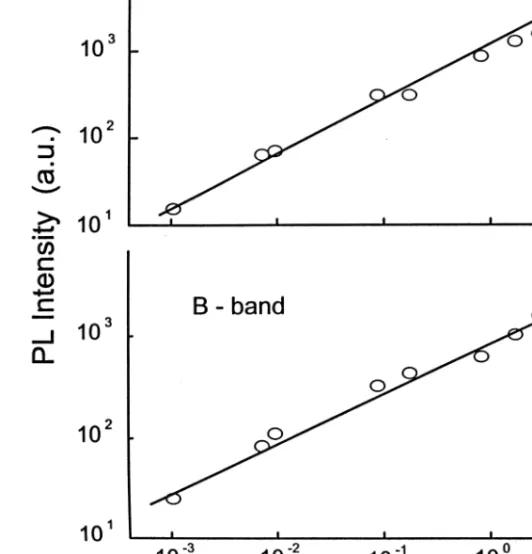
Excitation intensity dependence of the PL spectra should also provide valuable information towards identification of the recombination mechanism responsible for the observed luminescence. A deconvolution procedure also applied to spectra obtained at different excitation intensities that yielded the peak energy position, FWHM and the intensity of both A- and B-bands in this case. We find that neither the FWHM nor the peak position of the bands change with increasing excitation intensity. In contrast with inhomogenously distributed donor-acceptor pairs where increasing laser intensity excites more pairs that are closely spaced leading to blue shift of the peak energy of the observed band [17], this result suggests that the donor-acceptor pairs are located at only closely Fig. 4. PL intensity of A- and B-bands at the maximum of the emission intensity as a function of reciprocal temperature. The arrows at 50 and 90 K show the starting points of intensive quenching.
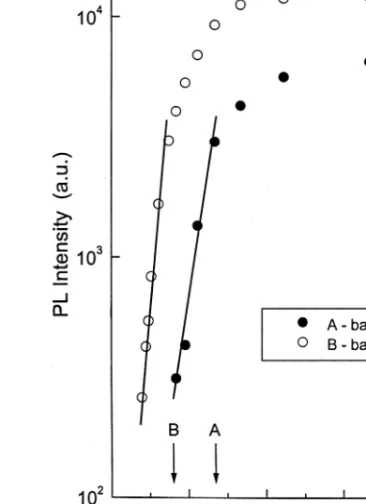
spaced sites and are distributed homogenously. As is the case in other gallium chalco-genides, we believe that these pairs are due to defects in the crystal. Since the calcula-tions on the formation energy of the defect pairs suggest that formation energy of a defect pair may be lower than the sum of two individual defects formation energies, concentration of closely spaced paired defects could easily dominate in crystals such as GaS0.5Se0.5[18]. On the other hand, the intensity of the peak energy maximum increases with increasing excitation intensity which is also characteristic of donor-acceptor pair recombination. The log-log plot in Fig. 5 shows the excitation laser intensity dependence of the PL intensity. The experimental data can be fitted by a simple power law of the form
I␣L␥ (2)
Fig. 5. Dependencies of the PL intensity at the A- and B-bands maximum versus excitation laser intensity at T⫽ 15 K. The solid curves give the theoretical fits using Eq. (2).
where I is the PL intensity, L is the excitation laser intensity and ␥ is a dimensionless exponent. We find that the PL intensity at the emission maximum increases sublinearly (i.e. ␥ ⫽ 0.63 for A-band and ␥ ⫽ 0.51 for B-band). It is well known that for excitation laser
photon energy exceeding the band gap energy, Eg, the exponent␥ is generally 1 ⬍ ␥ ⬍ 2
for free and bound exciton emission, while␥ ⱕ 1 for free-to-bound and donor-acceptor pair recombination [19].
The analysis of the observed PL spectra as a function of both the temperature and excitation laser intensity permits us to propose a possible scheme for the donor-acceptor levels located in the band gap of GaS0.5Se0.5. These donor-acceptor levels are involved in the radiative recombination of photoexcited carriers observed in GaS0.5Se0.5. Thus, two shallow donor levels d1 and d2are located 0.029 and 0.040 eV below the bottom of the conduction
band, respectively.
We recall the general expression for the emission energy of the donor-acceptor pair [20]: ប ⫽ Eg⫺ EA⫺ ED⫺
ZAZDe2
εR (3)
where Egis the band gap energy of GaS0.5Se0.5, EDand EAare the donor and acceptor level
energies, R is the distance between pairs, ZDand ZAare the charge states of the donor and
acceptor sites, εis the dielectric constant. Neglecting the fourth term in the above equation which is a correction for Coulombic interaction between the pairs and is effective at short Fig. 6. Proposed energy band diagram for the observed deep level luminescence in GaS0.5Se0.5at T⫽ 15 K.
distances, we find the acceptor levels a1and a2above the top of the valence band at 0.185
and 0.356 eV, respectively.
At low temperatures, photoexcited charge carriers are bound to donors and acceptors and recombine with closest neighbors due to their short diffusion lengths. As the temperature is increased resulting in longer charged carrier diffusion lengths, pairs that are further apart are also involved in the recombination process. As Eq. (3) makes it clear, contribution from pairs with larger separation results in red shift of the peak energy of the observed band. This is the case for both bands. The smaller shift of the A-band upon temperature rise indicates that the distribution of the donor-acceptor pair separations involved in the recombination is restricted to narrower range of R values than those involved in B-band.
Sublinear PL intensity with excitation laser intensity is also consistent with donor-acceptor recombination [19]. Our analysis shows that the peak energy positions of the observed bands do not shift with increasing laser excitation intensity in line with the fact that the states involved in the recombination are indeed close pairs. If the donor-acceptor pair distances were heterogeneous in nature, then Eq. (3) indicates that increasing the excitation laser intensity should show a blue shift of the peak energies of the observed PL bands which is clearly not observed.
In conclusion, we have measured the low temperature PL spectra of GaS0.5Se0.5crystal grown by the Bridgman method as a function of temperature and excitation laser intensity. We have found two emission bands centered at 585 nm (2.120 eV, A-band) and 640 nm (1.938 eV, B-band) in the PL spectrum at 15 K. The onset of strong quenching of the A-band is 50 K, whereas it is 90 K for the B-band. Both temperature and excitation laser intensity dependencies of the PL spectra suggest that shallow donor and deep acceptor levels in the
band gap of GaS0.5Se0.5 can account for the observed emission. The fact that the peak
energies do not show a blue shift upon increasing laser intensity indicate that both bands originate from closely spaced pairs. Smaller peak energy shift of the A-band with temper-ature in comparison to that of B-band suggests narrower range of pair separations. Since the samples are not intentionally doped, the donor and acceptor states are thought to originate from defects in the crystal.
Acknowledgement
We would like to thank C. Kocabas for his assistance.
References
[1] C. Manfredotti, A. Rizzo, A. Bufo, V.L. Cardetta, Phys Stat Solidi (a) 30 (1975) 375–382. [2] A. Mercier, J.P. Voitchovsky, J Phys Chem Solids, 36 (1975) 1411–1417.
[3] N.M. Gasanly, D. Sci. Thesis, Baku State University, Azerbaijan, 1986 (in Russian).
[4] A.G. Kyazymzade, N.M. Mekhtiev, Z.S. Samedov, V.I. Tagirov, Sov Phys Solid State 28 (1984) 737–738. [5] E. Aulich, J.L. Brebner, E. Mooser, Phys Stat Sol 31 (1969) 129 –131.
[6] A. Kyazymzade, R. Mekhtieva, A. Akhmedov, Sov Phys Semicond 25 (1991) 840 – 842. [7] V. Capozzi, Phys Rev B 28 (1983) 4620 – 4627.
[8] S. Shigetomi, T. Ikari, H. Nakashima, Phys Stat Sol (a) 156 (1996) K21–K24. [9] S. Shigetomi, T. Ikari, H. Nakashima, Jpn J Appl Phys 38 (1999) 3506 –3507. [10] S. Shigetomi, T. Ikari, Phil Mag Lett 79 (1999) 575–579.
[11] V. Riede, F. Levy, H. Neumann, H. Sobotta, Solid State Commun 34 (1980) 229 –231.
[12] N.M. Gasanly, A.F. Goncharov, N.N. Melnik, A.S. Ragimov, Phys Stat Sol (b) 120 (1983) 137–147. [13] M. Heyek, O. Brafman, R.M.A. Lieth, Phys Rev B 8 (1973) 2772–2779.
[14] A. Mercier, J.P. Voitchovsky, Solid Stat Commun 14 (1974) 757–762. [15] A. Aydinli, N.M. Gasanly, K. Goksen, J Appl Phys 88 (2000) 7144 –7149. [16] M.I. Karaman, V.P. Mushinkskii, Sov Phys Semicond 4 (1970) 464 – 465.
[17] P.Y. Yu, M. Cardona, Fundamentals of Semiconductors, Springer, Berlin 1995 (p. 348).
[18] J. Krustok, J.H. Schon, H. Collan, M. Yakushev, J. Madasson, E. Bucher, J Appl Phys 86 (1999) 364 –369. [19] T. Schmidt, K. Lischka, W. Zulehner, Phys Rev B 45, (1992) 8989 – 8994.
[20] P.Y. Yu, M. Cardona, Fundamentals of Semiconductors, Springer, Berlin 1995 (p. 344). 1832 A. Aydinli et al. / Materials Research Bulletin 36 (2001) 1823–1832