Background: Metabolic syndrome includes abdomi-nal obesity, diabetes type 2, hypertension, dyslipi-demia, derangements of fibrinolysis, and atheroscle-rosis. Since abdominal obesity is one of the major components of the insulin resistance syndrome (IRS), an attempt was made to evaluate the interrelation-ships between the magnitude of obesity and the com-ponents of the syndrome.
Methods: A cross-sectional study of 123 subjects with type 2 diabetes, of whom 31 were normal body weight and 92 had varying degrees of obesity was conducted. The participants were investigated in terms of clinical and laboratory findings of IRS. Fasting and 30-min (early) plasma glucose and serum insulin excursions in response to oral glucose chal-lenge (75 g) were determined. The peripheral and hepatic insulin resistance (insensitivity) was calculat-ed by homeostasis model assessment (HOMA).
Results: Clinical and biochemical findings were compared with the components of the IRS, and demonstrated that a rise in fasting as well as 30-min insulin secretion increases as abdominal body fat (obesity) increases. There was also a significant and proportional correlation between the magnitude of abdominal obesity and the components of metabolic syndrome.
Conclusion: Abdominal adiposity appears to have a pivotal role in the development of IRS.
Key words: Obesity, hyperinsulinemia, insulin resistance, macro- and microangiopathy, metabolic syndrome, dia-betes type 2, morbid obesity
Introduction
Several studies have demonstrated that atheroscle-rotic cardiovascular disorders are still the leading cause of death in middle-aged and elderly patients with obesity and type 2 diabetes.1,2Type 2 diabetes
associated with obesity may be accepted as “a visi-ble part of an iceberg” of the insulin resistance syn-drome (IRS). Zimmet3 describes this peculiar
pathology as “The New World Syndrome”. As a growing health problem, the components of meta-bolic syndrome, coupled with cigarette smoking, sedentary life, and a diet with high lipid and carbo-hydrate content (ie. fast-food habits) cause athero-sclerotic vascular disorders in many countries as well as in Turkey.4In this cross-sectional study, the
effects of graded obesity on insulin resistance and the interrelationships between the adiposity and clinical and biochemical components of metabolic syndrome were delineated.
Materials and Methods
A total of 123 type 2 diabetic patients with varying body weights and who have been treated with regu-lar sulfonylureas (tolbutamide, glipizide, glyburide) and/or biguanides (metformin) were recruited from
Effect of Abdominal Obesity on Insulin Resistance
and the Components of the Metabolic Syndrome:
Evidence Supporting Obesity as the Central Feature
Çavlan Türkoglu, MD
1; Belgin Süsleyici Duman, PhD
2; Demet Günay,
PhD
3, Penbe Çagatay, PhD
4; Remzi Özcan, MD
1; A. Sevim Büyükdevrim,
MD
51
Kadir Has University, School of Medicine, Dept. of Cardiology;
2Kadir Has University, School of
Medicine, Dept. of Medical Biology and Genetics;
3Florence Nightingale Hospital, Biochemistry
Laboratory;
4Istanbul University, Cerrahpasa School of Medicine, Dept. of Bio-statistics;
5Florence
Nightingale Hospital, Dept. of Endocrinology and Metabolic Disorders, Istanbul, Turkey
Reprint requests to: Assoc. Prof. Dr. Çavlan Türkoglu, Kadir Has University, Medical Faculty, Dept. of Cardiology, Istanbul, Turkey. Fax: 00 90 212 224 49 82; e-mail: [email protected]
the Clinics of Florence Nightingale Hospital, Istanbul. Diabetic subjects who were treated with insulin, were taking drugs causing glucose intoler-ance, and who had any endocrinologic, metabolic, hepatic and renal disorders were excluded, except the early phase of diabetic nephropathy without renal insufficiency. All medications were stopped 2 days before the study, for a washout period.5 This
study was conducted in accordance with the 1964 Declaration of Helsinki and The French Guidelines and Recommendations for Good Clinical Practice in type 2 diabetes,6and the participants gave informed
consent.
Fasting blood samples were taken after an overnight fast (12 h) for determination of plasma glucose, serum insulin levels, lipid profile (total cholesterol, HDL-cholesterol, LDL-cholesterol, and triglycerides), BUN, creatinine, and uric acid con-centrations. A 75-g oral glucose dose was ingested after an overnight fasting (12 h) period. Plasma glu-cose and serum insulin concentrations of the blood samples obtained at 10 minutes before, 0 point and 30 minutes after oral glucose challenge were deter-mined. The mean values of fasting plasma glucose and serum insulin that are necessary for the calcula-tion of HOMA were the arithmetical mean of –10 and 0 times values of blood samples.7The diagnosis
of type 2 diabetes was based on the criteria of the World Health Organization of 1999.8For evaluation
of arterial blood pressure, the Sixth Report of the Joint National Committee on Prevention, Detection, Evaluation, and Treatment of High Blood Pressure9
was used Serum LDL-cholesterol and triglyceride levels >100 mg/dl and >200 mg/dl (2.3 mmol/liter), respectively, and HDL-cholesterol <40.0 mg/dl were accepted for the diagnosis of dyslipidemia.10
Obesity was graded according to Garrow’s crite-ria,11based on body mass index (BMI). The ratio of
waist-to-hip circumference (WHR) was used as body fat distribution. For the definition of metabol-ic syndrome, the criteria of the provisional WHO reports of Alberti and Zimmet were used.12
The plasma glucose concentration was measured by the glucose oxidase method using the kit of Biotrol on Bayer/opeRA Analyser. Serum insulin determination was made by the electrochemilumis-cence immunoassay “ECL” on the Roche Elecsys 1010 and 2010 immunoassay analyzer without cross-reactivity with proinsulin or split-proinsulin
products. Serum total cholesterol was measured using the commercial kit of Biotrol. HDL-choles-terol was measured using commercial Randox’s kit. LDL-cholesterol was calculated by the formula of Friedewald. Triglyceride determination was made by the method of lipase/glycerol kinase UV end-point on an opeRA Analyser. Urinary microalbumin concentration was measured by an immunoassay method. Serum total cholesterol, HDL-cholesterol, LDL-cholesterol, and triglyceride concentrations were measured by enzymatic assays on opeRA analyser. For the serum BUN, creatinine, and uric acid determinations an opeRA otoanalyser was used.
BMI was calculated as weight (kg) divided by height (m) squared (kg/m2), as an index of overall
obesity. Garrow’s criteria were based on BMI; namely, non-obese patients were considered to be those of BMI were 20.0-24.9; obese patients were divided into three grades according to their BMI: grade I obesity, 25.0-29.9; grade II obesity, 30.0-39.9; grade III obesity, >40.0.11The amount of body
fat tissue was calculated by the formula depicted by Hume.13The rate of insulin resistance and hepatic
insulin sensitivity were evaluated by the homeostat-ic model assessment (HOMA) of Matthews et al,7
and for their calculations the formula of Bonora et al14 and Matsuda and DeFronzo15 were utilized,
respectively. The 30-min serum insulin and glucose excursion from the basal value (absolute incre-ments) and their ratio (insulinogenic index of early insulin secretion (DI30-F/DG30-F) were considered as
early responses of insulin secretion to the oral glu-cose challenge, and the values obtained from the patients with normal body weight were compared with that of graded obese patients.
Statistical analyses were conducted using Unistat 5.1 software. Clinical characteristics were compared among type 2 diabetic patients separately for each obesity grade. These analyses were compared using analysis of variance (one-way ANOVA). The fasting insulin, fasting glucose, first 30 min insulin excur-sion and first 30 min insulinogenic index were com-pared for each obesity grade with normal weight diabetics with one-way ANOVA and Dunnett test. Data are expressed as means ± SE. For categorical variables, c2 testing was used to assess differences
in proportions (or Fisher’s exact test when cell fre-quencies were small). P-values <0.05 were
consid-ered statistically significant.
Results
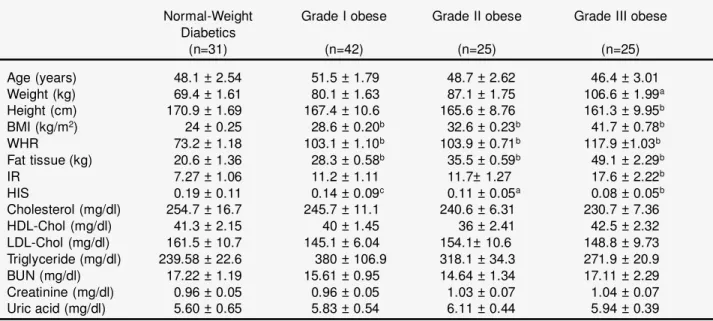
The clinical and metabolic parameters of the partic-ipants are given in Table 1. The amounts of body fat, and the measures of BMI and WHR of obese partic-ipants were significantly and proportionally differ-ent from that of the patidiffer-ents with normal body weight (P<0.001). The abdominal localization of body fat was observed in all obese participants with varying degree. The HOMA scores of peripheral insulin resistance and hepatic insulin sensitivity of graded obese diabetic subjects were also different, with different significance from that of the patients with normal body weight (Table 1). Although lipid profiles of the study groups indicate that there is a manifest dyslipidemia (LDL>100 mg/dl, HDL<40.0 and triglyceride ³200 mg/dl), a difference was not found between the study groups. Furthermore, the levels of BUN and creatinine were normal, indicat-ing that there was no renal dysfunction in the study patients, except microalbuminuria.
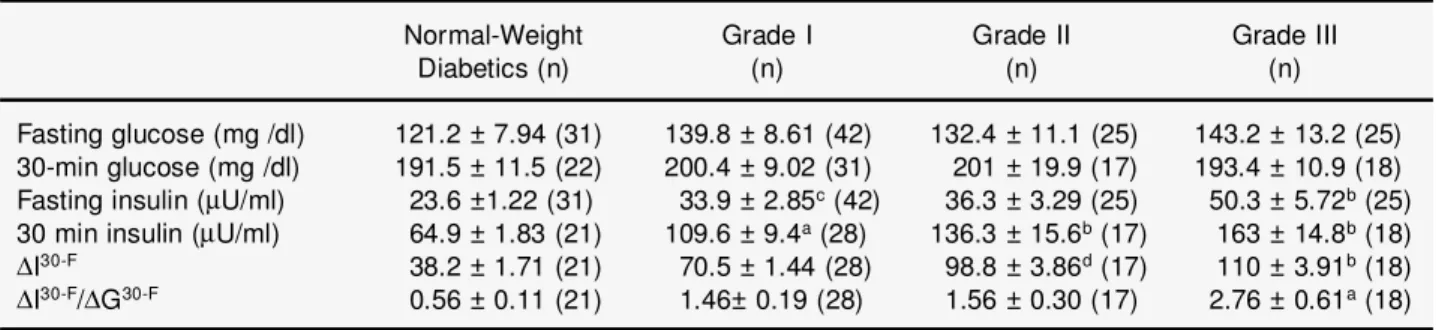
The fasting insulin values and the first 30-min absolute insulin excursion (DI30-F) and insulinogenic
index (DI30-F/DG30-F), as the measures of early
insulin-secretion response to glucose, and statistical analysis in the participants who have different body weights are presented in Table 2. Fasting insulin lev-els as well as the first 30-min insulin increments of graded obese diabetics were found to be significant-ly different from that of normal body weight (Figure 1). The first 30-min insulinogenic index (DI 30-F/DG30-F) levels were also significantly higher in
grade-III obese subjects compared with normal body weight diabetics (Figure 2).
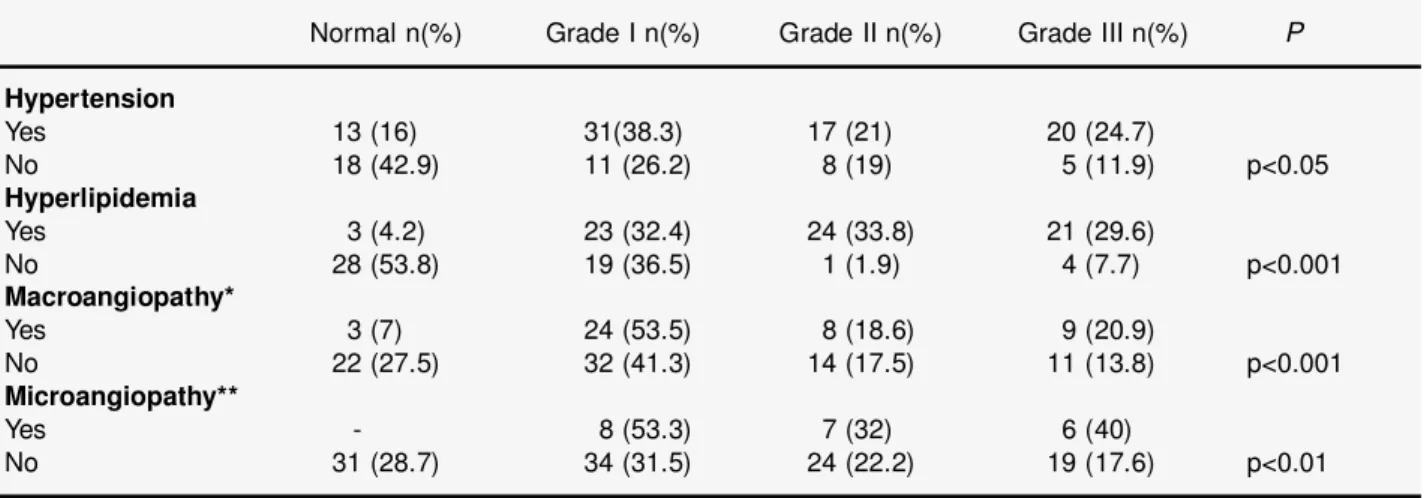
Table 3 indicates the frequencies of the compo-nents of metabolic syndrome in the patients with normal and different body weights. It was found that there is a significant difference between the obese groups and the patients with normal body weight in terms of frequencies of hypertension (P<0.05), dys-lipidemia (P<0.001), macroangiopathy (P<0.001) and diabetic microangiopathy (P<0.01).
Discussion
The results of the study suggest that central obesity
per se may be a consistent clinical feature of the metabolic syndrome as a principal causative factor.
Table 1. Clinical and metabolic parameters of the NIDDM patients on the basis of body mass index
Normal-Weight Grade I obese Grade II obese Grade III obese Diabetics (n=31) (n=42) (n=25) (n=25) Age (years) 48.1 ± 2.54 51.5 ± 1.79 48.7 ± 2.62 46.4 ± 3.01 Weight (kg) 69.4 ± 1.61 80.1 ± 1.63 87.1 ± 1.75 106.6 ± 1.99a Height (cm) 170.9 ± 1.69 167.4 ± 10.6 165.6 ± 8.76 161.3 ± 9.95b BMI (kg/m2) 24 ± 0.25 28.6 ± 0.20b 32.6 ± 0.23b 41.7 ± 0.78b WHR 73.2 ± 1.18 103.1 ± 1.10b 103.9 ± 0.71b 117.9 ±1.03b Fat tissue (kg) 20.6 ± 1.36 28.3 ± 0.58b 35.5 ± 0.59b 49.1 ± 2.29b IR 7.27 ± 1.06 11.2 ± 1.11 11.7± 1.27 17.6 ± 2.22b HIS 0.19 ± 0.11 0.14 ± 0.09c 0.11 ± 0.05a 0.08 ± 0.05b Cholesterol (mg/dl) 254.7 ± 16.7 245.7 ± 11.1 240.6 ± 6.31 230.7 ± 7.36 HDL-Chol (mg/dl) 41.3 ± 2.15 40 ± 1.45 36 ± 2.41 42.5 ± 2.32 LDL-Chol (mg/dl) 161.5 ± 10.7 145.1 ± 6.04 154.1± 10.6 148.8 ± 9.73 Triglyceride (mg/dl) 239.58 ± 22.6 380 ± 106.9 318.1 ± 34.3 271.9 ± 20.9 BUN (mg/dl) 17.22 ± 1.19 15.61 ± 0.95 14.64 ± 1.34 17.11 ± 2.29 Creatinine (mg/dl) 0.96 ± 0.05 0.96 ± 0.05 1.03 ± 0.07 1.04 ± 0.07 Uric acid (mg/dl) 5.60 ± 0.65 5.83 ± 0.54 6.11 ± 0.44 5.94 ± 0.39
Values are presented as means ± SE.
As indicated in Table 1, HOMA scores for insulin resistance (peripheral as well as hepatic) signifi-cantly and proportionately increase as the body weight increases. In comparison with the fasting and first 30-min insulin secretion patterns as well as 30-min insulinogenic index between the graded obese groups and that of normal body weight, an almost linear relationship between the early insulin secretion patterns and the magnitude of body weight may be assumed (Table 2 and Figures 1 and 2). These findings are consistent with the results of our previous study.16 It has also been claimed that the
hyper-responsiveness of the endocrine pancreas to various stimuli seems to be a secondary manifesta-tion of insulin resistance that is a remarkable sign of the early stage of type 2 diabetes in the obese.17
Although the major cause of hypersecretion of insulin is insulin resistance, other factors such as decreased hepatic clearance and/or uptake of insulin because of decreased hepatic insulin sensitivity may also play a role.18
As mentioned before, there is considerable evi-dence that obesity, particularly the abdominal type, is associated with hyperinsulinemia in the fasting as well as postprandial period due to insulin resist-ance.17,19DeFronzo and Ferrannini,20describing the
clinical components of metabolic syndrome and the etio-pathogenic relationships between components, demonstrated that insulin resistance was a conse-quence of increased intra-abdominal adipose tissue mass. Castagneto et al21reported that insulin
resist-ance was normalized after stable weight reduction
Table 2. The comparison between fasting serum insulin, plasma glucose, first 30 min insulin excursion (DI30-F) and first 30-min insulinogenic index (DI30-F/DG30-F) after 75 g oral glucose challenge
Normal-Weight Grade I Grade II Grade III
Diabetics (n) (n) (n) (n)
Fasting glucose (mg /dl) 121.2 ± 7.94 (31) 139.8 ± 8.61 (42) 132.4 ± 11.1 (25) 143.2 ± 13.2 (25) 30-min glucose (mg /dl) 191.5 ± 11.5 (22) 200.4 ± 9.02 (31) 201 ± 19.9 (17) 193.4 ± 10.9 (18) Fasting insulin (mU/ml) 23.6 ±1.22 (31) 33.9 ± 2.85c(42) 36.3 ± 3.29 (25) 50.3 ± 5.72b(25) 30 min insulin (mU/ml) 64.9 ± 1.83 (21) 109.6 ± 9.4a(28) 136.3 ± 15.6b(17) 163 ± 14.8b(18)
DI30-F 38.2 ± 1.71 (21) 70.5 ± 1.44 (28) 98.8 ± 3.86d(17) 110 ± 3.91b(18)
DI30-F/DG30-F 0.56 ± 0.11 (21) 1.46± 0.19 (28) 1.56 ± 0.30 (17) 2.76 ± 0.61a(18) Values are presented as mean ± SE.
aP<0.05 vs normal weight diabetics;bP<0.001 vs normal weight diabetics;cP<0.01 vs Grade III; dP<0.01 vs normal weight diabetics.
0 0.5 1 1.5 2 2.5 3 Normal weight
diabetics Grade I obese Grade II obese Grade III obese Insulinogenic index 0 20 40 60 80 100 120 Normal weight diabetics
Grade I obese Grade II obese Grade III obese Insulin excursion
Figure 1. The results of the first 30-min absolute insulin
excursion (DI30-F) in diabetic patients with different body weights.
Figure 2. The results of first 30-min insulinogenic index
(DI30-F/DG30-F) in diabetic patients with different body weights.
with biliopancreatic diversion in morbidly obese patients. Carey and associates22 measured regional
adiposities, such as visceral-abdominal, subcuta-neous-abdominal, and peripheral non-abdominal, and insulin sensitivity; they compared these meas-ures in healthy obese women and found that abdom-inal obesity appears to be a major determinant of insulin resistance. Again, metabolic and cardiovas-cular risk factors greatly improved in obese patients after weight reduction by gastric banding.23,24
Abdominal adipose tissue is highly responsive to lipolytic stimuli, and large amounts of free fatty acids drain into the portal vein in obese subjects, impairing both hepatic and peripheral insulin sensi-tivity in obese diabetics.18As indicated in Table 1,
we found a close relationship between peripheral and hepatic insulin resistance and the magnitude of abdominal adiposity, assessed by BMI, body fat and WHR.
Visceral adipose tissue, as an endocrine organ,25
also secretes cytokines such as tumor necrosis fac-tor-a (TNF-a), and chemical messengers or hor-mones such as leptin, resistin, adiponectin, PAI-1, angiotensinogen. All these factors may act as mod-ulators to equilibrate the metabolic, hormonal and hydraulic status of the milieu intérieure, and result in insulin resistance. For these reasons, Björntorp26
put forward the concept of portal adipose tissue as an energy generator and causative factor for insulin resistance.
Since obesity is one of the important determining factors of hyperinsulinemia, and hyperinsulinemia and hyperglycemia in turn act as factors in the development of ischemic cardiovascular disorders, the interrelationship between the components of metabolic syndrome and the participants’ body weight intrigued us. Our study supports a positive correlation between the magnitude of abdominal obesity and the frequencies of the components of metabolic syndrome, such as type 2 diabetes, hyper-tension, dyslipidemia, atherosclerosis, and microan-giopathies (Table 3). In consideration of the patho-physiology of type 2 diabetes, one can focus on the respective role of adipose tissue together with islet, muscle tissues, and liver.27The primary disturbance
in diabetes appears to be the insulin action; fasting and postprandial hyperglycemia ensue despite hyperinsulinemia, because of insulin resistance.17,20
The link between visceral adiposity and type 2 dia-betes is well established.17,20Fasting
hyperinsuline-mia due to insulin resistance has correlated with the elevation in blood pressure in subjects with obesity and diabetes.21,28 It has also been found that
hyper-insulinemia is linked with dyslipidemia in obese and insulin resistant diabetics.29Similarly, dyslipidemia
observed in obese patients with insulin resistance creates an important risk factor for the development of atherosclerosis in both non-diabetic and type 2 diabetic obese individuals.30
Maison et al,31in a prospective population-based
Table 3. Incidence of different obesity grades in terms of metabolic syndrome components. Frequencies were
com-pared with Fisher’s exact test
Normal n(%) Grade I n(%) Grade II n(%) Grade III n(%) P
Hypertension Yes 13 (16) 31(38.3) 17 (21) 20 (24.7) No 18 (42.9) 11 (26.2) 8 (19) 5 (11.9) p<0.05 Hyperlipidemia Yes 3 (4.2) 23 (32.4) 24 (33.8) 21 (29.6) No 28 (53.8) 19 (36.5) 1 (1.9) 4 (7.7) p<0.001 Macroangiopathy* Yes 3 (7) 24 (53.5) 8 (18.6) 9 (20.9) No 22 (27.5) 32 (41.3) 14 (17.5) 11 (13.8) p<0.001 Microangiopathy** Yes - 8 (53.3) 7 (32) 6 (40) No 31 (28.7) 34 (31.5) 24 (22.2) 19 (17.6) p<0.01
*Includes coronary artery disease, cerebrovascular disease and peripheral atherosclerosis. **Includes diabetic retinopathy, nephropathy and neuropathy.
cohort study at a 4.5-year interval, analyzed the principal components of the metabolic syndrome such as blood glucose, blood pressure, and lipi-demia, and concluded that BMI was the central fea-ture of the syndrome. Numerous clinical and exper-imental investigations may have shed light on the mechanisms of vascular injury caused by sustained hyperinsulinemia. In this context, prandial and post-prandial hyperinsulinemia due to insulin resistance may result in a deleterious effect on the integrity of vascular tissue. Thus, insulin per se plays a major role in the development of atherosclerosis by increasing the formation and decreasing the regres-sion of lipid plaques, causing proliferation of smooth muscle cells, stimulating connective tissue synthesis, enhancing cholesterol synthesis and increasing LDL-receptor activity and activating growth factors within the arterial wall.32,33 In
addi-tion to the direct harmful effect of insulin, the other components of metabolic syndrome, such as hyper-glycemia, hypertension and dyslipidemia independ-ently and/or synergistically foster the development of coronary heart disease.
Our study has also disclosed that macroangiopa-thy coexists with microangiopamacroangiopa-thy (Table 3). The relation between two types of angiopathy may be a coincidence. However, the presence of many com-mon factors, such as genetic backgrounds, hyper-tension, hyperglycemia, dyslipidemia, and probably hyperinsulinemia, that may play a role in the gene-sis of microangiopathy, should be taken into account.
In conclusion, our study demonstrates that central obesity plays a crucial role in the development of metabolic syndrome.
References
1. Mykkänen L, Kuusisto J, Pyörälä K et al. Cardiovascular disease risk factors as predictors of Type 2 (non-insulin-dependent) diabetes mellitus in elderly subjects. Diabetologia 1993; 36: 553-9. 2. Morrish NJ, Wang SL, Stevens LK et al. WHO
Multinational Study Group: Mortality and causes of death in the WHO multinational study of vascular dis-ease in diabetes. Diabetologia 2001; 44 (Suppl 2): S14 - S21.
3. Zimmet PZ. Diabetes epidemiology as a tool to trig-ger diabetes research and care. Diabetologia 1999; 42: 499-518.
4. Onat A. Türkiye Kalp Raporu (Report for Cardiovascular Disorders in Turkey) 2000, Türk Kardioloji Dernegi (Turkish Cardiology Association), Yenilik Bas_mevi, Istanbul, 2000.
5. Lebovitz HE. Sulfonylurea drugs. In: Lebovitz HE, ed. Therapy for Diabetes Mellitus and Related Disorders, 2nd edn. Alexandria, Virginia: ADA Inc. 1994: 116-23.
6. Charbonnel B, ed. Suivi du patient diabétique de type 2 à l’exclusion du suivi des complications. Recommandations de l’ANAES. Diabetes & Metabolism 1999; 25 (Supp 2): 1-64.
7. Matthews DR, Hosker JP, Rudensky AS et al. Homeostasis model assessment: insulin resistance and b-cell function from fasting plasma glucose and insulin concentration in man. Diabetologia 1985; 28: 412-9.
8. World Health Organization: Definition, Diagnosis and Classification of Diabetes Mellitus and Its Complications. Geneva: World Health Organization, 1999.
9. The Sixth Report of the Joint National Committee on Prevention, Detection, Evaluation, and Treatment of High Blood Pressure. Arch Intern Med 1997; 157: 2313-46.
10.American Diabetes Association: Management of dys-lipidemia in adults with diabetes. Diab Care 2002; 25 (Supp 1): S74-S77.
11.Angelico F, Del Ben M, Giampaoli S et al. High prevalence of obesity in a rural community of central Italy. In: Baba S, Zimmet P, eds. World Data Book of Obesity. Excerpta Medica, Int Congress, Series 959, Amsterdam 1990: 5-9.
12.Alberti KG, Zimmet PZ. Definition, diagnosis and classification of diabetes mellitus and its complica-tions. I. Diagnosis and classification of diabetes mel-litus, provisional report of a WHO consultation. Diab Med 1998; 15: 539-53.
13.Hume R. Prediction of lean body mass from height and weight. J Clin Path 1966; 19: 389-95.
14.Bonora E, Targher G, Alberiche M et al. Homeostasis model assessment closely mirrors the glucose clamp technique in the assessment of insulin sensitivity: Studies in subjects with various degrees of glucose tolerane and insulin sensitivity. Diab Care 2000; 23: 57-63.
15.Matsuda M, DeFronzo RA. Insulin sensitivity indices obtained from oral glucose tolerance testing. Comparison with the euglycemic insulin clamp. Diab Care 1999; 22: 1462-70.
16.Devrim S, Koniçe M, Sencer E et al. Serum immunoreactive insulin response to oral glucose and intravenous sodium tolbutamide administration in relation to obesity. Israel J Med Sci 1972; 8: 815-20. 17.Reaven GM. Role of insulin resistance in human
dis-ease. Diabetes 1988; 37: 1595-1607.
18.Svedberg J, Bjöntorp P, Smith U et al. Free-fatty acid inhibition of insulin binding, degradation, and action in isolated rat hepatocytes. Diabetes 1990; 39: 570-4. 19.Bonadonna R, Groop L, Kraemer N et al. Obesity and
insulin resistance in man: a dose response study. Metabolism 1990; 39: 452-9.
20.DeFronzo RA, Ferrannini E. Insulin resistance. A multifaceted syndrome responsible for NIDDM, obe-sity, hypertension, dyslipidemia, and atherosclerotic cardiovascular disease. Diab Care 1991; 14: 173-94. 21.Castagneto M, De Gaetano A, Mingrone G et al.
Normalization of insulin sensitivity in the obese patient after stable weight reduction with biliopancre-atic diversion. Obes Surg 1994; 4:161-8.
22.Carey DG, Jenkins AB, Campbell LV et al. Abdominal fat and insulin resistance in normal and overweight women. Direct measurements reveal a strong relationship in subjects at both low and high risk of NIDDM. Diabetes 1996; 45: 633-8.
23.Nedelnikova K, Svacina S, Haas T et al. Influence of metabolic state and diabetes on the outcome at the end of first year after gastric banding. Obes Surg 2000; 10: 372-5.
24.Bacci V, Basso MS, Greco F et al. Modifications of
metabolic and cardiovascular risk factors after weight loss induced by laparoscopic gastric banding. Obes Surg 2002; 12: 77-82
25.Shuldiner AR, Yang R, Gong DW. Resistin, obesity, and insulin resistance – the emerging role of the adipocyte as an endocrine organ. N Eng J Med 2001; 345: 1345-6.
26.Björntorp P. “Portal” adipose tissue as a generator of risk factors for cardiovascular disease and diabetes. Arteriosclerosis 1990; 10: 493-6.
27.Reaven GM. The fourth Musketeer – from Alexandre Dumas to Claude Bernard. Diabetologia 1995; 38: 3-13.
28.Ferrannini E, Buzzigoli G, Bonadonna R et al. Insulin resistance in essential hypertension. N Eng J Med 1987; 317: 350-7.
29.Santen RJ, Willis PW, Fajans SS. Atherosclerosis in diabetes mellitus. Correlation with serum lipid levels, adiposity, and serum insulin level. Arch Intern Med 1972; 130: 833-43.
30.Adami GF, Ravera G, Marinari GM et al. Metabolic syndrome in severely obese patients. Obes Surg 2001; 11: 543-45.
31.Maison P, Byrne CD, Hales CN et al. Do different dimensions of the metabolic syndrome change togeth-er ovtogeth-er time? Evidence supporting obesity as the cen-tral feature. Diab Care 2001; 24: 1758-63.
32.Pyörälä K, Uustipa M, Laakso M et al. Macrovascular complications in relation to hyperinsulinaemia in non-insulin-dependent diabetes mellitus. Diabete & Metabolisme (Paris) 1987; 13: 345-9.
33.Stout RW. Insulin and atheroma: 20-yr perspective. Diab Care 1990; 13: 631-54.