Channel Estimation for Visible Light
Communications Using Neural Networks
Anil Yesilkaya, Onur Karatalay, Arif Selcuk Ogrenci, Erdal Panayirci
Kadir Has University Istanbul, Turkey
{ anil.yesilkaya, onur.karatalay, ogrenci, eepanay }@khas.edu.tr Ab�tract-Visible light communications (VLC) is an emerging
fiel� m technology and research. Estimating the channel taps is a
major requirement for designing reliable communication systems. Due to the nonlinear characteristics of the VLC channel those parameters cannot be derived easily. They can be calculated by !'leans of software simu!at�on. In this work, a novel methodology IS proposed for the predictIon of channel parameters using neural networks. Measurements conducted in a controlled experimental
s�tup are used to �rain neural networks for channel tap pre
dictIOn. Our experIment results indicate that neural networks can be effectively trained to predict channel taps under different environmental conditions.
I. INTRODUCTION
Op�ical wireless communications (OWC) has attracted great attentiOn of researchers and engineers recently. The spectrum bottleneck associated with great demand of high data rates for mobile data usage pushes researchers to develop new technologies for wireless communications such as, millimeter wave, free space optical, underwater acoustic communications. Visible light communications (VLC) is one of the promising technology that is considered for 5G or further commu nications standards. VLC has many advantages over radio frequency systems (RF) approximately 10.000 times bigger and �nregulated ba?dwidth, low cost for deployment, higher secunty and lower mterference from other RF devices [1].
. OWC comprises VL (visible light) and IR (infra-red) re giOns of the spectrum as indoor/outdoor wireless communica tions medium. Visible light communications (VLC) is a branch of OWC. operati?g in the V� (390nm-750nm) band. Intensity ModulatiOn 1 DIrect DetectiOn (IM/DD) method is accepted as the most applicable modulation technique to transmit data over visible light. In IM/DD data are coded on the small intensit� fluctuations. At the receiver, photo-detectors capture fluctuatiOns and convert them to digital data [2]. A proper channel model is one of the most important components to have robust, error-free and reliable wireless communications s.ystems. Despite the ever increasing popularity of the visible light communications, there is a lack of a proper VLC channel model. Obtaining an analytical expression for the channel is almost impossible due to the unpredictable changes in the environment. At this point, we propose that artificial neural net:vo�ks (ANN) can provide a practical and reliable approach. ArtifiCial neural networks are quite powerful tools to model the relationship between inputs and outputs of the system and th�y are quite useful when that relationship is non-linear. In this paper, we used multi-layer perceptron (MLP) network to construct a real time VLC channel estimator to obtain
This work is supported by COST-TUBITAK Research Grant No: 113E307.
978-1-5090-0620-5/16/$31.00 ©2016 IEEE
channel taps under different environmental conditions with high accuracy. We constructed a realistic indoor environment in the laboratory and used real materials to investigate effects of the surface types having different reflectance values. In the se.quel, cha�nel taps are estimated by using asymmetrically clipped optical orthogonal frequency division multiplexing (ACO-OFDM) for real life scenarios. The learning phase based on A� has given us a model to estimate the channel taps. Then different groups of materials having different reflectance values have been used to test the validity of that model. Measur�ment results indicate that the model is capable of calculatmg the channel taps with an average accuracy higher than 97.7% in the training. The major contribution of the paper can be stated as follows: the real time channel model in VLC can be constructed using artificial neural networks based on a set of minimal measurements. Results show that, even with limited number of parameters and experiments, convenient channel models for VLC can be obtained.
The rest of the paper is organized as follows: In Section II, we describe the visible light communications channel properties and its challenges. In Section III, we describe the methodology adopted for VLC channel estimation. In Section IY, we present MLP channel estimator and its performance. Fmally, we conclude the paper in Section V.
II. CHALLENGES IN VLC CHANNEL MODELING
Reflection and refraction patterns are already well defined for daily life materials however, dynamic parameters are affectin? the. VL� channel (e.g. moving objects and people, fluctuatiOns m nOIse sources, unknown reflections of mixed type materials etc.) which complicate the derivation of an analytical expression for the channel model. Obtaining proper channel model ensures designing reliable and robust communi cation systems. Yet, in the literature most of the researches are using infra-red (IR) channel models or simple additive white Gaussian noise (AWGN) channel to model VLC environment [3], [4]. In [5], IR sources are defined as monochromatic where white LED's are considered as wide-band sources (380nm-780nm) intrinsically. It could be seen that wavelength dependent VL channel models are required. Previous studies about frequency selective mUlti-path VLC channel modeling are based on numerically computed non-sequential ray-tracing appro�ch. For �igher data rates VLC channel has frequency selective behaViOr [6]. Frequency selectivity basically means t�at chan�el acts as a simple FIR filter described by coeffi cients which are called "channel taps" in the communication literature. Obtaining channel taps brings great control over distortion cancellation in the received signal. These channel
taps are used to model channel impulse response (CIR) which can be expressed as attenuations and time delays as,
N
h(t)
=I: Pio(t - Ti)
(1)i=l
where
Pi
is the power andTi
is the propagation time of the ith ray, 0 is the Dirac delta function and N is the number of rays received in the detector. Based on the obtained CIR, we can further define the fundamental channel characteristics.Channel DC gain
(Ho)
is one of the most important features of the VLC channel. It determines the achievable signal-to noise ratio (SNR) for fixed transmitter power. The delay profile is composed of dominant multiple line of sight (LOS) links and less number of non-line of sight (NLOS) delay taps. The temporal dispersion of a power delay profile can be expressed by the mean excess delay(TO)
and the channel root-mean square (RMS) delay spread(TRMS)'
These parameters are given by [6],i
Trh(t)dt
=O.97lXo
h(t)dt
1000 t
xh(t)dt
TO
=1000 h(t)dt
It(t - To)2h(t)dt
TRMS
=1000 h(t)dt
Ho
=I:
h(t)dt
(2) (3) (4) (5) From (2) it can be seen that 97 percent of the power of the CIR is contained in the [O,Tr] interval. In our experiments, 512kHz bandwidth is selected for data transmission and up to 2 channel taps are enough to model the channel adequately[7].
III. METHODOLOGY
The block diagram of the transmitter and receiver part for ACO-OFDM based IM/DD (intensity modulation/direct detection) system is shown in Fig. l. In IM/DD method, commercial LED's are used as a transmitter by carrying information in the intensity of light where photo diodes are used as a receiver to detect small fluctuations in the light intensity. ACO-OFDM Transmitter LED ACO-OFDM Receiver
Fig. l. ACO OFDM block diagram for VLC channel estimation
In the transmitter part, user generated bit stream is mod ulated and carried by LEDs where VLC channel part con veys various disturbances such as ambient lights, reflections, refractions and obstructions. Lastly, at the receiver, channel coefficients are estimated by using already known signals (pilot symbols). Then, estimated channel coefficients are used in the MLP training to predict the channel taps in different environments without using further knowledge.
A. Selection of Materials
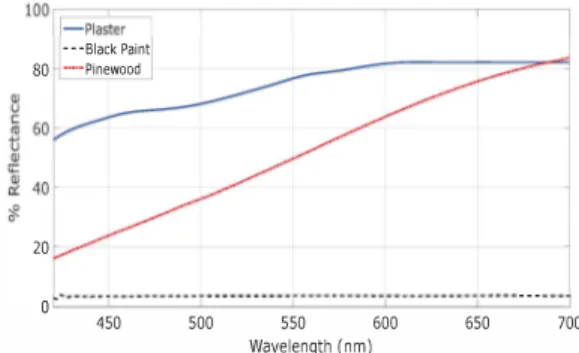
The channel model (taps) heavily depend on the surface types of the environment because receiver captures reflected rays. For this reason the neural neural network model should include surface materials covering a wide range of reflectivity. Materials in the experiments are selected from NASA's spec tral database [8] and realistic indoor configuration is created in the laboratory setup. Materials used in the experiments and their relative reflectances are shown in Fig. 2 and in Table I respectively.
Plaster Pi
Fig. 2. Photographs of materials used in the experiments.
100 F===,-,---,---,---,---, -Plaster ---Black Paint 80 -Pinewood 20 o r�-·---i---·---i---i---I---,---... ---, 450 500 550 600 650 700 Wavelength (nm)
Fig. 3. Relative reflectance values for the materials
From Fig. 3, it can be deduced that the plaster has the highest average reflectance where the pine wood and black flat paint have intermediate and lowest average reflectance values respectively, over the VL band. Average reflectivity over 420nm-700nm band can be calculated from % Reflectance p and normalized spectral power distribution vectors PN as,
1
M
Pavg = P X PN = --
I:
PkPkPTotal
k=l
(6) where Pavg represents the average reflectance values for VL band and total spectral power distribution PTotal can be calculated from the areas under the curves in Fig. 4 as
L;�1
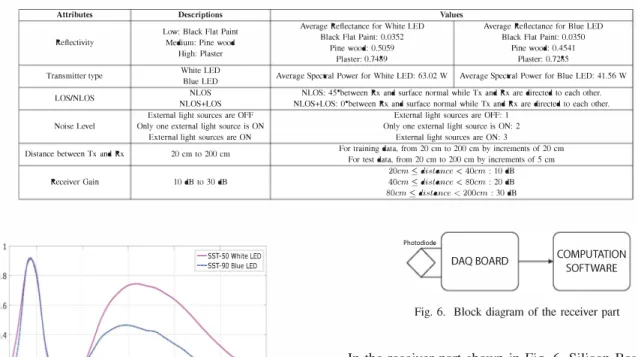
Pz where M and PI are the number of sample points between 420nm and 700nm and discrete spectral power distribution of the LEDs respectively.B. Selection of Light Sources and Detectors
In the experiment, two different types of light sources are used to investigate the effects of wavelengths on reflectivity. For that purpose, single chip, white and blue power LEDs are used. Spectral power distributions of these LEDs are shown in Fig. 4.
TABLE I
INPUT FEATURES USED IN MLP
AUributes Descriptions Values
Refleclivity
Low: Black Flat Paint Medium: Pine wood
High: Plaster
Average Reflectance ror White LED Black Flat Paint: 0.0352
Average Reflectance ror Blue LED Black Flat Paint: 0.0350
Pi ne wood: 0.5059 Pine wood: 0.4541
Plaster: 0.7489 Plaster: 0.7285
Transmitter type White LED
Blue LED Average Spectral Power for White LED: 63.02 W Average Spectral Power for Blue LED: 41.56 W
LOS/NLOS NLOS
NLOS+LOS
NLOS: 45°bctween Rx and surface normal while Tx and Rx are directed to each other. NLOS+LOS: QObetween Rx and surface normal while Tx and Rx are directed to each other. Noise Level
Distance between Tx and Rx
Receiver Gain
450 500 550
External light sources are OFF Only one external light source is ON
External light sources arc ON 20 cm to 200 cm
10 dB 1030 dB
-SST-50 White LED
-SST-gO Blue LED
600 650 700
Wavelength (nm)
Fig. 4. Spectral power distributions of the SST-50 White and SST-90 Blue LEOs
Since these power LEDs are manufactured for illumination purposes only, the bandwidth and linearity of the LEDs must be taken into consideration. Those problems will be detailed in the following part.
C. Measurement Setup and Channel Estimation
System hardware design and the ACO - OFDM transmitter structure are shown in Fig. 5.
COMPUTATION
SOFTWARE DAQBOARD
LED CURRENT
DRIVER
Fig. 5. Block diagram of the transmitter part
LED
Data processes on the OFDM frame are executed in the computer simulation environment. State of the art digital ac quisition board (DAQ) connects digital and real world together by synthesizing the digital samples using sample and hold circuit of 16 bits resolution. DAQ board has IVN transfer function which means that discrete samples of IV magnitude in software can be synthesized as 1 V in the real world. Generated analog signals pass from the laser diode driver with
300mAN transfer function. For typical LEDs, illumination
and current has a linear relationship within the LED's linear region. To make sure that the LEDs are operating in the linear region, the maximum transmitted signal power is limited to 1.25 Watts [9].
External light sources arc OrF: 1 Only one external light source is ON: 2
External light sources are ON: 3
For training data, from 20 cm to 200 cm by increments of 20 cm For test data, from 20 em to 200 em by increments of 5 em
20cm � distance < 40cm : 10 dB
40cm. � distance < 80cm : 20 dB
80cm < disi�ance < 200cm : 30 dB
Photodiode
DAQ BOARD COMPUTATION SOFTWARE
Fig. 6. Block diagram of the receiver part
In the receiver part shown in Fig. 6, Silicon Based Switch able Gain Detector is used to capture very tiny alterations in the light intensity. Synchronization between the transmitter and receiver is ensured by DAQ board's built-in trigger mech anism. According to the system setup defined above, OFDM frame structure is obtained as follows. Random generated source bits are transmitted in the blocks of Tsym duration and modulated in M-QAM modulator where they are pro cessed parallel in further blocks with symbol duration of
Ts = Tsym/N. The total number of actively used sub-carriers
are represented as N and for simplicity N is taken to be equal to the IFFT block size. Input s
�
nal in the frequency domain X =[XO,X1,X2,'" ,XN-1]
meets the Hermitiansymmetry and only the odd indexed sub-carriers contain data where the oth (DC) and (N/2)th sub-carriers are set to zero to avoid any complex term and fulfill the Hermitian symmetry [2], [3].
X [k]
={
�*
N-k
k
is evenk
is odd (7)where * denotes the complex conjugate. Lowercase letters are used for time-domain signal representations and uppercase letters are for discrete frequency-domain signals. The resulting real, bipolar and anti-symmetric time-domain IFFT signal is given by,
x
=[XO,Xl,'" ,XN-l]Y .
N-l
x [n]
= _1_L
X [k] ej
2i!lnffi
k=O
(8)where N is the number of points in IFFT and
X [k]
is the kthsub-carrier of signal X which contains already known pilot symbols for channel estimation procedure. Due to Hermitian symmetry and zero insertion process, the number of data symbols carried by sub-carriers in ACO-OFDM is only N /4.
A cyclic prefix (CP) is then added to the discrete time samples, where Ncp is denoted by the length of the CPo In our experiment, Ncp is taken as greater or equal to Lh where Lh
is the length of the impulse response of the optical channel. Negative part of the signal is clipped to generate real and unipolar signal is given by,
lx [nlJc
={
�
[n]
if
x [n]
�0
if
x [n]
<O.
(9)The clipping noise will fall only on the even sub-carriers and will not affect the transmitted symbols carried by odd sub carriers. There is no need to add a DC bias to the clipped signal in the conventional ACO-OFDM system.
Parameter N K Ps Lcp Ctype Vtrigger Vbias HTX HRX TABLE II PARAMETERS OF EXPERIMENT Description
OFDM frame length Active sub-carrier number
Pilot Separation Cyclic Prefix length
Constellation type Triggering voltage at the receiver
Bias level at the transmitter Transmitter height from material
Receiver height from material
Value 512 504 2 4 4-QAM 0.075V 150mA 19cm 19cm
At the receiver, photo-diode detects and converts the op tical signals into electrical signals. Received signal contains amplified/attenuated components as well as inter-symbol in terference (lSI) and additive white Gaussian noise (AWGN). Received time-domain signal has the form of,
y(t)
=x(t) ® h(t) + w(t)
(10)where ® denotes the circular convolution operation,
h(t)
=[h(O)h(l) ... h(Lh - l)V
is the L-path impulse response ofthe optical channel and
w(t) is an AWGN that represents the
noise in the environment. Ambient noise is in the form of DC and AWGN is added in the electrical domain and overall noise power is denoted by (J"n.
Fig. 7. Comb type pilot symbol arrangement for ACO-OFDM
After detection, AID device converts the analog signal
into the digital domain. After removing the CP, the Fast
Fourier Transform (FFT) of the received signal
y
is taken inthe computation software. Channel is estimated in frequency domain by single tap zero forcing equalizer (ZFE) as,
TABLE III
MSE PERFORMANCE IN TRAINING PHASE
Test Test
Channel Tap I Phases Training (Black Flat Paint - Pine wood) (Plaster - Pine wood)
hI 1.8 e·06 3.2 e·04 8.0 e·05
h2 6.0 e·07 1.5 e·05 3.0 e·06
where Hestimated shows N
x 1 estimated channel taps vector
in the frequency domain, X is the N
x
N diagonal pilotsymbols matrix and W is N
xl
AWGN vector in the frequencydomain. Due to fact that only odd sub-carriers are modulated and even sub-carriers left as zero this is comb-type channel
estimation for ACO-OFDM as shown in Fig. 7. Thus, cubic
interpolation is applied to Hestimated before taking IFFT and
the time domain representation of the channel taps are obtained [10]. The parameters of the communication system used in the experimental setup are given in Table II.
D. Multi-Layer Perceptron Structure
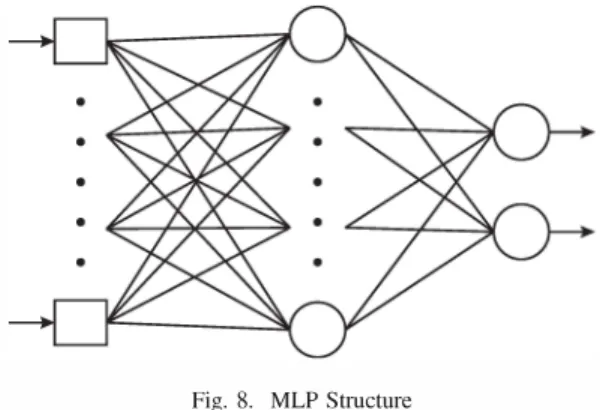
Designed structure of the MLP is shown in Fig. 8 which contains one hidden layer [11].
Fig. 8. MLP Structure
As explained in Section II, only two channel taps are enough to model the effects in optical wireless channel. Thus, the MLP structure will have two outputs. Although there are many parameters that affect the channel directly, in this experiment six major attributes are chosen as MLP inputs which are given in Table I in detail.
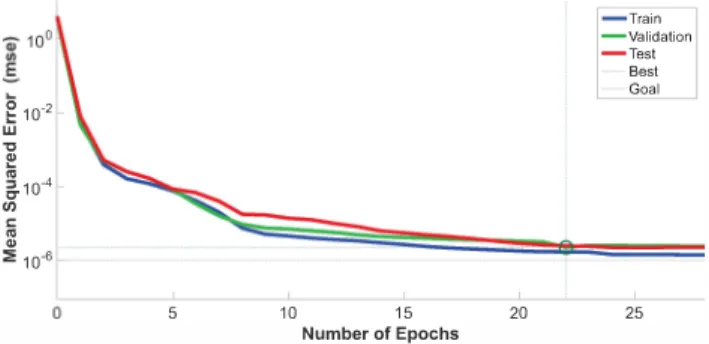
The training performance of the MLP is given in Table III in terms of MSE (mean squared error) in the column "training" . Another measure of performance is displayed in Table IV in the "training" column. The channel taps can be estimated with a mean percentage absolute error of less than 2.3%. The behavior of MSE in training epochs is displayed in Fig. 9 .
For testing the trained MLP system, we have expanded the general model which depends on the following parameters: reflectivity, transmitter type, NLOS/LOS and noise levels. Two different cases are created for reflectivity values where the surface is covered with half black flat paint and half pine wood as the first case and for the second case, the surface is covered with half plaster and half pine-wood. According to white and blue LEDs, new hybrid reflectance values are
given in Table V. Parameters related to the MLP structure and
training are given in the next section.
IV. MEASUREMENTS AND RESULTS
-1 W
Hestimated = X Y = H +
X
Measurements are performed for 10 distance values in the
(11) interval of
[20cm : 200cm]
by increments of 20cm betweenTABLE IV
MEAN % ABSOLUTE ERROR
Channel Tap I Phases Training (Black Flat Paint Test Test
• Pine wood) (Plaster· Pine wood)
hI 2.3 13.3 13.0
h2 1.2 4.4 2.7
the receiver and the transmitter units. Three different materials are used: plaster, pine-wood and black flat paint for high, medium, low reflectance values respectively. In the transmitter, white and blue color LEDs are used. NLOS and LOS effects are realized by 0 and 45 degrees of angle between material surface and photo-diode normal. Three different disturbance levels are created by external light sources in the environ ment. According to the distances between the transmitter and the receiver, power control procedure is applied at the receiver to prevent saturation. Thus, receiver gain is chosen
for
20cm :::; distance
<40cm
interval as 10 dB, for40cm :::; distance
<80cm
interval as 20 dB and for80cm :::; distance
<200cm
interval as 30 dB. In orderto increase validity of the measurements, mean of the 10 consecutive measurements are used as estimated channel taps.
In total,
3
x2
x2
x3
x10
=360
measurements are usedto estimate 2 channel taps according to the method given in the Section II-e. These measurements are used for training of the MLP where tangent sigmoid function is used as the nonlinearity in the hidden layer and linear activation function is used in the output layer. To find the optimum performance for the training, different number of hidden layer neurons are tested. As seen in Fig.l0, the best validation error in the training phase is achieved for 10 neurons in the hidden layer. Hence, NN model for estimating two channel taps for VLC has been obtained.
� e 10-2 w ." � �10-4 en c: '" .. :;: 10"" 5 10 15 Number of Epochs 20
Fig. 9. MSE perfonnance of training phase
Train -Validation -Test Best Goal 25
Using two hybrid surfaces and considering other parameters, 8 measurements are carried out randomly at distances between
20cm
and200cm.
Again, each measurement is repeated10 times. The aim of these measurements is to verify the prediction capability of the trained neural network. Test results are given for the constructed hybrid surfaces in Table III and Table IV. Table III displays MSE performance for the two test cases. As can be seen, the MSE performance is one to two orders of magnitude worse than training. However, as can be seen in Table IV, the mean percent absolute errors for the test cases are still acceptable. Especially, for h2 (transmission with reflections) the mean percentage absolute error is below 5% for test cases. For a detailed analysis of the percentage absolute error, Figs. 11-12 are given. Here the histograms of
TABLE V
AVERAGE REFLECTANCES OF HYBRID MATERIALS
Materials / LED White Blue
Plaster - Pine Wood 0.2705 0.6274
Black Flat Paint - Pine Wood 0.2445 0.59l3
percentage absolute errors are given for the training and for one of the test data.
1 X 10⁻⁴
0.2
j
... ,Training Test Errorl
- -Validation Error ---Training Error
Number of Neurons in the Hidden Layer
Fig. 10. System performance for different number of hidden neurons
80 >-g 60 Q) " 0-� 40 LL 20 2 4 6 8 10 12 14 16 % Error
Fig. 11. Percentage absolute error distribution for h I in training data
20
10 20 30 40 50 60
% Error
Fig. 12. Percentage absolute error distribution for hI in plaster&pine-wood data
V. CONCLUSION
In this work, we created an experimental setup to estimate VLC channel taps by using neural networks. Based on the knowledge of transmission bandwidth, 2 channel taps are enough to model VLC channel. Six input features (reflectivity of different materials, transmitter types, LOSI NLOS, noise levels, receiver gain and distance between the transmitter and
receiver) are used to predict the two channel taps. Experimen tal data are used to train the MLP network. The results showed that the system can learn the channel taps with 2.3% mean absolute error in the measurement data set. The channel taps for different hybrid materials in the test phase are predicted with approximately 14% mean absolute error for tap 1 and 4.3% for tap 2. Those results indicate that such a procedure may be used effectively to predict channel parameters for VLC. As an alternative to expensive and time consuming simulation softwares, these methods can be used effectively for channel estimation in the VLC. For the future work, different types of surfaces and higher order NLOS channel taps for higher bandwidths will be investigated. P erformance of the system in terms of training, validation and test data shows that VLC channel estimation by using neural networks is a promising field for future research.
REFERENCES
[l] H. Haas, "High-speed wireless networking using visible light," SPlE Newsroom, April 2013.
[2] J. Armstrong, "OFDM for optical communications," Lightwave Teelmol ogy, Journal of, vol. 27, no. 3, pp. 189-204, Feb. 2009.
[3] S. Dissanayake and J. Armstrong, "Comparison of ACO-OFDM, DCO OFDM and ADO-OFDM in IMJDD systems," Lightwave Technology, Journal of, vol. 31, no. 7, pp. 1063-1072, April 2013.
[4] B. Ranjha and M. Kavehrad, "Hybrid asymmetrically clipped OFDM based IMJDD optical wireless system," Optical Communications and Networking, IEEEIOSA Journal of, vol. 6, no. 4, pp. 387-396, Apr. 2014.
[5] K. Lee, H. Park, and 1. Barry, "Indoor channel characteristics for visible light communications," Communications Letters, IEEE, vol. 15, no. 2, pp. 217-219, February 2011.
[6] F. Miramirkhani and M. Uysal, "Channel modeling and characterization for visible light communications," Photonics Journal, IEEE, vol. 7, no. 6, pp. 1-16, Dec 2015.
[7] H. Elgala, R. Mesleh, and H. Haas, "Practical considerations for indoor wireless optical system implementation using OFDM," in Telecommu nications, 2009. Con T EL 2009. iOth international Coriference on, June 2009, pp. 25-29.
[8] "Aster spectral library - version 2.0, [online]." hup:llspeclib.jpl.nasa.gov, accessed: 01-02-2016.
[9] S. Dimitrov, S. Sinanovic, and H. Haas, "Double-sided signal clipping in ACO-OFDM wireless communication systems," in Communications (iCC), 2011 IEEE international Coriference on, June 2011, pp. 1-5. [10] J.-J. van de Beek, P. Borjesson, M.-L. Boucheret, D. Landstrom,
J. Arenas, P. Odling, C. Ostberg, M. Wahlqvist, and S. Wilson, "A time and frequency synchronization scheme for multiuser OFDM," Selected Areas in Communications, IEEE Journal on, vol. 17, no. 11, pp. 1900-1914, Nov 1999.
[11] R. Lippmann, "An introduction to computing with neural nets," ASSP Magazine, IEEE, vol. 4, no. 2, pp. 4-22, Apr 1987.