Emerging Markets Finance & Trade / September–October 2009, Vol. 45, No. 5, pp. 4–18. Copyright © 2009 M.E. Sharpe, Inc. All rights reserved.
1540-496X/2009 $9.50 + 0.00. DOI 10.2753/REE1540-496X450501
Productivity and Growth in an Unstable Emerging
Market Economy: The Case of Turkey, 1960–2004
Mustafa Ismihan and Kivilcim Metin-Ozcan
AbsTrAcT: This paper explores sources of growth in the Turkish economy by performing
growth accounting exercises over the 1960–2004 period and relevant subperiods. It also analyzes the role of a number of important policy-related factors, such as infrastructure investment, macroeconomic instability, and imports, on total factor productivity (TFP) by performing cointegration and impulse response analyses. The results suggest that both TFP and capital accumulation were crucial sources of growth during the sample period. Nevertheless, TFP growth displayed enormous variation from 1960 to 2004. The descrip-tive and empirical evidence suggests that TFP is posidescrip-tively affected by imports and public infrastructure investment and negatively affected by macroeconomic instability.
KEy words: capital accumulation, cointegration, economic growth, growth accounting,
impulse response analysis, macroeconomic instability, total factor productivity.
The Turkish economy registered a low and volatile economic growth rate from the
mid-1970s to 2001, mainly due to an endemic problem of macroeconomic instability.1
Fortunately, things seem to have changed quite significantly after 2001. From 2002 to 2005, Turkey simultaneously experienced an unprecedented economic growth rate and
a significant reduction in the inflation rate.2 Along with other factors,3 sound
macroeco-nomic policies have been crucial to Turkey’s favorable macroecomacroeco-nomic performance over the 2002–5 period.
We aim to empirically assess the role of stability of the macroeconomic environment on economic growth, particularly on total factor productivity (TFP) growth. To accom-plish this, it is essential to identify the contribution of capital accumulation and TFP to economic growth. Thus, we first analyze the sources of growth in the Turkish economy over the 1960–2004 period, as well as over the relevant subperiods (pre-1980 versus post-1980), by performing growth accounting exercises.
Mainly motivated by the recent transformation of Turkey’s macroeconomic environ-ment from unstable to stable, we also analyze the role of several important policy-related factors on TFP. To achieve this, we develop a simple cointegration model with four vari-ables: a macroeconomic instability index, the imports-to-gross national product (GNP) ratio, the public infrastructure investment-to-GNP ratio, and TFP. We are particularly interested in analyzing the dynamic effects of macroeconomic instability, public infra-Mustafa Ismihan ([email protected]) is an associate professor at Atilim University, Ankara. Kivilcim Metin-Ozcan ([email protected]) is an associate professor at Bilkent University, Ankara. The authors are grateful for useful comments from participants at the Twelfth ERF Annual Conference (December 2005, Cairo), ICE-TEA conference (September 2006, Ankara), and the seminar at the Bilkent University (December 2005). They also thank Fatma M. Ismihan and Nergiz Dincer for helpful comments and discussions on this paper; Kirsten Ward, who kindly read the paper and suggested improvements; and two anonymous referees, for valuable comments. Finally, the authors thank the Scientific & Technological Research Council of Turkey for research support (SOBAG-104K151). The usual disclaimers apply.
structure investment, and openness on TFP. To this end, we use a generalized impulse response (GIR) analysis.
Overview of the Turkish Economy, 1960–2004
This section provides a general overview of the macroeconomic history of Turkey from 1960 to 2004. We focus mainly on growth performance, capital formation, macroeconomic
instability, and policy changes.4 Table 1 provides summary information on the Turkish
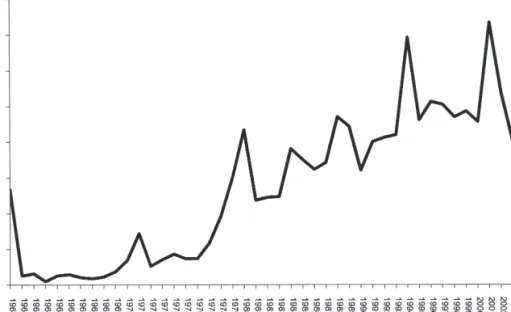
economy for the decades as well as for the overall period and the relevant subperiods. In the pre-1980 period, Turkey followed a state-led inward-oriented growth strategy that involved import substitution policies and economywide planning by the State Plan-ning Organization (SPO). Along with trade restrictions and financial repression policies, the state made use of heavy public investment, especially in the manufacturing sector, to promote industrialization and economic development. From 1960 to 1980, Turkey enjoyed a high rate of growth: Real gross domestic product (GDP) grew at an annual average rate of 4.7 percent; there was a rapid rate of capital accumulation, as real capital stock grew at an annual average rate of 7 percent, and a relatively high rate of employment growth. However, Turkey’s growth performance was even more impressive during the 1960s, as real GDP grew at an average annual rate of 5.4 percent. Despite this performance, Turkey only attained a modest rate of capital accumulation—real capital stock grew at an annual average rate of 5.9 percent—but the macroeconomic environment was quite stable during the 1960s (see Table 1). Figure 1 shows a time plot of the macroeconomic
instability index (MII).5
The 1970s saw the deepening of industrialization based on Turkey’s import substitu-tion strategy. The decade was also characterized by the implementasubstitu-tion of a strong public investment program. Compared to the 1960s, the 1970s growth rate of real capital stock (K), public and private investment as a percentage of GNP (Igrat and Iprat), and public infrastructure investment as a percentage of GNP (Igirat) increased from 5.9 to 8.0, 5.7 to 9, 10.2 to 14.2, and 2.2 to 3.5, respectively (see Table 1). During this period, real GDP grew at an average annual rate of 4.1 percent.
However, from 1973 to 1977, a polarized political environment led to inadequate macroeconomic policy-making. This, in turn, contributed to a rise in macroeconomic instability. As a consequence, both inflation and the macroeconomic instability index dramatically increased from 5.4 percent and 0.049 points in the 1960s to 27 percent and 0.118 points in the 1970s, respectively (see Table 1 and Figure 1). Eventually, the import substitution strategy reached its limits and Turkey experienced a severe economic crisis in 1978–9. The political and macroeconomic instability ended with the January 1980 economic package and a military regime from 1980 to 1983.
The main characteristics of the early and mid-1980s were strong subsidies to promote exports and the gradual phasing in of import liberalization; these were paired with a managed floating exchange rate and regulation of capital movements. This structural change is reflected both in the exports-to-GNP and imports-to-GNP ratios, which in-creased from 3.5 percent and 7.8 percent in the 1970s to 9.9 percent and 15.0 percent in the 1980s, respectively (see Table 1). The economic role of the state also changed dramatically with the January 1980 economic program; for example, the state changed its investment strategy from manufacturing to infrastructure. As Table 1 shows, public infrastructure investment as a percentage of GNP increased from 3.5 percent in the 1970s to 4.6 percent in the 1980s.
Table 1. T
urkish economy
, 1960–2004: Growth, capital accumulation, employment, stability
, and openness Overall Pre-1980 Post-1980 Decades period period period 1960– 1960– 1980– Indicators 1960s 1970s 1980s 1990s 2000s 2004 1980 2004
Annual average growth rates (percent) Real GDP (
y) 5.4 4.1 5.2 3.6 3.6 4.5 4.7 4.3 Capital ( K ) 5.9 8.0 4.3 5.2 1.8 5.5 7.0 4.2 Employment ( L) 1.4 1.8 1.2 1.0 0.2 1.3 1.6 0.9
Period average Macroeconomic instability index (MII)
0.049 0.118 0.347 0.468 0.479 0.271 0.100 0.422
Inflation rate (Infl)
5.4 27.0 50.4 73.2 36.5 38.7 19.7 56.8
Public investment/GNP (Igrat)
5.7 9.0 9.1 6.2 6.0 7.3 7.5 7.3
Private investment/GNP (Iprat)
10.2 14.2 11.3 17.6 13.2 13.3 12.2 14.2
Public infrastructure investment/GNP (Igirat)
2.2 3.5 4.6 3.2 2.8 3.3 2.9 3.7 Exports/GNP (Exrat) 4.6 3.5 9.9 11.6 19.2 8.7 4.1 12.4 Imports/GNP (Imrat) 6.8 7.8 15.0 19.2 29.1 14.1 7.5 19.5 Sour ce: See Appendix.
The annual average growth rate of real GDP increased from 4.1 percent in the 1970s to 5.2 percent in the 1980s. It seems that the export-led growth strategy of the 1980s was quite successful, though the impressive export boom was essentially based on the productive capacities established during the preceding decade.
In the early 1980s, Turkey successfully reduced macroeconomic instability (see Table 1 and Figure 1), albeit under special conditions (see Celasun and Rodrik 1989). However, starting from the late 1980s, political and macroeconomic instability increased (see Figure 1) and persisted as endemic characteristics of the Turkish economy during the 1990s. Populist and myopic policies as well as the associated problems of public-sector imbalances were blamed most for the persistence of high macroeconomic instability from the late 1980s onward (Ismihan 2003). The governments—usually coalitions—in Turkey were able to maintain these unsound policies through reliance on domestic borrowing, with the help of capital inflows. However, this strategy was very costly, resulting in high
interest rates and associated unsustainable debt dynamics during the late 1990s.6
In December 1999, Turkey, under a three-party coalition, signed a three-year, Inter-national Monetary Fund (IMF)–based standby agreement mainly aimed at correcting its public-sector imbalances. This program failed in February 2001 and real GDP contracted by 7.5 percent in 2001. The coalition government signed another program backed by the IMF and the World Bank after the crisis. From 2002 onward, this program has been implemented by Party of Justice and Development (AKP) governments.
Fortunately, macroeconomic instability fell dramatically between 2002 and 2004 (see Figure 1) and Turkey experienced an unprecedented economic growth rate; real GDP grew very rapidly, at an annual average of 7.5 percent, during the 2002–5 period. Decisive change in macroeconomic policy, especially fiscal policy, from populist to sound policies has been crucial in this improvement. The central bank also successfully reduced the inflation rate (CPI) from 68.5 percent in 2001 to 7.7 percent in 2005. However, disap-pointingly, the high growth rate has failed to generate sufficient employment to overcome Turkey’s unemployment problem (see Table 1).
Sources of Growth in the Turkish Economy, 1960–2004
Equation (1) provides the basic framework for our growth accounting exercises,7
gy = αgk + (1 – α)gh + ga , (1)
where gy is growth in output per worker, y is Y/L, α is the share of capital in output, gk is
growth in capital per worker, k is K/L, ga is TFP growth, and gh is growth in educational
attainment per worker, h. The equation allows us to determine the importance of the three sources in the growth of output per worker, also called the labor productivity growth rate. The three terms on the right-hand side represent the three ingredients of growth in
output per worker (gy):
1. [αgk] = contribution of growth in capital per worker
2. [(1 – α)gh] = contribution of improvement in education per worker
3. [ga = gy – αgk – (1 – α)gh] = contribution of growth in TFP8
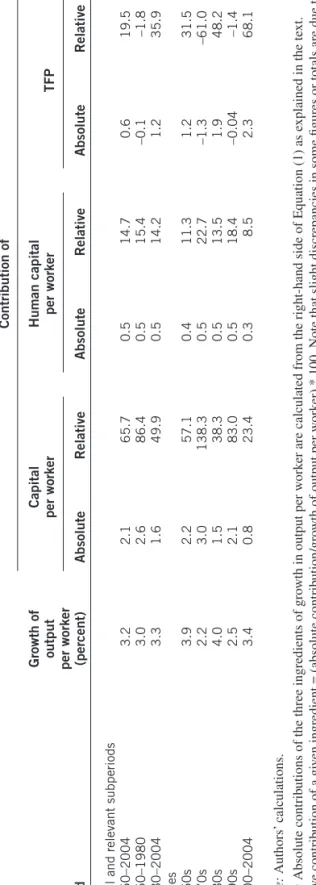
Table 2 summarizes the results of the growth accounting exercises (α = 0.50)9 for the
individual decades, the overall period, and the relevant subperiods. Figure 2 presents the evolution of TFP from 1960 to 2004 to aid in interpreting the results.
Between 1960 and 2004, physical capital accumulation seems to have been the main source of growth (66 percent) in output per worker. TFP contributed about 20 percent and human capital accumulation contributed even less, about 15 percent. To obtain detailed information about the sources of growth in the Turkish economy, below, we analyze the results from the growth accounting exercises for the decades in the relevant subperiods (pre-1980 and post-1980).
Inward-Oriented Period, 1960–1979
During the 1960s, GDP per worker grew at an impressive rate of 3.9 percent.10 The most
important contributor to this performance was capital accumulation—an increase in capital per worker—which accounted for 57 percent of growth in output per worker. This accords with the crucial role of the state in capital formation through economywide plan-ning during the inward-oriented period (see above). TFP growth was another important ingredient of growth during the 1960s, accounting for almost one-third of growth. This was mainly due to the relatively stable macroeconomic and political environment (see Table 1 and Figure 1). Finally, the contribution of human capital, at 11 percent, was very weak compared to the other two contributors.
The growth rate of GDP per worker slowed significantly during the 1970s, from 3.9 percent in the 1960s to 2.2 percent in the 1970s. The principal reason for this fall-off was the decline in TFP growth, which fell from 1.2 percent in the 1960s to –1.3 percent in the 1970s (see Table 2). There were three main reasons for this decline: the double oil shocks in the 1970s; the polarized and unstable sociopolitical environment, especially during the late 1970s; and inadequate macroeconomic management, such as excessive reliance on foreign borrowing and delayed stabilizations. All these led to a rise in
mac-roeconomic instability11 and severe economic crisis in 1978–9 (see above). TFP started
to fall steadily after 1976 (see Figure 2), marking the beginning of the acceleration of political and macroeconomic instability (see Figure 1).
Unfortunately, the decline in TFP growth undermined the contribution of the 1973–77 public sector–led investment boom. The negative contribution of TFP growth (–61 percent)
Table 2. Sources of growth in T urkish economy , 1960–2004 ( α = 0.50) Contribution of Growth of Capital Human capital output per worker per worker TFP per worker Period (percent) Absolute Relative Absolute Relative Absolute Relative
Overall and relevant subperiods 1960–2004
3.2 2.1 65.7 0.5 14.7 0.6 19.5 1960–1980 3.0 2.6 86.4 0.5 15.4 –0.1 –1.8 1980–2004 3.3 1.6 49.9 0.5 14.2 1.2 35.9 Decades 1960s 3.9 2.2 57.1 0.4 11.3 1.2 31.5 1970s 2.2 3.0 138.3 0.5 22.7 –1.3 –61.0 1980s 4.0 1.5 38.3 0.5 13.5 1.9 48.2 1990s 2.5 2.1 83.0 0.5 18.4 –0.04 –1.4 2000–2004 3.4 0.8 23.4 0.3 8.5 2.3 68.1 Sour ce: Authors’ calculations. Notes: Absolute contrib
utions of the three ingredients of gro
wth in output per w
ork
er are calculated from the right-hand side of Equation (1) as e
xplained in the te
xt.
Relati
ve contrib
ution of a gi
ven ingredient = (absolute contrib
ution/gro
wth of output per w
ork
er) * 100. Note that slight discrepancies in some figures or totals are due to
was offset by the sizable contribution of an increase in capital per worker (138 percent). During the 1970s, human capital formation was also an important source of growth in output per worker, which accounts for about 23 percent of growth.
Outward-Oriented Period, 1980–2004
After a slowdown in the 1970s, the growth rate of GDP per worker started to rise in the 1980s at an annual average of 4 percent, which exceeded the 1960s level of 3.9 percent. The main contributor to this performance was an improvement in TFP growth, which accounted for 48 percent of growth in output per worker.
The improvement in TFP growth was related to the following developments. In 1980, Turkey made a drastic decision to shift its overall economic strategy from inward-oriented to outward-oriented growth. The state also changed its investment strategy from manufac-turing to infrastructure. In line with these structural changes, the imports-to-GNP ratio, as well as the exports-to-GNP ratio, started to pick up over the 1980s (see Table 1). This, in turn, helped to increase the TFP by increasing competition and the diffusion of know-how
from abroad.12 Public infrastructure investment also seemed to help to increase the TFP
(see above).13 The high degree of political instability ended in 1980 and macroeconomic
management was also quite good during the 1980s14 compared to the poor performance
of the 1970s (see Figure 1).
Compared to the 1970s, in the 1980s capital accumulation slowed (see Table 1). This is in line with the view that the export-led growth of the 1980s was based on the produc-tive capacities established during the 1970s. However, an increase in capital per worker remained an important ingredient during the 1980s, accounting for about 38 percent of growth. Compared to the preceding decade, the relative contribution of human capital formation fell and accounted for only about 14 percent of growth.
The growth rate of GDP per worker slowed substantially during the 1990s as it did in the 1970s, from 4 percent (1980s) to 2.5 percent (1990s). TFP is mainly responsible Figure 2. Time plot of TFP, α = 0.50 (1960 = 100)
for this slowdown; its annual growth rate fell from 1.9 percent (1980s) to –0.04 percent (1990s). Three possible reasons for this slowdown were political instability and related populist and myopic policies (see Ismihan et al. 2005 and the references therein); the as-sociated chronic and high level of macroeconomic instability, mainly due to the problems of public-sector imbalances; and the fall in infrastructure spending as a consequence of
fiscal and political constraints (Ismihan et al. 2005).15 As a result of these changes, TFP
made a negative contribution of about –1.4 percent to the growth in output per worker. On the other hand, an improvement in capital per worker contributed substantially to growth performance in this decade. This increase accounted for 83 percent of growth in output per worker. However, human capital formation contributed only about 18 percent.
In the early 2000s, the growth rate of GDP per worker increased substantially, at an annual average rate of 3.4 percent. The principal contributor to this performance was an unprecedented rise in TFP growth, from –0.04 percent (1990s) to 2.3 percent (2000s). As a result, TFP accounted for more than two-thirds (68 percent) of growth in output per worker during the 2000s. Four factors could have been responsible for the speed-up in TFP: successful reduction of the inflation rate, fiscal discipline, and the resultant stable macroeconomic environment; institutional reforms to the central bank and public-sector spending and structural reforms to the financial sector; the relatively stable political and external environment; and the prospect of possible EU membership. Nevertheless, because Turkey experienced severe economic crises in 2000–2001, these factors—especially the first, third, and fourth—are more relevant for the 2002–2004 period. This is evident from the steep rise in TFP from 2001 to 2004 in Figure 2.
Compared to the previous decades, the 23 percent contribution of physical capital accumulation was very weak in the early 2000s. Similarly, human capital formation contributed only about 9 percent.
Explaining the Evolution of TFP Within a Simple Empirical Model
Many economists believe that sound economic policies can be vital to the growth perfor-mance of developing countries by affecting productivity growth and capital formation. Considerable evidence supports this view (see, e.g., Burnside and Dollar 2000; Easterly and Rebelo 1993; Fischer 1993a, 1993b), A number of factors have received extensive attention as crucial determinants of TFP and growth: the stability of the macroeconomic policy environment, proxied by policy-induced macroeconomic instability variables, such as the inflation rate, budget deficit, foreign debt, and exchange rate variability; outward orientation or openness to foreign competition; diffusion of technology; and productive spending, especially on public infrastructure (see, e.g., Burnside and Dollar 2000; Easterly and Rebelo 1993; Fischer 1993a, 1993b; Grossman and Helpman 1991; Ismihan et al. 2005; Sturm et al. 1998; Togan 2003).
To shed light on the evolution of TFP in the Turkish economy, we investigate the role of the above-mentioned policy-related factors on TFP. We look at the empirical
relation-ships among macroeconomic instability (MII), the imports-to-GNP ratio (Imrat),16 the
public infrastructure investment-to-GNP ratio (Igirat), and TFP (TFP050)17 in Turkey
from 1960 to 2004. We are particularly interested in the dynamic effects of an increase in MII, Imrat, and Igirat on TFP050. In line with these aims, we form a cointegration system
with these four variables.18 We use the Johansen multivariate cointegration technique in
cointegration analysis with a constant term entering restrictively, but with no trend term in the cointegration space (see Hendry and Juselius 2001).
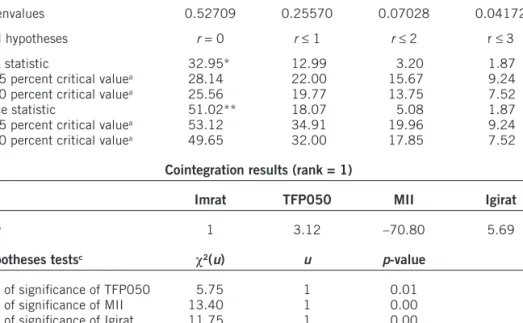
Table 3 presents the cointegration result for a VAR(1).20 The trace and max statistics
suggest one cointegration relation.21 We expected to a find a long-run TFP relation but
there is none that is meaningful in the cointegration results reported in Table 3.22
How-ever, as our principal empirical interest is to analyze the dynamic effects of an increase
in MII, Imrat, and Igirat on TFP050, below we provide the GIR functions23 to examine
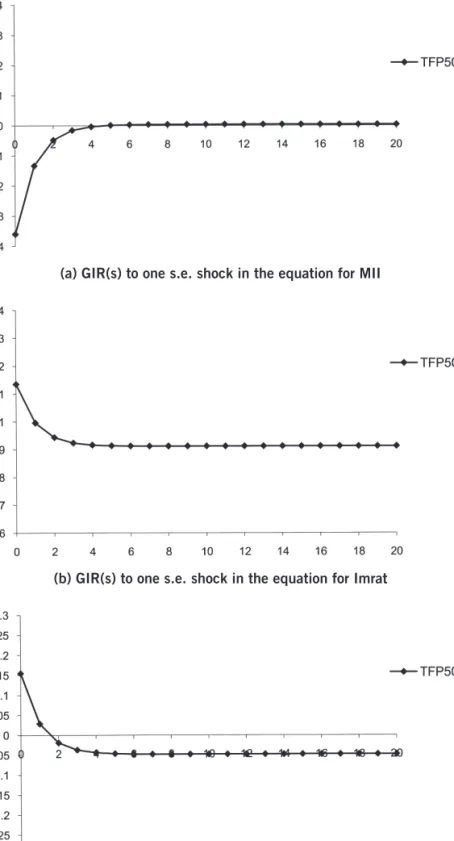
the dynamic effects. That is, we analyze the short- and medium-run effects of a shock on a given variable (e.g., Imrat) on the TFP variable (TFP050). Figure 3 presents the GIR functions to a positive unit—one standard error (s.e.)—shock in MII, Imrat, and Igirat equations in panels (a), (b), and (c), respectively.
To analyze the dynamic effects of an increase in macroeconomic instability (MII) on TFP, we examine the GIRs in Panel (a) of Figure 3. As expected, short- and medium-run responses of TFP to a rise in MII are negative. This result is in line with the analyses
aboveand is consistent with the theoretical and empirical results (see Ismihan 2003 for
more detail). However, the negative responses of TFP diminish over the medium term and approach zero.
We next turn to the dynamic effects of an increase in the imports-to-GNP ratio on TFP. As Panel (b) of Figure 3 shows, TFP is positively and permanently affected by an increase in the imports-to-GNP ratio. This result is consistent with the argument that an increase in the imports-to-GNP ratio may help to increase the TFP by increasing the competitive
Table 3. Cointegration analysis
Tests of cointegration rank (r)
Eigenvalues 0.52709 0.25570 0.07028 0.04172
Null hypotheses r = 0 r ≤ 1 r ≤ 2 r ≤ 3
Max statistic 32.95* 12.99 3.20 1.87
95 percent critical valuea 28.14 22.00 15.67 9.24
90 percent critical valuea 25.56 19.77 13.75 7.52
Trace statistic 51.02** 18.07 5.08 1.87
95 percent critical valuea 53.12 34.91 19.96 9.24
90 percent critical valuea 49.65 32.00 17.85 7.52
Cointegration results (rank = 1)
Imrat TFP050 MII Igirat
(b′)b 1 3.12 –70.80 5.69
Hypotheses testsc c2(u) u p-value
Test of significance of TFP050 5.75 1 0.01
Test of significance of MII 13.40 1 0.00
Test of significance of Igirat 11.75 1 0.00
Notes:a Critical values are from Osterwald-Lenum (1992, p. 468, table 1). b Standardized eigenvec-tor. c Test of long-run exclusion (see Hendry and Juselius 2001). * Represents the rejection of the null hypothesis at the 5 percent significance level. ** Indicates the rejection of the null hypothesis at the 10 percent significance level.
Figure 3. Generalized impulse responses
(a) GIR(s) to one s.e. shock in the equation for MII
(b) GIR(s) to one s.e. shock in the equation for Imrat
pressures in the domestic economy through foreign competition (as noted above). This result is also in line with the argument of Grossman and Helpman (1991) that countries can acquire know-how from abroad, via imports, helping to increase TFP.
Last, we examine the dynamic effects of a rise in total public infrastructure investment-to-GNP ratio (Igirat) on TFP. The short-run responses of TFP to a rise in Igirat are positive as expected (see Figure 3, Panel (c)). This result is also in line with the obser-vations above. However, the positive responses of TFP diminish over the medium term and stabilize at negative (but relatively small) values. One possible explanation for this fall-off is that the financing of public investment spending may create fiscal and related problems, causing a rise in the level of macroeconomic instability over some period of time and, thus, decreasing TFP.
The empirical analysis is also extended by considering the components of public in-frastructure investment—namely, energy and transportation and communication (T&C). In other words, we redo the above cointegration and impulse response analyses for two alternative versions by substituting public energy and T&C investment as a share of GNP for total public infrastructure investment (Igirat). Although public T&C invest-ment is found to affect TFP significantly, public energy is found not to affect TFP over
the medium term, as in the case for total public infrastructure investment.24 The former
result is in line with our expectations, but the latter is not. As in the case of total public infrastructure investment, this might be due to the negative effect of financing of public energy projects on macroeconomic stability and, hence, on TFP. Another possible expla-nation for this result is the significant reduction of the public-sector share in total energy investments during the 1990s, mainly due to the privatization of public enterprises and fiscal restraints on the government. That said, the public investment data may not be a good indicator of the availability of infrastructure of any kind.
Our main results in this section also hold when we substitute other TFP measures— TFP035 and TFP065 (see Appendix)—for TFP050.
Conclusion and Policy Implications
The results of the growth accounting exercises suggest that both TFP and capital accu-mulation were crucial sources of growth during the sample period. However, TFP growth displayed enormous variation over the 1960–2004 period, mainly due to severe structural changes and significant instabilities in macroeconomic and political environment.
In line with the results from the descriptive analysis, empirical evidence suggests that TFP seems to be positively affected by imports and public infrastructure investment and negatively affected by macroeconomic instability for the period under study.
Our results have three policy implications. First, our findings confirm the notion that a stable macroeconomic environment is a precondition for sustainable growth. Thus, current and future governments in Turkey must implement sound economic policies to avoid the adverse effects of macroeconomic instability on TFP, capital accumulation, and, hence, growth. Second, policymakers should be more sensitive in their decisions regarding the composition of overall public spending. They should not cut spending on growth-enhancing items, such as education, research and development, and infrastructure investment, while preserving macroeconomic stability. Our results are also in line with the widely accepted view that the foreign trade can help to increase TFP and, hence, eco-nomic growth. Therefore, the third policy implication of this study is that policymakers should promote outward-oriented growth in Turkey.
Notes
1. During this period, populist cycles, high and volatile inflation rates, huge budget deficits, excessive debt accumulation, and the resulting severe economic crises were the recurrent mac-roeconomic issues in the Turkish economy. Real GDP grew at a low average annual rate of 3.5 percent, from 1976 to 2001.
2. During the 2002–5 period, real GDP grew very rapidly, at an annual average of 7.5 percent. On the other hand, the inflation rate (percentage change in GNP deflator), which roughly indicates
macroeconomic instability (see Fischer 1993b), fell from 55.3 percentin 2001 to 5.3 percent in
2005.
3. Factors such as institutional and structural reforms, the successful monetary performance of a more independent Turkish central bank, relatively stable political and external environment, and the prospect of EU membership have also contributed to favorable performance.
4. See, e.g., Celasun and Rodrik (1989), Ertugrul and Selcuk (2002), Ismihan (2003), Metin-Ozcan et al. (2001), and the references therein for more detail on Turkey’s macroeconomic history.
5. The macroeconomic instability index (MII) is useful to evaluate and compare the level of macroeconomic instability within and between time periods. Moreover, it is a relatively more comprehensive measure of macroeconomic instability, as it is based on several macroeconomic instability indicators, such as the inflation rate, change in exchange rate, public deficit–to-GNP ratio, and external debt–to-GNP ratio (see Ismihan 2003 for more detail).
6. Turkey also suffered a severe economic crisis in 1994.
7. See Ismihan and Metin-Ozcan (2008)—a working paper version of this study—for more detail on the utilized growth accounting framework.
8. TFP growth is calculated as a residual from a growth accounting formula. Thus, TFP growth can be thought of as a measure of gains (or losses) in economic efficiency, but one should not forget that it reflects “a myriad of determinants, in addition to technological innovation, that influ-ence growth but that were not accounted for by the measured increases in factor inputs. Examples include the implications of sustained political turmoil, external shocks, changes in government policy, institutional changes or measurement errors” (Bosworth and Collins 2003, p. 3).
9. Clearly, the only parameter determining the relative contribution of the three factors (sources) is α. Thus, the choice of an appropriate value for α is a crucial step in the growth accounting
exer-cises. See Ismihan and Metin-Ozcan (2008) for more detail on the choice of the value of α. In this
study, we also reworked the growth accounting exercises for several plausible values of α. That is,
we performed a sensitivity analysis with the plausible minimum (α = 0.35) and maximum values
of α (α = 0.65). Even if the importance of TFP growth and physical (as well as human) capital
accumulation change in opposite directions as we change the value of α, the general trends of the
three sources remain the same. Moreover, our interpretations of those trends will not change. The results of the sensitivity analysis can be requested from the first author.
10. All the reported growth rates refer to the average annual rate of growth over the relevant period.
11. See Ismihan (2003) and Ismihan et al. (2005) for the empirical and theoretical backgrounds on the role of macroeconomic instability in output and TFP growth.
12. This observation is in line with the argument of Grossman and Helpman (1991) that coun-tries can acquire know-how from abroad through imports, as the imported goods embody foreign technology.
13. See, e.g., Sturm et al. (1998) for an overview of the role of public capital in TFP growth. 14. Especially due to the successful stabilization during the early 1980s. However, macroeco-nomic instability increased during the late 1980s, mainly due to a rise in political instability (see Figure 1). In line with these developments, the steady rise in TFP over the early and mid-1980s ended in 1987, and the TFP level fell from 1987 to 1989 (see Figure 2).
15. Turkey formed a customs union with the European Union in 1995; this increased the imports-to-GNP ratio and possibly helped to increase TFP, at least temporarily (as evident in Figure 2). However, this favorable effect on TFP seems to be offset by the unfavorable conse-quences of political instability, unsound macroeconomic policies, and associated high levels of macroeconomic instability.
16. A rise in the imports-to-GNP ratio may help to increase TFP by increasing the competi-tion and also by increasing the diffusion of know-how from abroad. According to Grossman and
Helpman (1991), countries can acquire know-how from abroad through imports, as the imported goods embody foreign technology.
17. The Appendix presents the details on definitions and sources of data.
18. Besides the theoretical considerations, the choice of variables is also affected by several other considerations, such as data availability and the limitations of a cointegrated VAR analysis with small sample size. Thus, other relevant variables (e.g., research and development expenditures as a share of output) are not included in the system.
19. Each of the four series (MII, Imrat, Igirat, TFP050) contains a unit root. ADF and Perron test results are available at a working paper version of this study (Ismihan and Metin-Ozcan 2008). They can be also requested from the authors.
20. The LR test suggests a VAR(1). The Schwarz Bayesian Criterion (SBC) also suggests VAR(1). The TFP050 equation in VAR(1) model shows heteroskedasticity and nonnormality. This is clearly evident in the residual plot of that equation, in which 1994 and 1999 are outlying observations. We include an impulse dummy for 1994 (for the severe economic crisis) and 1999 (for the terrible earthquake in that year) unrestrictively in the VAR(1) model. After including this dummy, none of the equations shows serious autocorrelation, heteroskedasticity, and nonnormality. However, the qualitative nature of our cointegration results is not changed, even if we do not consider these impulse dummies in our analysis.
21. The trace and max statistics also suggest one cointegration relation when we account for the 1980 structural change.
22. Economic intuition seems to suggest the following simple long-run import relation based on the cointegration results in Table 3: Imrat = 91.9 + 70.8 MII – 3.1 TFP050 – 5.7 Igirat. This equation implies that imports (as a share of output) are positively affected by macroeconomic in-stability and negatively affected by TFP and public infrastructure investment (as a share of output) for the period under study.
23. Contrary to the orthogonalized impulse response functions, generalized impulse response functions do not depend on the ordering of the variables within the system (Pesaran and Shin 1998). Thus, we prefer to use the generalized impulse response functions in our analysis.
24. The results of generalized impulse response analyses for the two alternative versions of the model can be requested from the first author.
References
Bosworth, B., and S.M. Collins. 2003. The Empirics of Growth: An Update. Washington, DC: Brookings Institution Press.
Burnside, C., and D. Dollar. 2000. “Aid, Policies, and Growth.” American Economic Review 90, no. 4: 847–868.
Celasun, M., and D. Rodrik. 1989. “Debt, Adjustment, and Growth: Turkey.” In Developing
Country Debt and Economic Performance: Country Studies, ed. J. Sachs and S.M. Collins, pp. 615–808. Chicago: University of Chicago Press.
Easterly, W., and S. Rebelo. 1993. “Fiscal Policy and Economic Growth: An Empirical Investi-gation.” Journal of Monetary Economics 32, no. 3: 417–458.
Ertugrul, A., and F. Selcuk. 2002. “Turkish Economy: 1980–2001.” In Inflation and
Disinfla-tion in Turkey, ed. A. Kibritcioglu, L. Rittenberg, and F. Selcuk, pp. 13–40. Aldershot, UK: Ashgate.
Fischer, S. 1993a. “Does Macroeconomic Policy Matter? Evidence from Developing Countries.” Occasional Paper no. 27, International Center for Economic Growth, Budapest.
———. 1993b. “The Role of Macroeconomic Factors in Growth.” Journal of Monetary
Eco-nomics 32, no. 3: 485–512.
Grossman, G.M., and E. Helpman. 1991. Innovation and Growth in the Global Economy. Cam-bridge, MA: MIT Press.
Hendry, F.D., and K. Juselius. 2001. “Explaining Cointegration Analysis: Part II.” Energy
Jour-nal 22, no. 1: 75–120.
Ismihan, M. 2003. “The Role of Politics and Instability on Public Spending Dynamics and Mac-roeconomic Performance: Theory and Evidence from Turkey.” Ph.D. dissertation, Middle East Technical University, Ankara.
Ismihan, M., and K. Metin-Ozcan. 2008. “Productivity and Growth in an Unstable Emerging Market Economy: The Case of Turkey, 1960–2004.” Department of Economics Discussion Paper no. 08–01, Bilkent University, Ankara.
Ismihan, M.; K. Metin-Ozcan; and A. Tansel. 2005. “The Role of Macroeconomic Instability in Public and Private Capital Accumulation and Growth: The Case of Turkey 1963–1999.”
Ap-plied Economics 37, no. 2: 239–251.
Metin-Ozcan, K.; E. Voyvoda; and E. Yeldan. 2001. “Dynamics of Macroeconomic Adjustment in a Globalized Developing Economy: Growth, Accumulation, and Distribution, Turkey 1969–1998.” Canadian Journal of Development Studies 22, no. 1: 219–253.
Osterwald-Lenum, M. 1992. “A Note with Quantiles of the Asymptotic Distribution of the Maximum Likelihood Cointegration Rank Test Statistics.” Oxford Bulletin of Economics and
Statistics 54, no. 3: 461–471.
Pesaran, M.H., and Y. Shin. 1998. “Impulse Response Analysis in Linear Multivariate Models.”
Economics Letters 58, no. 1: 17–29.
Sturm, J.; G.H. Kuper; and J. De Haan. 1998. “Modeling Government Investment and Economic Growth on a Macro Level: A Review.” In Market Behavior and Macroeconomic Modeling, ed. S. Brakman, H. van Ees, and S.K. Kuipers, pp. 359–406. London: Macmillan.
Togan, S. 2003. “Productivity of Labor.” In Competitiveness in the Middle Eastern and North
African Countries, ed. S. Togan and H. Kheir-El-Din, pp. 385–420. Economic Research Forum Research Report Series. Cairo: ERF.
Appendix
Iprat (Igrat) is real private (public) investment (percent share of real GNP). Both real GNP and investment are at 1998 constant prices. Source: State Planning Organization (SPO).
Igirat is real public infrastructure investment (percent share of real GNP). Both real GNP and public investment are at 1998 constant prices. Public infrastructure investment is the total of the public energy, transportation, and communication sectors’ fixed investments.
Source: SPO.
Imrat (Exrat) is imports (exports)-to-GNP ratio (percent). Source: State Institute of Statistics (SIS/Turkstat).
The macroeconomic instability index (MII) proxies macroeconomic instability. This index is calculated by using human development index (HDI) methodology; it is based on macroeconomic instability indicators;—namely, the inflation rate, public deficit-to-GNP ratio, external debt-to-GNP ratio, and change in exchange rate. It is a simple average of the four subindices obtained from these four variables. MII is bounded between 0 and 1 due to its construction. Source: Ismihan (2003).
Infl represents the inflation rate, calculated as a percentage change in the GNP deflator (1998 = 100). Source: SPO.
Output (Y) is measured by GDP (at 1998 prices, billions of Turkish lira). The State Institute of Statistics (SIS/Turkstat) has provided GDP series extending back as far as 1968. We extended this series back to 1960. See Ismihan and Metin-Ozcan (2008) for details.
Capital stock (K) is at 1998 constant prices, estimated with the perpetual inventory method. See Ismihan and Metin-Ozcan (2008) for details.
Labor (L) input is measured by employment data. Source: State Institute of Statistics (SIS).
Human Capital (H) is obtained as follows: H = hL, where h is the educational attainment per worker. See Ismihan and Metin-Ozcan (2008) for details.
TFP050, TFP035, and TFP065 refer to the estimated series of TFP with α set at 0.50,
0.35, and 0.65, respectively.