DOI 10.24425/119048
Original article
U. Aydogdu
1, R. Yildiz
2, H. Guzelbektes
3,5, A. Naseri
3, E. Akyuz
4, I. Sen
3,61 Balikesir University, Faculty of Veterinary Medicine,
Department of Internal Medicine, 10145, Balikesir, Turkey
2 Mehmet Akif Ersoy University, Faculty of Veterinary Medicine,
Department of Internal Medicine, 15030, Burdur, Turkey
3 Selcuk University, Faculty of Veterinary Medicine,
Department of Internal Medicine, Campus, 42075, Konya, Turkey
4 Kafkas University, Faculty of Veterinary Medicine,
Department of Internal Medicine, 36300, Kars, Turkey
6 Near East University, Faculty of Veterinary Medicine,
Department of Internal Medicine, Nicosia, North Cyprus, Turkey
5 Department of Internal Medicine, Faculty of Veterinary Medicine,
Kyrgyz Turkish Manas University, Bishkek, Kyrgyzstan
Correspondence to: U. Aydogdu, e-mail: [email protected], tel.: +90266 6136692/452, fax: +902666136657
Abstract
The aim of this study was to compare effect of combinations of intravenous isotonic sodium bicarbonate (NaHCO3), acetate Ringer, lactate Ringer and small-volume hypertonic sodium chloride (NaCI) solutions along with oral electrolyte solutions (OES) on the treatment of neona-tal calf diarrhea with moderate dehydration and metabolic acidosis. Thirty-two calves with diar-rhea were used in the study. Calves were randomly assigned to receive acetate Ringer solution (n=8), lactate Ringer solution (n=8), isotonic NaHCO3 (n=8) and 7.2% saline solutions (n=8), and two liters of OES were administrated to all calves orally at the end of intravenous administra-tion. Blood samples for blood gas and biochemical analyses were collected at 0 hours and at 0.5, 1, 2, 4, 6 and 24 hours intervals. All the calves had mild to moderate metabolic acidosis on admis-sion. Increased plasma volume and sodium concentration, but decreased serum total protein were observed within 0.5 hours following administration of hypertonic 7.2% NaCI + OES, com-pared to other 3 groups. In conclusion, administration of intravenous hypertonic 7.2% NaCI solu-tion in small volume along with OES provided fast and effective improvement of dehydrasolu-tion and acid-base abnormalities within short time in treatment of calf diarrhea with moderate dehydra-tion and metabolic acidosis.
Key words:
calves, diarrhea, metabolic acidosis, fluid therapyEffect of combinations of intravenous
small-volume hypertonic sodium chloride,
acetate Ringer, sodium bicarbonate,
and lactate Ringer solutions along with oral
fluid on the treatment of calf diarrhea
Introduction
Calves with diarrhea lose large amounts of fluid and electrolytes (Phillips et al. 1971, Fisher and De La Fuente 1972), with attendant dehydration and acidosis that requires rehydration therapy (Groutides and Mi-chell 1990). Fluids and electrolytes are usually adminis-tered orally or parenterally to ruminants. The method to be selected for fluid application in diarrhea depends on the presence or absence of a suckle reflex and the degree of dehydration. It is recommended to apply oral electrolyte solution to the calves with less than 8% de-hydration and with suckle reflex. It is recommended that intravenous fluids should be given to the calves with no suckle reflex and more than 8% dehydrated (Roussel and Kasari 1990, Naylor 1996, Constable 2003, Smith 2009, Sen and Constable 2013). Sodium bi-carbonate solutions are usually used in the treatment of severe metabolic acidosis where base excess is more negative than -10 mmol/L (Garcia 1999, Kasari 1999, Sen et al. 2009). For the treatment of mild to moderate acidosis, the lactate Ringer solutions or the acetate Ringer solutions could be used (Nakagawa et al. 2009). Small quantities of hypertonic sodium chloride solu-tions (7.2%) were shown to be an efficient treatment in animals with hypovolemic shock, severe dehydration (Senturk 2003) and endotoxemia (Constable et al. 1991a,b). Intravenous administration of hypertonic sa-line (HSS) can be combined with an oral alkalizing. Be-cause the hypertonic saline alone does not improve ac-idosis (Constable 1999). HSS was found to be successful in the rehydration of hypovolemic calves (Constable et al. 1996, Walker et al. 1998) which were dehydrated ex-perimentally by the administration of sucrose and di-uretics. Until now, we did not find any study on effect to systemic alkalinization by intravenous four crystalloid solutions along with OES in the treatment of calf diar-rhea.
The aim of this study was to compare effect of com-binations of intravenous isotonic sodium bicarbonate, acetate Ringer, lactate Ringer and small-volume hypertonic sodium chloride solutions along with oral electrolyte solutions on the treatment of neonatal calf diarrhea with moderate dehydration and metabolic ac-idosis.
Materials and Methods
CalvesThis study was done at Selcuk University, Faculty of Veterinary Medicine, Large Animal Clinic, and ap-proved by Ethics Committee of the Faculty. Thirty-two calves with diarrhea were used in the study. Calves
(n = 32) were enrolled to in the study if they had mild to moderate dehydration (as assessed by eye recession into the orbit of <3 mm (Constable et al. 1998) and metabolic acidosis (ie, jugular venous pH was approxi-mately ≥7.2). Exclusion criteria included the presence of concurrent severe health problem. Calves were less than 30 days old and with mean body weight range of 32.4±4.51 kg on admission. Venous catheter to V. auricularis was placed aseptically for administration of intravenous solutions.
Routine physical examination findings including ex-tent of eyeball recession into the orbit, ability to stand, partly weak suckling reflex and decrease in cervical skin elasticity were recorded. Clinical assessment was done before the treatment and at periodically intervals with-in 24 hours post treatment. We did not attempt to iden-tify the underlying cause of the diarrhea.
Treatment groups
After initial clinical and acid-base status assess-ment, calves were randomly allocated to 1 of 4 treat-ment groups.
Treatment group I (n=8); acetate Ringer
solu-tion (80 ml/kg) was given via intravenous route at rate of 30 ml/kg/h + Oral electrolyte solution (OES). Re-quired acetate Ringer solution was given approximately within 180 minutes.
Treatment group II (n=8); lactate Ringer
solu-tion (80 ml/kg) was given via intravenous route at rate of 30 ml/kg/h + OES. Required lactate Ringer solution was given approximately within 180 minutes.
Treatment group III (n=8); Isotonic sodium
bi-carbonate (1.3% NaHCO3) was given via intravenous route at rate of 20 ml/kg/h + OES. Required isotonic sodium bicarbonate was given approximately within 120 minutes.
Calculation of sodium bicarbonate needed for indi-vidual calves: sodium bicarbonate needed (mEq): neg-ative base deficit (mmol/L) X 0.6 (factor for calves for extracellular fluid space) X BW (kg) and converted to mmol/L to gram of sodium bicarbonate, divided by 12 (Suzuki et al. 2002, Coskun et al. 2010, Trefz et al. 2012).
Treatment group IV (n=8); 7.2% hypertonic
sa-line (4 ml/kg) was given via intravenous route(Batmaz et al. 2003, Constable 2003a) + OES. Required 7.2% hypertonic saline was given approximately within 10 minutes.
The composition of fluids to be used for intrave-nous fluid treatment are presented in Table 1.
Oral electrolyte solution was immediately adminis-trated to all calves orally at the end of administration intravenous. All calves (n=32) received 2 L of OES at room temperature (20–22oC) by feeding bottle. Oral
electrolyte solution included sodium acetate + glucose (25 gram/L) and had osmolarity of the 150 mmol/L (Sen et al. 2009). Ceftiofur hydrochloride (Cevtivil, Vil-san, Turkey) was administered (2.2 mg/kg IM, once in a day, 5 days) daily to all calves.
Blood samples collection
Jugular venous blood samples for blood gas and biochemical parameters were obtained at 0 hours (immediately prior to IV solutions administration) and after 0.5, 1, 2, 4 and 24 hours during the experiment. Venous blood samples for blood gas were taken into heparinized 1 ml syringes and were measured within 15 minutes. Blood samples for hematologic analyses were collected prior to IV solutions administration and at 24 hour of experiment. Blood samples for biochemical analysis were collected into plain tubes, allowed to clot at room temperature, centrifuged, and the serum was harvested and stored at -20°C until analyzed.
Calves were monitored closely for the first 24 h by a supervising veterinarian. After the 24 h study period additional supportive treatment was administered as needed until the calves were discharged from the veteri- nary hospital and treatments included alkalizing oral electrolyte solutions. Most of calves received additional OES after 24 h.
Laboratory analysis
Blood gas analysis was performed using a blood gas analyzer (GEM Premier 3000, Instrumentation Labo-ratory, Lexington, MA, USA), the values were correct-ed for rectal temperature, and the plasma bicarbonate concentration (HCO3) and extracellular base excess (BE) values were calculated. Blood sodium (Na) and potassium (K) concentrations were measured using ion-selective electrodes and total protein (TP) concen-tration was measured in serum samples by a commer-cially available kit (ADS; Analytic Diagnostic Systems, Istanbul, Turkey) using a spectrophotometer (BT 3000 plus, Biotecnical Inc, SPA, Via lizenca, 18 00155, Rome, Italy). White blood cell (WBC) and hematocrit levels were determined by using hematological analyzer (MS4e Melet Schloesing Laboratories, France).
Determination of percentage change in plasma volume
Change in the plasma volume at time i was calculat-ed from the serum protein concentration at time = 0 min (SP0) and the serum protein concentration at time i (SPi), whereby: Percent change in plasma volume at time i = (SP0 – SPi)×100/SPi (van Beaumont et al. 1972).
Statistical analysis
Data were expressed as least squares mean and standard error of mean. P<0.05 was considered as sig-nificant. A statistical software program (SPSS 15.0 for Windows, SPSS Inc., Chicago, IL, USA) was used for all statistical analyses. ANOVA and Tukey multiple range tests were used to evaluate differences of each treatment groups during the experiment and signifi-cance level of variation. Paired-Samples t-test was used to determine differences between pre-treatment (0th hour) and post-treatment (24th hour) hematologi-cal parameters.
Results
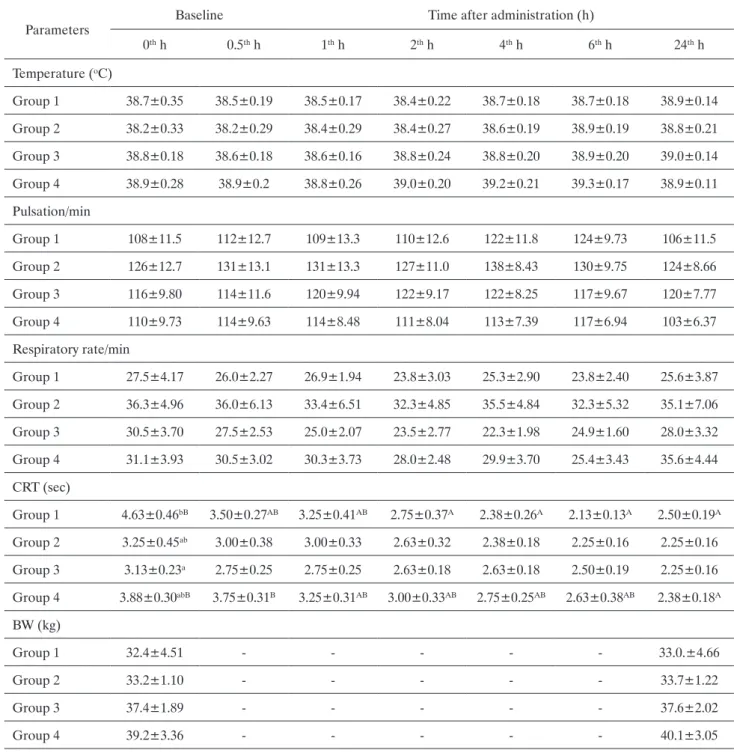
Clinical findingsAll calves had diarrhea. According to history taken from the owners, the calves were affected by diarrhea for about 1 to 2 days. All the calves had also moderate acidemia (pH≥7.2<7.35) and <8% dehydration with a degree of enophthalmos (<3 mm). Most of calves had partly sucking reflex (not strongest), standing position, and a few calves had mild mental depression. Clinical findings in 32 calves are presented before treatment (baseline) and 24 hours after treatment administration in Table 2. There were no statistical difference in clini-cal findings (except CRT) at baseline between 4 groups.
In the meantime, there were no statistically differ-ent respiratory rate, pulse, body temperature and body weights between 4 treatments during the experiment, whereas there were statistically significant differences in CRT between treatments I and also treatment IV during the experiment compared to baseline (Table 2).
Fluid therapy
Each calf received intravenous + OES combination during the treatment. According to body weight of calves, calves in the treatment group I received approx-imately 1760 to 4120 ml of acetate Ringer solutions, calves in the treatment group II received approximately 1520 to 3760 ml of lactate Ringer solution, calves in the treatment group III received approximately 650 to 2177 ml of isotonic sodium bicarbonate solution, whereas calves in the treatment group IV received approximate-ly 122 to 202 ml of hypertonic NaCI (7.2%) solutions. Each calf received 2 L of OES at the end of IV solution administration by feeding bottle. Calves had free access to water during to treatment. After administration of IV and oral solutions, all calves recovered with support treatment.
Acid-base analysis
All the calves had mild to moderate metabolic aci-dosis on admission, with jugular venous blood pH rang-ing from 7.24 to 7.27, pCO2 ranging from 35.7 to 42 mm Hg, plasma bicarbonate concentration ranging from 16 to 19 mmol/L, base excess ranging from -7.84 to -11.1 mEq/L and lactate ranging from 1.48 to 2.76 mmol/L (Table 3). However, there were no statistically signifi-cant differences in blood gas values on admission among 4 groups (Table 3).
Intravenous administration of four different solu-tions along with OES to calves with mild to moderate acidosis caused increase in venous blood pH, HCO3, BE (Table 3). However, there was no observed change in pCO2 within 6 hours of treatment. The rate of sys-temic alkalinization showed similarity between the four treatment groups within 4 hours of the study period based on venous blood pH, HCO3 and base excess. However, these blood gas parameters were corrected more early in hypertonic saline +OES group compared to other 3 groups.
While serum potassium concentrations decreased in 4 groups 30 minutes after treatment, serum sodium concentrations increased only in group 4 (Table 3).
Hematologic Analyses
WBC of calves was high on admission (Table 3). However, WBC level decreased (except group 1) after treatment at 24 hours compared to baseline values.
Plasma Volume
Changes in plasma volume are presented before treatment and after treatment during 24 hours in Table 4. Plasma volume increased constantly in calves administered 7.2% NaCI 30 minutes after treatment. Plasma volume started to increase in calves adminis-tered acetate Ringer and NaHCO3 in 60 minutes, but increased in lactate Ringer group 120 minutes after treatment (Table 4). The changes in plasma volume relative to baseline were significantly higher in calves of group IV at 0.5 h compared to other 3 groups.
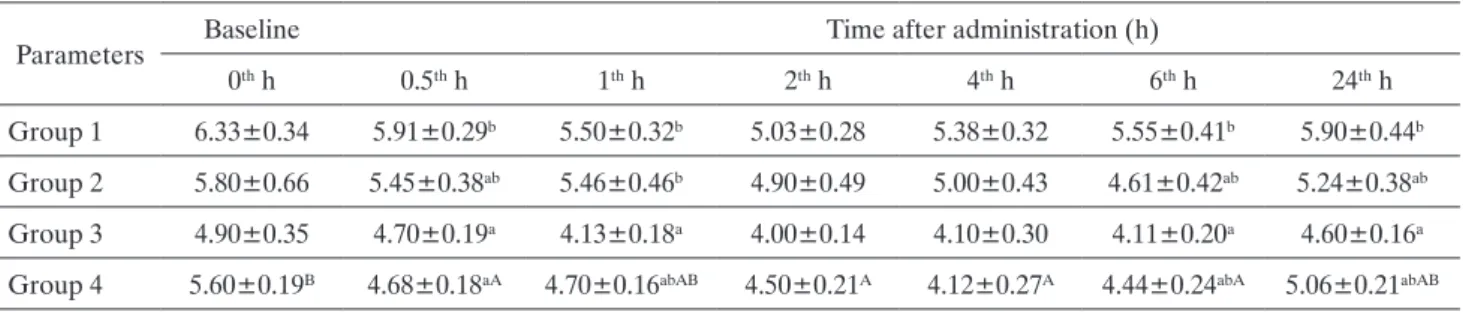
Serum total protein concentration
There were no significant differences in serum total protein concentrations at baseline between 4 groups (Table 5). However, total protein concentrations were decreased significantly in 7.2% NaCl group 30 minutes after treatment.
Discussion
The present study has shown that administration of hypertonic NaCI + OES combination is useful reduc-ing time and lowerreduc-ing the cost of treatment of diarrheic calves with mild to moderate metabolic acidosis. Dehy-dration and metabolic acidosis occur in almost all cases of calf diarrhea. IV and OES combination in rehydra-tion therapy should be advised for both reducing time and lowering the cost of treatment of calf diarrhea. In the study, effects of 4 crystalloid solutions along with OES were evaluated on diarrheic calves with mild to moderate metabolic acidosis. It is generally accepted that any calf with a suckling reflex is suitable for OES. In the study, all of calves had suckling reflex, but it was not strong.
Oral electrolyte therapy is generally easier to per-form on the farms in calves with diarrhea. Calves fed with hyperosmotic oral rehydrating solutions (600–717 mOsm/l) have a slower abomasal emptying rate com-pared to calves fed iso-osmotic oral rehydrating solu-tions (300–360 mOsm/l). Suckling an iso-osmotic oral rehydrating solution provides the fastest rate of solu-tion delivery to the small intestine and a slightly faster rate of plasma volume expansion than does suckling or oesophageal intubation of a hypertonic oral rehydrat-ing solution (Meganck et al. 2014). In the study, isoton-ic oral electrolyte solution that included acetate was used in calves. Sen et al. (2009) indicated that sodium acetate oral rehydrating solutions are more effective in expanding the plasma volume than sodium bicarbonate OES solutions. In diarrhea with no suckling reflexes, continuous IV infusion of isotonic fluids is recommend-ed as treatment (Berchtold 1999). However, this treat-ment is troublesome and expensive. Alternatively, oral rehydration solutions are recommended for following rapid IV administration of hypertonic saline solution (Constable 2002). In veterinary medicine, HSS can be used in the treatment of hemorrhagic and endotoxemic shocks in various animals. HSS was also found to be successful for the treatment of hypovolemic calves (Constable et al. 1996, Walker et al. 1998) which were dehydrated experimentally by the administration of su-crose and diuretics (Koch and Kaske 2008). The hyper-tonic saline is administered intravenously at a dose of 4-5 ml / kg for 4-5 minutes (Suzuki et al. 1998, Consta-ble 2003a). Oral rehydration solutions following rapid intravenous hypertonic saline administration are re- commended (Koch and Kaske 2008). Until now, there is no information on the effect on systemic alkaliniza-tion of four crystalloid solualkaliniza-tions along with OES in calves with diarrhea. In the study, the rate of systemic alkalinization showed similarity between the four treat-ment groups within 4 hours of experitreat-ment based on
ef-Table 1. Composition of the intravenous solutions used in this study. Na+ mEq/L K + mEq/L Cl -
mEq/L Lactate mEq/L AsetatemEq/L Ca
++
mEq/L Mg
++
mEq/L Gluconate mEq/L HCO3
-mEq/L Fosfat Acetate Ringer 141 5 98 - 27 - 3 23 - 1 Lactate Ringer 130 4 109.1 27.6 - 3 - - - -%1.3 NaHCO3 155 - - - 155 -7.2 % NaCl 1232 - 1232 - - -
-Table 2. Changes in clinical parameters and body weight in calves given intravenous and oral electrolyte solution.
Parameters Baseline Time after administration (h)
0th h 0.5th h 1th h 2th h 4th h 6th h 24th h Temperature (oC) Group 1 38.7±0.35 38.5±0.19 38.5±0.17 38.4±0.22 38.7±0.18 38.7±0.18 38.9±0.14 Group 2 38.2±0.33 38.2±0.29 38.4±0.29 38.4±0.27 38.6±0.19 38.9±0.19 38.8±0.21 Group 3 38.8±0.18 38.6±0.18 38.6±0.16 38.8±0.24 38.8±0.20 38.9±0.20 39.0±0.14 Group 4 38.9±0.28 38.9±0.2 38.8±0.26 39.0±0.20 39.2±0.21 39.3±0.17 38.9±0.11 Pulsation/min Group 1 108±11.5 112±12.7 109±13.3 110±12.6 122±11.8 124±9.73 106±11.5 Group 2 126±12.7 131±13.1 131±13.3 127±11.0 138±8.43 130±9.75 124±8.66 Group 3 116±9.80 114±11.6 120±9.94 122±9.17 122±8.25 117±9.67 120±7.77 Group 4 110±9.73 114±9.63 114±8.48 111±8.04 113±7.39 117±6.94 103±6.37 Respiratory rate/min Group 1 27.5±4.17 26.0±2.27 26.9±1.94 23.8±3.03 25.3±2.90 23.8±2.40 25.6±3.87 Group 2 36.3±4.96 36.0±6.13 33.4±6.51 32.3±4.85 35.5±4.84 32.3±5.32 35.1±7.06 Group 3 30.5±3.70 27.5±2.53 25.0±2.07 23.5±2.77 22.3±1.98 24.9±1.60 28.0±3.32 Group 4 31.1±3.93 30.5±3.02 30.3±3.73 28.0±2.48 29.9±3.70 25.4±3.43 35.6±4.44 CRT (sec) Group 1 4.63±0.46bB 3.50±0.27AB 3.25±0.41AB 2.75±0.37A 2.38±0.26A 2.13±0.13A 2.50±0.19A Group 2 3.25±0.45ab 3.00±0.38 3.00±0.33 2.63±0.32 2.38±0.18 2.25±0.16 2.25±0.16 Group 3 3.13±0.23a 2.75±0.25 2.75±0.25 2.63±0.18 2.63±0.18 2.50±0.19 2.25±0.16 Group 4 3.88±0.30abB 3.75±0.31B 3.25±0.31AB 3.00±0.33AB 2.75±0.25AB 2.63±0.38AB 2.38±0.18A BW (kg) Group 1 32.4±4.51 - - - 33.0.±4.66 Group 2 33.2±1.10 - - - 33.7±1.22 Group 3 37.4±1.89 - - - 37.6±2.02 Group 4 39.2±3.36 - - - 40.1±3.05
CRT: Capillary refill time, BW: body weight.
Table 3. Changes in blood gases and hematologic parameters in calves given intravenous and oral solution.
Parameters Baseline Time after administration (h)
0th h 0.5th h 1th h 2th h 4th h 6th h 24th h
pH
Group 1 7.27±0.02A 7.31±0.03A 7.30±0.01A 7.29±0.02aA 7.34±0.02aAB 7.40±0.02B 7.40±0.01B
Group 2 7.24±0.01A 7.27±0.01A 7.28±0.02AB 7.30±0.02aAB 7.36±0.02abBC 7.42±0.02C 7.39±0.02C
Group 3 7.26±0.02A 7.32±0.02AB 7.32±0.03AB 7.36±0.02abBC 7.41±0.03abBC 7.46±0.03B 7.45±0.02B
Group 4 7.27±0.03A 7.28±0.02A 7.33±0.02AB 7.38±0.02bBC 7.44±0.02bC 7.44±0.01C 7.40±0.02BC pCO2 (mm Hg) Group 1 37.0±2.20A 34.8±3.29A 37.5±2.37A 39.5±2.15AB 39.8±1.74AB 43.6±2.63AB 48.5±2.77B Group 2 42.0±2.65A 39.4±1.87A 39.8±2.32A 40.4±2.19A 42.0±1.98A 45.6±2.38AB 52.5±2.24B Group 3 35.9±2.85A 37.6±2.15A 39.3±2.41A 40.8±1.91AB 39.0±2.45A 41.8±1.67AB 48.9±1.22B Group 4 42.0±4.02 38.8±1.97 37.5±2.10 40.9±1.94 42.9±1.62 43.1±2.16 47.0±2.46 pO2 (mm Hg) Group 1 29.3±2.35AB 32.5±3.36B 29.3±2.70AB 26.6±1.99AB 27.6±1.45AB 26.4±1.60AB 22.0±2.67A
Group 2 22.5±1.75AB 28.0±1.49BC 25.8±2.14ABC 30.1±1.48C 27.3±1.93ABC 24.1±1.13AC 20.6±1.19A
Group 3 27.0±1.90 26.8±2.19 27.8±1.54 25.9±0.72 26.5±1.93 22.8±1.25 24.8±1.45 Group 4 21.4±2.83 29.3±2.34 27.6±1.07 26.4±1.34 24.6±1.76 24.9±1.80 23.0±1.45 Na+ (mmol/L) Group 1 133±3.05 136±2.63 133±3.35 134±2.57 137±2.24 139±2.48 141±2.09 Group 2 135±2.18 135±2.16 135±1.98 135±1.22 137±1.19 138±1.07 138±1.57 Group 3 134±6.69 138±6.39 138±6.17 140±5.89 142±5.97 144±4.56 140±3.52 Group 4 130±3.51 141±3.10 138±3.40 138±3.18 137±3.04 139±2.22 136±2.27 K+ (mmol/L) Group 1 4.70±0.41B 3.95±0.32AB 4.14±0.45AB 3.91±0.36AB 3.31±0.26AB 3.04±0.22A 3.65±0.25AB Group 2 4.81±0.44 4.51±0.42 4.53±0.46 4.20±0.43 3.98±0.36 3.34±0.28 3.80±0.29 Group 3 4.38±0.26C 3.80±0.16BC 3.66±0.12B 3.55±0.16B 3.13±0.14AB 2.79±0.17A 3.28±0.07AB Group 4 4.81±0.40B 3.80±0.15AB 3.91±0.22AB 3.61±0.27A 3.48±0.24A 3.40±0.21A 4.11±0.25AB Lactate (mmol/L) Group 1 1.48±0.31 1.26±0.22 1.21±0.27 1.20±0.26 1.14±0.22 1.64±0.38 1.33±0.29 Group 2 2.76±1.09 2.89±1.16 2.63±1.01 2.56±0.90 1.95±0.73 1.76±0.54 1.71±0.35 Group 3 1.56±0.67 1.25±0.47 1.20±0.32 1.11±0.35 1.35±0.38 1.50±0.47 1.03±0.19 Group 4 2.36±1.04 1.85±0.75 1.70±0.64 1.83±0.66 1.49±0.41 1.35±0.34 1.39±0.38 HCO3-(mmol/L) Group 1 17.0±1.25A 17.0±1.24A 18.3±1.10A 19.1±1.17aA 21.8±1.52aAB 27.0±1.65BC 30.4±1.96C Group 2 17.8±0.97A 18.1±0.91A 18.7±1.16A 20.1±1.55aA 23.8±1.72abAB 30.0±2.51BC 32.5±2.31C
Group 3 16.0±1.30A 19.6±1.07AB 20.5±1.30AB 23.1±0.82abB 24.4±1.17abBC 29.8±1.64CD 34.3±1.35D
Group 4 19.0±0.79A 18.2±1.13A 20.7±0.94A 25.2±1.29bAB 29.0±1.33bB 29.0±1.45B 25.6±3.59AB
TCO2 (mm Hg)
Group 1 18.1±1.30A 18.0±1.33A 19.4±1.16A 20.3±1.23aA 23.0±1.57aAB 28.3±1.71BC 31.9±2.04C
Group 2 19.1±1.04A 19.3±0.97A 19.9±1.22A 21.3±1.60aA 25.0±1.78abAB 31.4±2.58BC 34.1±2.35C
Group 3 17.1±1.39A 20.7±1.12AB 21.7±1.34AB 24.3±0.84abB 25.6±1.19abBC 31.1±1.65CD 35.8±1.34D
Group 4 20.3±0.87A 19.3±1.17A 21.9±0.97AB 26.4±1.34bBC 30.3±1.36bC 30.3±1.51C 30.8±1.81C
BE (mmol/L)
Group 1 -10.0±1.41A -9.40±1.17A -6.33±2.28A -7.46±1.33aA -3.94±1.77aAB 2.15±1.77BC 5.64±2.07C
Group 2 -9.61±0.98A -8.81±1.01A -8.11±1.32A -6.33±1.77aA -1.76±1.99aAB 5.45±2.86BC 7.58±2.64C
Group 3 -11.1±1.45A -6.48±1.20AB -5.56±1.58AB -2.33±1.05abB -0.26±1.42abBC 5.98±1.96CD 10.3±1.65D
Group 4 -7.84±0.85A -8.65±1.38A -5.25±1.13AB 0.30±1.46bBC 4.84±1.55bC 4.71±1.56C 4.55±1.91C O2 SAT (%) Group 1 44.1±5.39 51.6±5.87 38.6±6.73 40.9±4.61 46.9±3.42 48.1±3.96 36.9±6.55 Group 2 28.1±4.01A 42.3±3.26AB 37.9±5.08AB 49.3±2.68B 47.0±4.69B 44.0±2.75AB 33.9±3.63AB Group 3 38.9±4.10 43.5±5.57 46.1±4.78 44.5±2.15 48.8±5.61 43.6±4.46 48.3±4.72 Group 4 29.6±7.36 45.3±5.16 46.2±3.03 48.3±3.73 39.1±6.50 46.8±4.66 40.0±4.57 WBC (103/mm3) Group 1 14.3±1.31 - - - 16.9±2.35b Group 2 15.2±2.02 - - - 12.2±1.60ab Group 3 18.6±2.10 - - - 10.2±1.64ab* Group 4 14.3±3.10 - - - 8.15±1.14a* Hematocrit (%) Group 1 30.5±1.39 - - - 26.5±1.37* Group 2 25.3±1.10 - - - 23.6±0.77 Group 3 27.4±2.65 - - - 24.8±2.46* Group 4 30.5±0.97 - - - 26.9±2.06
pH: concentration of hydrogen ions, PCO2: partial pressure of carbon dioxide, PO2 partial pressure of oxygen, Na+; sodium, K+; potassium HCO3-: bicarbo-
nate, TCO2; total amount of carbon dioxide, BEecf: base excess of extracellular fluid, O2 SAT. %: oxygen saturation, WBC; white blood cell. Different letters in the same rows (A, B, C, D) and columns (a, b, c) point statistically significant differences (p<0.05). * Indicates statistically significant between 0 and 24 hours (p<0.05).
fects on jugular venous blood pH, HCO3 and base ex-cess. However, administration duration of the HSS was short compared with other groups. In addition, volume of HSS that was administrated to calf was also very small compared to other solutions and the combination was cheaper than the others. Plasma volume increased constantly in calves administered 7.2% hypertonic NaCI 30 minutes after treatment, whereas total protein concentrations were decreased significantly in hyper-tonic NaCl group at 30 minutes after treatment. The hypertonic saline solution is used to increase plasma volume rapidly in severely dehydrated ruminants (Con-stable 2003a,b).
Lactate and acetate are metabolizable bases and they are found in popular polyionic solutions (lactated Ringer and acetate Ringer). These two substances are predominantly metabolized to bicarbonate, therefore they have an alkalising effect. Acetated Ringer’s tion is theoretically superior to lactated Ringer’s solu-tion because acetate is metabolized faster and alkalini-zation is more rapid. Acetate would not exacerbate D- and L-lactic acidosis (Kasari and Naylor 1985). A disadvantage of commercially available acetated Ring-er’s solutions is that it contains gluconate, which is slowly metabolized by neonatal calves. Despite some disadvantages, the lactated Ringer solution is popular and still widely used by practitioners (Naylor and For-syth 1986, Berchtold 2009). Our results show that bicar-bonate induced a significantly greater increase in the
BE concentration than acetate and lactate. Lactate and acetate do not act as fast as alkaline sodium bicarbon-ate (Berchtold 2009).
The results of the present study showed that the ad-ministration of four treatment groups solutions were similarly effective in improving acid base abnormalities in calves with mild to moderate metabolic acidosis. However, hypertonic sodium-chloride solutions + OES group improved venous acid-base balance and dehy-dration abnormalities at 30 minutes after treatment.
In conclusion, it could be said that administration of 7.2% hypertonic sodium chloride solution in small volumes + OES combinations provided a quick, eco-nomic, practical and effective improvement of ac-id-base and dehydration abnormalities (depending on decreased TP concentrations and increased in plasma volume) within very short time in diarrheic calves with mild to moderate metabolic acidosis.
Acknowledgements
Supported by the Scientific and Technological Re-search Council of Turkey (Project number:113O218). Presented in part in abstract form at the American College of Veterinary Internal Medicine Forum, India-napolis, USA, 2015.
Table 4. Changes in plasma volume in calves given intravenous and oral solution.
Parameters Baseline Time after administration (h)
0th h 0.5th h 1th h 2th h 4th h 6th h 24th h
Group 1 0A 7.53±4.32AB 15.6±3.63AB 26.3±3.58B 19.4±7.94AB 16.4±7.62AB 10.1±6.82AB
Group 2 0 8.07±6.46 14.36±8.01 19.7±7.28 17.1±8.34 27.5±9.20 10.9±7.61
Group 3 0 5.04±4.57 21.1±11.5 22.6±7.61 23.9±11.7 21.0±9.96 6.78±7.04
Group 4 0A 20.0±1.46BC 19.5±3.71BC 25.2±3.37BC 29.3±6.98C 27.3±3.57BC 11.1±3.32AB
Different letters in the same rows (A, B, C) point statistically significant differences (p<0.05). Table 5. Changes in total protein level in calves given intravenous and oral solution.
Parameters Baseline Time after administration (h)
0th h 0.5th h 1th h 2th h 4th h 6th h 24th h
Group 1 6.33±0.34 5.91±0.29b 5.50±0.32b 5.03±0.28 5.38±0.32 5.55±0.41b 5.90±0.44b
Group 2 5.80±0.66 5.45±0.38ab 5.46±0.46b 4.90±0.49 5.00±0.43 4.61±0.42ab 5.24±0.38ab
Group 3 4.90±0.35 4.70±0.19a 4.13±0.18a 4.00±0.14 4.10±0.30 4.11±0.20a 4.60±0.16a
Group 4 5.60±0.19B 4.68±0.18aA 4.70±0.16abAB 4.50±0.21A 4.12±0.27A 4.44±0.24abA 5.06±0.21abAB
References
Batmaz H, Yılmaz Z, Topal A, Görgül OS, Şentürk S (2003) Effects of hypertonic sodium chloride, hypertonic sodium chloride + sodium bicarbonate and hypertonic sodium chloride + ringer’s lactate solution in the treatment of dogs with experimentally induced endotoxaemia. Turk J Vet Anim Sci 27: 339-347.
Berchtold J (1999) Intravenous fluid therapy of calves. Vet Clin North Am Food Anim Pract 15: 505-531.
Berchtold J (2009) Treatment of calf diarrhea: intravenous fluid therapy. Vet Clin North Am Food Anim Pract 25: 73-99.
Constable PD, Gohar HM, Morin DE, Thurmon JC (1996) Use of hypertonic saline-dextran solution to resuscitate hypovolemic calves with diarrhea. Am J Vet Res 57: 97-104. Constable PD, Schmall LM, Muir WW 3rd, Hoffsis GF, Sher-tel ER (1991a) Hemodynamic response of endotoxemic calves to treatment with small volume hypertonic saline solution. Am J Vet Res 52: 981 -989.
Constable PD, Schmall LM, Muir WW 3rd, Hoffsis GF
(1991b) Respiratory, renal, hematologic and serum
biochemical effects of hypertonic saline solution in endo-toxemic calves. Am J Vet Res 52: 990-998.
Constable PD, Walker PG, Morin DE, Foreman JH (1998) Clinical and laboratory assessment of hydration status of neonatal calves with diarrhea. J Am Vet Med Assoc 212: 991-996.
Constable PD (2003a) Fluid and electrolyte therapy in rumi-nants. Vet Clin North Am Food Anim Pract 19: 557-597. Constable PD (2003b) Hyperchloremic acidosis: the classic
example of strong ion acidosis. Anesth Analg 96: 919-922. Constable PD (1999) Hypertonic saline. Vet Clin North Am
Food Anim Pract 15: 559-585.
Constable PD (2002) The treatment of the diarrheic calf: an update. In: Kaske M (ed) Recent developments and per-spectives in bovine medicine. Keynote Lectures of the XXII World Buiatrics Congress, Klinik fur Rinderkrank-heiten, Hannover, pp 132-143.
Coskun A, Sen I, Guzelbektes H, Ok M, Turgut K, Canikli S
(2010) Comparison of the effects of intravenous
adminis-tration of isotonic and hypertonic sodium bicarbonate solutions on venous acid-base status in dehydrated calves with strong ion acidosis. J Am Vet Med Assoc 236: 1098-1103.
Fisher EW, De la Fuente GH (1972) Water and electrolyte studies in newborn calves with particular reference to ef-fects of diarrhoea. Res Vet Sci 13: 315-322.
Groutides CP, Michell AR (1990) Intravenous solutions for fluid therapy in calf diarrhoea. Res Vet Sci 49(3): 292-297. Kasari TR, Naylor JM (1985) Clinical evaluation of sodium
bicarbonate, sodium L-lactate, and sodium acetate for the treatment of acidosis in diarrheic calves. J Am Vet Med Assoc 187: 392-397.
Kasari TR (1999) Metabolic acidosis in calves. Vet Clin North Am Food Anim Pract 15: 473-486.
Koch A, Kaske M (2008) Clinical efficacy of intravenous hy-pertonic saline solution or hyhy-pertonic bicarbonate
solu-tion in the treatment of inappetent calves with neonatal diarrhea. J Vet Intern Med 22: 202-211.
Meganck V, Hoflack G, Opsomer G (2014) Advances in pre-vention and therapy of neonatal dairy calf diarrhoea: a systematical review with emphasis on colostrum manage-ment and fluid therapy. Acta Vet Scand 56: 75.
Nakagawa M, Suzuki K, Takahashi F, Kamikatano K, Koiwa M, Taguchi K (2009) Comparison of the alkalizing effects of bicarbonate precursors in calves with experimentally induced metabolic asidosis. J Vet Med Sci 71: 807-809. Naylor J (1996) Neonatal ruminant diarrhea. In: Smith BP
(ed) Large animal internal medicine, 2nd ed., St Louis, Mosby, pp 396-417.
Naylor JM, Forsyth GW (1986) The alkalinizing effects of metabolizable bases in the healthy calf. Can J Vet Res 50: 509-516.
Perez Garcia J (1999) A practitioner’s views on fluid therapy in calves. Vet Clin North Am Food Anim Pract 15: 533-543. Phillips RW, Lewis LD, Knox KL (1971) Alterations in body
water turnover and distribution in neonatal calves with acute diarrhea. Ann N Y Acad Sci 176: 231-243.
Roussel AJ, Kasari TR (1990) Using fluid and electrolyte replacement therapy to help diarrheic calves. Vet Med (Praha) 85: 303-311.
Sen I, Constable PD (2013) General overview to treatment of strong ion (metabolic) acidosis in neonatal calves with diarrhea. Eurasian J Vet Sci 29: 114-120.
Sen I, Altunok V, Ok M, Coskun A, Constable PD (2009) Efficacy of oral rehydration therapy solutions containing sodium bicarbonate or sodium acetate for treatment of calves with naturally acquired diarrhea, moderate dehydration, and strong ion acidosis. J Am Vet Med Assoc 234: 926-934.
Senturk S (2003) Effects of a hypertonic saline solution and dextran 70 combination in the treatment of diarrhoeic dehydrated calves. J Vet Med A 50: 57-61.
Smith GW (2009) Treatment of calf diarrhea: oral fluid ther-apy. Vet Clin North Am Food Anim Pract 25: 55-72. Suzuki K, Kato T, Tsunoda G, Iwabuchi S, Asano K, Asano R
(2002) Effect of intravenous infusion of isotonic sodium
bicarbonate solution on acidemic calves with diarrhea. J Vet Med Sci 64: 1173-1175.
Suzuki K, Ajito T, Iwabuchi S (1998) Effect of a 7.2% hyper-tonic saline solution infusion on arterial blood pressure, serum sodium concentration and osmotic pressure in nor-movolemic heifers. J Vet Med Sci 60: 799-803.
Trefz FM, Lorch A, Feist M, Sauter-Louis C, Lorenz I (2012) Metabolic acidosis in neonatal calf diarrhea-clinical findings and theoretical assessment of a simple treatment protocol. J Vet Intern Med 26: 162-170.
van Beaumont W, Greenleaf JE, Juhos L (1972) Dispropor-tional changes in hematocrit, plasma volume, and proteins during exercise and bed rest. J Appl Physiol 33: 55-61. Walker PG, Constable PD, Morin DE, Foreman JH, Drackley
JK, Thurmon JC (1998) Comparison of hypertonic saline-dextran solution and lactated Ringer’s solution for resuscitating severely dehydrated calves with diarrhea. J Am Vet Med Assoc 213: 113-121.