180
/
lQEC'98
/
THURSDAY AFTERNOON
2-m-diameter beams from an He-Ne and/or ar- gon-ion laser and two types of samples: (a) micro- scope cover-glass plates of 150 pm thickness and (b) Fabry-Perot plates of 0.5 mm thickness. The only difference between samples (a) and (b) was that, whereas the Fabry-Perot plates had only SSR with rms height h, the ordinary glass plates con- tained the same size SSR with the addition of LSR with rms height U. The LSR is a consequence of the deviation from perfect planarity of the glass surface, which was measured to be an average of 0.01-0.1 pm, on a horizontal scale of order 1 mm. The pres- enceofLSRofthissizeadded -10-50% tothetotal rms height of roughness, h, F= ( hz
+
2)
"',
which means that in both cases, h, remains the same order of magnitude (much smaller than the wavelength A). The measured scattered intensity from the two samples, however, showed completely different far- field interference pattems. In the pattems obtained from the Fabry-Perot plate, the positions of inter- ference rings are independent of the angle of inci- dence,ern.
Their brightness, however, oscillates pe- riodically ase,, is varied (Figs. la and lb). In stark
contrast, in the ring pattem obtained from the or- dinary glass plates, the position ofthe rjngs depends on the OZn. In fact, one of the bright rings (an inter- ference m a x i " ) remains attached to the specu- lar reflection direction, and both move with nearly constant brightness as the 6,, changes (Figs. IC and Id).A comparison of the measured scattered dis- tribution with one calculated in the first Bom approximation* shows that there is a good quan- titative agreement with the measurements of the scattered intensity from the slightly rough Fabry- Perot plates, but it completely differs from the intensity distribution observed in the experi- ments with ordinary glass plates.
To obtain agreement with the experiment, we had to take into consideration that the ef- fect of LSR is actually twofold it scatters light at small angles 8,
-
h/L, and it destroys the phase coherence of successive reflections dur- ing the propagation of the singly scattered waves inside the dielectric layer. We have ob- tained an explicit expression for the scattered intensity distribution that describes quantita- tively the results of both series of experiments. In conclusion, the scattering diagram from a slightly rough dielectricfilm
is extremely sensi- tive to long-scale corrugations of the interface. Even very small, smooth deviations of the aver- age surface of a slightly rough layer from a perfect plane that do not affect the total rms roughness drastically change the interference pattern. 1. T. Young, Philos. Trans. R. Soc. London Part1, 41 (1802); G. Stokes, Trans. Cambridge Philos. Soc. 9,147 (1851); C.V. Raman, G.L. Datta, Philos. Mag. Ser. 6, 42, 826 (1921); A.J. de Witte, Am. J. Phys. 35,301 (1967). V. Freilikher, M. Pustilnik, I. Yurkevich, Opt. Lett. 19, 1382 (1994).
2.
QThG6
Fabry-Perot-type resonances in metallic photonic crystals
Ali Serpengiizel, Kerim Savran, Department of Physics, Bilkent University, Bilkent, Ankara 06533, Turkey
Metallicphotoniccrystals (MPCs) with face-cen- tered tetragonal (FCT) lattice composed ofrods'
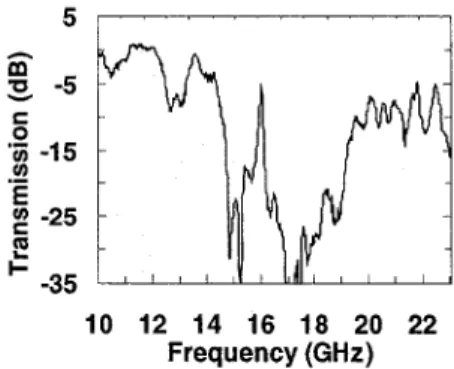
and metallodielectric photonic crystals with face- centered cubic (FCC) lattice composed of spheres2 have already been investigated at micro- wave frequencies. In our experiments, we inves- tigated an MPC in the microwave regime. The MPC has an FCC Bravais lattice composed of steel spheres, with diameter d = 0.635 cm. The lattice was formed along the (100) direction by stacking altemating layers of spheres. One layer consists of spheres packed as shown in Fig. 1, which depicts the (001) plane (top view) of the MPC. Our MPC consisted of 11 layers or five- unit cells. The lattice constant was a = 1.5 cm. The supporting dielectric material was air-doped polystyrene with a refractive index n = 1.16. Such a low refractive index for the supporting dielectric material allowed LE to realize the first, to our knowledge, MPC with its spheres almost floating in the air. Figure 2 shows the transmis- sion spectrum through the MPC along the (100) crystal direction. The lower edge ofthe stop band starts at 13.0 GHz. The center frequency for the stop band is at 17.25 G H s which compares fa- vorablywith the normal (0 = 0") incidence Bragg condition frequency. The upper edge of the stop band is at 21.5 GHz. Therefore, the width of the stopband is 50% of the center frequency, which makes our MPC suitable for microwave applica- tions. Ignoring the oscillations, the maximum rejection at the band center is 35
dB,
correspond- ing to a rejection of 7dB
per unit cell.One aspect oftheMPC is noteworthy the trans- mission below and above the stop band is unity. This is quite remarkable for an MPC considering that a metallic surface would have reflected 99.97% of the incident radiation in the given microwave frequency range.
We also studied the effect of the incidence angle on the transmission of the MPC. Figure 2
d - ? ?
QThG6 Fig. 1. Top view of the (001)-ori- ented face of the MPC.
B
s
-53
-152
-25E
I--35
C 0.-
'il:
10 12 14 16 18 20 22 Frequency (GHz) QThG6 Fig. 2. Normal 0" (100) (thin solid line) and 45' (110) (thick solid line) incidence transmission through the MPC.10 12 14 16 18 20 22
Frequency (GHz) QThG6 Fig. 3. Normal 0" (100) incidence transmission through the MPC with the gap in the middle.
shows the transmission spectrum through the MPC along the (1 10) crystal direction. For the (1 10) direction, the center frequency is at 24.3 GHz, which is close to the limit of our detec- tion range. The PBG shifts toward higher fre- quencies, as expected from the Bragg condi- tion on the center frequency.
We later measured the transmission properties of the MPC with the Fabry-Perot-type cavity reso- nator. The separation distance is set to be L = 1.75
cm between the 2 parts (mirrors) of the MPC. Fig- ure 3 shows the transmission spectrum of the MPC atlowspectralresolutionandalongthe (100) crystal direction. The spectrum in Fig. 3 is similar to the
full
MPC spectrum of Fig. 2, except for the Fabry- Perot-type mode. This is the 6rst measurement, to OUT knowledge, of such a mode
within
an MPC composed of metallic spheres. The Fabry-Perot- typemode hasalinewidthof0.08 GHzandaquality factor of 200. The Fabry-Perot-type mode fre- quency of 16.02 GHz compares favorably with the resonance condition ofv,,
= d4.rrLn (2mn - +),where m is the mode number, and
+
is the total reflection phase of the two mirrors.3 From the fre- quency of the resonance, the mode number is found to be m = 3 and the total reflection phase of the two mirrors c$ = 300'.We acknowledge the partial support of this research by the Scientific and Technical Re- search Council of Turkey (TUBITAK) grant no. TBAG-1368.
1. E. Ozbay, B. Temelkuran, M. Sigalas, G. Tuttle, C.M. Soukoulis, K.M. Ho, Appl. Phys. Lett. 69,3797 (1996).
E.R. Brown, O.B. McMahon, Appl. Phys. Lett. 67,2138 (1995).
E. Ozbay, B. Temelkuran, Appl. Phys. Lett. 69,743 (1996).
2. 3.
QThG7
Nonlinear propagation of an optical beam in polymer waveguide with upconverted photobleaching
S.S. Sarkisov, C. Banks, A. Wilkosz,* B. Penn,** Department oflvatural and Physical Sciences, Alabama AehM University, P.O. Box 1268, Normal Alabama 35762-1268; E-mail: sergei@caos. aamu.edu
Self-controlled optical-beam steering in non- linear optical media has been intensively stud- ied over the last three decades.'J We show that refractive-index decrease on upconverted