T.C.
BIRUNI UNIVERSITY
INSTITUTE OF GRADUATE EDUCATION
DEPARTMENT OF MOLECULAR BIOLOGY AND GENETICS MOLECULAR AND MEDICAL GENETICS GRADUATE PROGRAM
REAL-TIME IMAGING OF NITRIC OXIDE (NO) SIGNALS
DERIVED FROM DIFFERENTIALLY TARGETED
ENDOTHELIAL NITRIC OXIDE SYNTHASES (eNOS) USING
GENETICALLY ENCODED BIOSENSORS
Mete Emir ÖZGÜRSES
ADVISOR
Asst. Prof. Dr. Emrah EROĞLU
T.C.
BIRUNI UNIVERSITY
INSTITUTE OF GRADUATE EDUCATION
DEPARTMENT OF MOLECULAR BIOLOGY AND GENETICS MOLECULAR AND MEDICAL GENETICS GRADUATE PROGRAM
REAL-TIME IMAGING OF NITRIC OXIDE (NO) SIGNALS
DERIVED FROM DIFFERENTIALLY TARGETED
ENDOTHELIAL NITRIC OXIDE SYNTHASES (eNOS) USING
GENETICALLY ENCODED BIOSENSORS
Mete Emir ÖZGÜRSES
ADVISOR
Asst. Prof. Dr. Emrah EROĞLU July, 2020
III
DECLARATION
I declare that I have designed and performed all experiments in the current study entitled “Real-time imaging of nitric oxide (NO) signals derived from differentially targeted endothelial nitric oxide synthases (eNOS) using genetically encoded biosensors” according to good scientific practices. I obtained all the information contained in this thesis under academic and ethical rules. All the information I have used from secondary literature has been respectively referenced. I also declare that have not violated any patents and copyrights during the preparation and writing of this thesis.
IV
V
ACKNOWLEDGEMENT
I would like to express my deepest gratitude to everyone who has supported me through this thesis.
Firstly, I would like to thank Asst. Prof. Emrah Eroğlu for allowing me to work in his lab. He has guided me throughout the project both by challenging me to be more competent in science and by sharing his instructive ideas. His experience and dedication to science have opened me new perspectives on both the psychological and emotional levels, which has pushed me more to always strive for a better.
My sincere thanks also go to my co-advisor, Asst. Prof. Elif Sibel Aslan who has supported me through my master thesis. Her continuous support throughout my education gave me the courage to try more and succeed and guided me to be a better scientist candidate.
I would also like to thank my lab mates, Yusuf Ceyhun Erdoğan, Serap Sezen, Hamza Yusuf Altun, Gülşah Sevimli, and Büşra Nur Ata for always supporting each other in any way and creating a friendly and collaborative environment in our lab to drive science forward.
Lastly, I would like to show my deepest gratitude to my family for their endless support and love.
VI
TABLE OF CONTENT
DECLARATION ... III ACKNOWLEDGEMENT ... V ABBREVIATIONS ... VIII LIST OF TABLES ... X LIST OF FIGURES ... XI TURKISH ABSTRACT and KEYWORDS ... XII ABSTRACT and KEYWORDS ... XIII1. INTRODUCTION and PURPOSE ... 1
2. GENERAL INFORMATION ... 3
2.1 The Glorious History of Nitric Oxide ... 3
2.2 Biosynthesis of NO ... 5
2.3 Genetically Encoded Fluorescent Biosensors ... 8
2.3.1 Genetically Encoded Calcium Indicators ... 14
2.3.2 Genetically Encoded Nitric Oxide Biosensors ... 16
3. MATERIALS and METHODS ... 20
3.1 Molecular Cloning ... 20
3.2 Cell Culture ... 21
3.3 Buffer Solutions ... 22
3.4 Fluorescence Imaging and Image Analysis ... 23
3.5 Statistical Analysis ... 25
4. RESULTS ... 26
4.1 Characterization of G-geNOps and O-geNOps in Responses to Exogenously Applied NO in Single Human Embryonic Kidney Cells ... 26
4.2 Intracellular Calcium Imaging Using Genetically Encoded Calcium Indicators – The -GECOs ... 29
4.3 Visualizing Intracellular NO Production Derived from Differentially Localized eNOS ... 33
VII
5. DISCUSSION, CONCLUSION, and RECOMMENDATIONS ... 39
5.1 Discussion ... 39 5.2 Conclusion ... 41 5.3 Recommendations ... 41 6. REFERENCES ... 42 7. CURRICULUM VITAE ... 55 8. PLAGIARISM REPORT ... 57
VIII
ABBREVIATIONS
B-GECO: Blue variant of Genetically Encoded Ca2+ Indicators for Optimal imaging
BFP: Blue Fluorescent Protein
Ca2+: Calcium
CaM: Calmodulin
Cav-1: Caveolin-1
CFP: Cyan Fluorescent Protein
cGMP: Cyclic Guanosine Monophosphate
cpEGFP: Circularly Permuted Enhanced Green Fluorescent Protein cpFPs: Circularly Permuted Fluorescent Protein
DAF: Diamino Fluorescein
deGFP: Dual-Emission Green Fluorescent Protein DEPC water: Diethylpyrocarbonate treated water DMEM: Dulbecco’s Modified Eagle Medium
DMSO: Dimethylsulphoxide
EDFR: Endothelial-Derived Releasing Factor eNOS: Endothelial Nitric Oxide Synthase
ER: Endoplasmic Reticulum
FAD: Flavin Adenine Dinucleotide
FMN: Flavin Mononucleotide
FP: Fluorescent Protein
FRET: Fluorescent Resonance Energy Transfer FRET-MT: FRET-based biosensor containing hMTIIa
GABA: Gamma-Aminobutyric Acid
GAF: sGC Activating Factor
GEB: Genetically Encoded Biosensors
GECO: Genetically Encoded Ca2+ Indicators for Optimal imaging geNOps: Genetically Encoded NO probes
GFP: Green Fluorescent Protein
hMTIIa: Human Type IIa Metallothionein iNOS: Inducible Nitric Oxide Synthase IP3: Inositol 1,4,5-Triphosphate
IX
LB agar: Lysogeny Broth agar LED: Light-Emitting Diots
MNNG: N-methyl-N'-nitro-N-nitrosoguanidine
NADPH: Nicotinamide adenine dinucleotide phosphate NasS: Nitrate Assimilation System gene, S subunit NasT: Nitrate Assimilation System gene, T subunit
Nitrate: NO3–
Nitrite: NO2–
nNOS: Neuronal Nitric Oxide Synthase
NO: Nitric Oxide
NOA-1: A Fluorescence Indicator for NO with a Signal Amplifier Noc-7: 3-(2-Hydroxy-1-methyl-2-nitrosohydrazino)-N-methyl-1-propanamine
NorR: NO Reductase Transcription Regulator NOS: Nitric Oxide Synthase
NOSIP: Nitric Oxide Synthase Interacting Protien
O-geNOp-NES: Orange variant of geNOps tagged with Nuclear Excision Sequence
OFP: Orange Fluorescent Protein Peroxynitrite: ONOO
-R-GECO: Red variant of Genetically Encoded Ca2+ indicators for optimal imaging
R-GECO-UT: Red variant of Genetically Encoded Ca2+ indicators for optimal imaging- untargeted
RFP: Red Fluorescent Protein sGC: soluble guanylyl cyclase
sNOOpy: Sensor for NO3−/NO2− in physiology
WT-eNOS: Wild-Type endothelial Nitric Oxide Synthase YFP: Yellow Fluorescent Protein
X
LIST OF TABLES
XI
LIST OF FIGURES
Figure 2.1: Schematic representation of eNOS in physiological conditions ... 7
Figure 2.2: 3D representation of homodimer eNOS with its interacting proteins and co-factors ... 8
Figure 2.3: 3D representation of the Green Fluorescent Protein (GFP) ... 9
Figure 2.4: Schematic representation of the mechanism of light emission by aequorin upon activation with Ca2+ ... 9
Figure 2.5: Schematic representation of FRET-based sensors ... 12
Figure 2.6: Schematic representation of translocation based single FP probes ... 13
Figure 2.7: Schematic representation of Intensiometric and ratiometric single FP biosensors ... 14
Figure 2.8: 3D representation of R-GECO and B-GECO ... 16
Figure 2.9: 3D protein structure of Intensiometric geNOps ... 19
Figure 2.10: 3D protein structure of ratiometric geNOps ... 19
Figure 3.1: Vector maps of red tagged eNOS variants ... 21
Figure 3.2: Vector maps of R-GECOs ... 21
Figure 3.3: Schematic representation of gravity-based perfusion system ... 24
Figure 4.1: Transfection efficiency of cytosolic targeted and untargeted geNOps .... 26
Figure 4.2: Representative time course of exogenously applied NOC-7 signals in HEK293 cells ... 27
Figure 4.3: Co-imaging of eNOS-GFP and O-geNOps ... 28
Figure 4.4: Co-imaging of eNOS-RFP and G-geNOps ... 28
Figure 4.5: Calcium Imaging in HEK293 cells using R-GECOs ... 30
Figure 4.6: Comparison of nuclear Ca2+ signals ... 31
Figure 4.7: Calcium imaging in different subcellular locales with GECOs ... 32
Figure 4.8: Calcium signals in the cytosol and nucleus upon intracellular Ca2+ mobilization ... 33
Figure 4.9: Co-transfection of HEK293 cells with G-geNOp and differentially targeted eNOS RFP variants ... 34
Figure 4.10: Co-imaging of NO with differentially targeted eNOS ... 35
Figure 4.11: Co-imaging of NO with differentially targeted eNOS ... 36
Figure 4.12: Co-imaging of NO with Wild Type eNOS ... 37
XII
TURKISH ABSTRACT and KEYWORDS
Nitrik oksit (NO), makrofaj, nöron ve endotel hücreleri dahil birçok farklı hücre tiplerinde üretilen gaz halindeki bir moleküldür. Endotelyal hücrelerde NO, düz kas hücrelerinin gevşemesini ve vasküler tonunun düzenlediği bilinen kalsiyum bağımlı endotelyal nitrik oksit sentaz (eNOS) tarafından üretilir. Fizyolojik koşullarda, eNOS hücre zarındaki kaveolada lokalizedir genellikle protein-protein etkileşimleri nedeniyle aktif değildir. eNOS’un hücre içi farklı bölmeleri arasındaki translokasyonun NO üretimini etkileyebileceği de gösterilmiştir. Bununla birlikte, literatürdeki ilgili çalışmaların çoğunda, uygun araçların bulunmaması nedeniyle lokal eNOS kaynaklı NO biyoyararlanımı araştırılamamıştır. Bu diploma tezinde NO ve Ca2+ için yeni multispektral görüntüleme tekniklerinden yararlanılarak bu konu gözden geçirilmiştir. Bu amaçla, yüksek mekân-zamansal çözünürlük ve yüksek seçicilik ile canlı hücrelerde NO tespiti sağlayan yeni genetik olarak kodlanmış NO sensörü (geNOps) kullanılmıştır. Lokal Ca2+ sinyallerinin görselleştirilebilmesi için GECO' ların kırmızı ve farklı hedefli varyantları kullanılmıştır. Farklı hücresel lokallerde eNOS aktivitesini incelemek için HEK293 hücreleri model sistem olarak kullanılarak yabani tip (wild type)-eNOS ile nükleer hedefli eNOS karşılaştırılmıştır. Her iki bölmede de eNOS’un aktivasyonu için gerekli olan Ca2+ sinyalleri tespit edilmiştir. Bu yaklaşım, çekirdekteki eNOS aktivitesinin, aynı deney koşulları altında yabani tip-eNOS'a kıyasla önemli ölçüde azaldığını, ancak yine de aktif olduğunu açıkça gösterilmiştir. Bu tezde, farklı hücre içi lokallerdeki eNOS aktivitesi farklılıklarını ortaya çıkarmak amacıyla multispektral görüntüleme tekniklerinden yaralanılmıştır ve lokal Ca2+ ortamının eNOS aktivitesindeki farklılıkları etkilemediği ilk kez, doğrudan kanıtlanmıştır.
Anahtar Kelimeler: Endotel nitrik oksit sentaz, Genetik olarak kodlanmış biyosensörler, Nitrik Oksit
XIII
ABSTRACT and KEYWORDS
Nitric oxide (NO) is a gaseous molecule produced in many different cell types, including macrophages, neurons, and endothelial cells. In endothelial cells, NO is produced by the calcium-dependent endothelial nitric oxide synthase (eNOS), which is known to regulate smooth muscle cell relaxation and vascular tone. Under physiological conditions, eNOS is localized to the caveolae in the cell membrane and is generally inactive due to protein-protein interactions. It has also been shown that translocation between different compartments of eNOS inside the cell can affect NO production. However, in most of these studies the local eNOS derived NO bioavailability could not be studied due to the lack of proper tools. In this diploma, issue by exploiting novel multispectral imaging techniques for NO and Ca2+ was revisited. For this purpose, the novel genetically encoded NO sensor (geNOps), which provides NO detection in living cells with high-spatial and temporal resolution and high selectivity, was used. To visualize local Ca2+signals the well-established red-shifted and differentially targeted variants of the GECOs was exploited. To study eNOS activity in different cellular locales, HEK293 cells was used as a model system and compared wild type-eNOS versus nuclear-targeted eNOS. In both compartments, Ca2+ signals required for eNOS activation was detected upon stimulation. This approach clearly showed that eNOS activity in the nucleus is significantly reduced but still active compared to the wild type-eNOS under the same experimental conditions. In this master thesis, multispectral imaging techniques was used to unveil differences in eNOS activity in different subcellular locales. This master thesis provided for the first-time direct evidence that the local Ca2+ environment does not dictate differences in endothelial nitric oxide synthase activity.
Keywords: Endothelial nitric oxide synthase, Genetically encoded biosensors, Nitric Oxide
1
INTRODUCTION and PURPOSE
NO is one of the most studied molecules in biology (Hukkanen et al., 1998), documented by approximately 7000 published papers per year according to the PubMed database. NO can be found in all three domains of life and is probably the most versatile molecule in nature. In mammalian cells, NO can be synthesized by specialized enzymes called nitric oxide synthases (NOS). Three isoforms belong to the NOS family, which are found in different tissues. These are the endothelial NOS (eNOS), neuronal NOS (nNOS), and inducible NOS (iNOS) (Tegeder, 2019). All isoforms are Ca2+-dependent, however, due to the high affinity of iNOS to the Ca2+/Calmodulin complex, this isozyme seems to be constitutively active. In the current study, we focused on in particular on the function of the endothelial NOS isoform, which is predominantly located in caveolar regions of the cell membrane (W. Su et al., 2016). eNOS is tightly regulated by different cofactors, proteins, and post-transcriptional modifications to prevent its activation upon stimulation with molecules other than Ca2+. Interacting proteins such as Caveolin-1 (Cav-1) (Lei, Song, Wu, Xing, & Sun, 2016) and NOS interacting protein (NOSIP) (Nakamura, Zimmer, Friedmacher, & Puri, 2019) control deactivation of eNOS and reduces the NO production. Other proteins such as calmodulin (CaM) (Porter, Jang, Haque, Stuehr, & Mehl, 2020) and heat shock protein (Hsp90) (Averna et al., 2008), initiates a conformational change in eNOS, thus activate NO production. However, due to the extremely short half-life of NO, which is less than a second under ambient conditions (Thomas, Liu, Kantrow, & Lancaster, 2001), it has been a challenge to real-time detect NO concentration changes on cellular levels. Exploiting the physical and chemical properties of NO, many different techniques have been developed for NO detection (Hogg, Zielonka, & Kalyanaraman, 2017). One of the most prominent and still widely used techniques is the Griess assay which permits the concentration determination of stable byproducts of NO (Schmölz, Wallert, & Lorkowski, 2017), the enzymatic based citrulline assay (Combet, Balligand, Lameire, Goffin, & Devuyst, 2000), and fluorescent-based diamino fluorescein (DAF) dyes (Zhou & He, 2011). However, all these golden standard techniques bear serious limitations such as indirect NO measurement, low sensitivity and selectivity, toxicity, and the limitation of NO measurement in whole cell populations. Only the DAF imaging method permits
single-2 cell imaging in real-time, however, due to the less selectivity to NO, irreversibility, and non-targetability, these chemical probes turned to be less suitable for subcellular NO imaging in living cells. Thus, owing to the lack of proper imaging tools, the direct NO production derived from eNOS in sub localizations has not been studied yet. In a recent advance in the field of genetically encoded NO biosensors, a novel NO sensor has been developed, termed as geNOps, permit for the first time real-time imaging of NO levels in subcellular levels in a simultaneous manner (Eroglu et al., 2018).
In this current study, we addressed this timely issue: exploiting this powerful imaging tools we are investigating for the first time the complex biochemistry of differentially targeted eNOS. For this purpose, we particularly studied the functionality of eNOS in the nucleus by specifically targeting the enzyme to this locale and compare it NO synthesis capacity in comparison to the WT-eNOS. Thus, we test the hypothesis that differential targeting of the eNOS affects the NO formation activity of the enzyme.
3
GENERAL INFORMATION
2.1 The Glorious History of Nitric Oxide
Nitric Oxide (NO) was identified as a hydrophobic, colorless gas, and was named as “Nitrous Air” by Joseph Priestly in 1772 (Smith, 1965). Not earlier than four decades ago, Murad et al. showed that different NO donors, such as nitroprusside and nitroglycerin, increase the levels of the secondary messenger cyclic GMP (cGMP) in rat liver and bovine tracheal smooth muscle (Katsuki, Arnold, Mittal, & Murad, 1977). Gruetter et al. treated bovine coronary artery with nitroprusside, N-methyl-N'-nitro-N-nitrosoguanidine (MNNG) and NO, and observed a relaxation effect of the vascular smooth muscle cells, which again gave reason to believe that NO might be a vasodilator (Gruetter et al., 1979) However, still the direct function of NO in living organisms was not yet identified (Yetik-Anacak & Catravas, 2006). Furchgott and Zawadzki also studied the vasorelaxation effect of NO in 1980. They treated vessels with acetylcholine and observed the production of an unstable, diffusible compound which they referred to as an endothelium-derived relaxing factor (EDRF). Without being aware that the EDRF they have discovered, which causes the relaxation of vascular smooth muscle cells is NO (Furchgott & Zawadzki, 1980). A few years later, in 1987, finally, EDFR was proven to be NO, simultaneously by two research groups; Ignarro et al., from UCLA and Palmer et al. from Wellcome Research Laboratories in the UK (Bruckdorfer, 2005). These findings opened new avenues in the field of NO biochemistry and the importance of NO in the medical fields. For their discoveries, in 1998, Murad, Furchgott, and Ignarro were awarded the Nobel Prize in physiology and medicine. It is worth mentioning that Salvador Moncada, who also independently discovered NO these days was not honored with the Nobel Price due to his origin and political reasons (Palmer, Ferrige, & Moncada, 1987). On the other hand, other groups were studying the same mechanism in different tissues. In 1977, Takeo Deguchi from the Tokyo metropolitan institute of neurosciences found soluble-guanylate cyclase (sGC), which is a direct receptor of NO (Martin, Berka, Tsai, & Murad, 2005), activity in the rat brain's mitochondria. Further, in 1982, Deguchi and Yoshioka have also identified L-arginine as the endogenous activator of sGC (Deguchi, 1977; Deguchi & Yoshioka, 1982). After identifying the L-arginine as an endogenous activator of sGC, in 1988, Garthwaite et al. have found glutamate increases cGMP and created a similar
4 profile as EDFR acting on N-methyl D-aspartate (NMDA) receptors (Garthwaite, Charles, & Chess-Williams, 1988). Later, it was found that the NMDA receptor stimulates NO formation from L-arginine, thus specifying the presence of NO in brain tissue (Garthwaite, Garthwaite, Palmer, & Moncada, 1989).
In 1985, Stuehr et al. found that T-lymphocyte mediated activation of macrophages were able to produce huge amounts of nitrate/nitrite and concluded that NO might have cytotoxic functions in these cell types. In 1987, Hibbs et al. have found the activated CAMs are dependent on the L-arginine deiminase, which results in oxidation of NO to nitrite (Hibbs, Taintor, & Vavrin, 1987). Later in 1988, Hibbs team have intraperitoneally infected C3H/HeN mice with Bacillus Calmette Guerin, and stimulated macrophages were found to produce NO upon exposure to the virus. (Hibbs, Taintor, Vavrin, & Rachlin, 1988). These findings have documented the baseline for NO studies on the molecular level.
In the last decades, NO has found to be an essential, versatile signaling molecule in cancer progression (Muntané & De la Mata, 2010). Production of NO in cancer cells possess both anti-tumor and pro-tumorigenic effect (Zou et al., 2020). NO concentrations slightly above the physiological condition promote metastasis and tumor progression, while much higher levels of NO suppresses the metastasis (Vahora, Khan, Alalami, & Hussain, 2016). Due to the similarity between the cancer microenvironment and local inflammation (Q. Lin et al., 2018), both conditions increase the NO production by migrated immune cells. An inevitable increase in the production of NO creates a favorable environment for tumor initiation and progression by increasing angiogenesis through arterial vasodilation (Tran, Porrini, & Ramarao, 2020). In contrast, many studies have also shown the overproduction of NO can reduce cancer cell proliferation in vivo and in vitro (Burke, Sullivan, Giles, & Glynn, 2013), thus suggesting the phenomenon of 'NO the Doubled-Edged Sword' in cancer (Xu, Liu, Loizidou, Ahmed, & Charles, 2002).
The use and production of NO are not confined to animal species. The ability to engage with the atmospheric NO has been known for both plants and bacteria (Berger, Boscari, Frendo, Brouquisse, & Foyer, 2019). The presence of cGMP in plants was first shown by mass spectroscopy and further NO treatment experiments
5 have also revealed that NO can induce cGMP in plants (Brown & Newton, 1992). Administration of NO to tobacco plant triggered the production of defense genes like pathogenesis related-1 (Hausladen & Stamler, 1998) and depletion of NO has decreased the growth of tobacco plant (Nejamkin et al., 2020). Furthermore, NO was also found to trigger cell death in plants (Locato, Paradiso, Sabetta, De Gara, & de Pinto, 2016). In bacteria, NO has been known to have both protective and metabolic adaptation effects. NO produced from Bacillus anthracis provides resistance for oxidative stress generated from macrophages (Shatalin et al., 2008), and NO from Staphylococcus aureus contributes to survival against neutrophils (Vaish & Singh, 2013). Also, S. aureus increases the production of NO under oxygen-deprived conditions and shifts the metabolism from aerobic to nitrogen-based respiration, providing adaptation (Kinkel et al., 2016). Overall, original studies since the discovery of NO back in the late 80s taught us that NO can be found in all organisms as a different actor. It is also hard to find a disease, which is not related to NO alterations. The understanding of the complex biochemistry of NO is still an ongoing process and mysteries related to this tiny radical are by far not discovered yet.
2.2 Biosynthesis of NO
NO can be produced in many cells throughout the body, such as macrophages, Kupffer cells, astrocytes, neutrophils, monocytes, neurons, endothelial cells, and cancer cells (Ignarro, 2009). Each cell type can synthesize NO by different NOS isoenzyme family (Lidington, Li, & Tyml, 2007). To date, there have been three types of NOS identified, depending on the type and function in the cells (Govers & Rabelink, 2001). The neuronal NOS (nNOS or NOS1) occurs predominantly in the neuro-system, in skeletal muscles, and permits synaptic plasticity (Kovacs, Cai, & Larson, 2001). The endothelial NOS (eNOS or NOS3) is expressed in endothelial cells and produces NO as a vasodilator to relax the vascular smooth muscle cells (Hong et al., 2019). Both NOS3 and NOS1 are constitutively active and calcium/calmodulin-dependent (Tousoulis, Kampoli, Tentolouris Nikolaos Papageorgiou, & Stefanadis, 2012). The inducible NOS (iNOS or NOS2), however, is mainly expressed in immune cells and its constantly active (Du & Geller, 2010).
NO has an important effect on wound healing, development of immune response against infection, neurotransmission, and relaxation of smooth muscle cells
6 (Vallance & Collier, 1994). Usually, endothelial cells produce NO for vasodilation of smooth muscle cells. Upon scar formation, NO is eliminated by the excessive reactive oxygen species produced at the wound area, thus, NO from the other endothelial cells creates a favorable environment for guiding the platelets to the wound area and initiates the wound healing process (Malone-Povolny, Maloney, & Schoenfisch, 2019). In the inflammation phase of wound healing, NO has been found to increase to its peak one day after the injury, and decrease as the healing process continues (Han et al., 2012). NO is also linked with the protection against pathogens in mammals. Upon viral infection, iNOS is found to be activated due to interferon-γ leading to NO overproduction (Akaike & Maeda, 2000). Furthermore, in different studies, it has been shown that the mice lack the iNOS gene is more susceptible to viral infections, indicating the importance of both normal immunity and fighting against viral and bacterial pathogens (Barros et al., 2019) (Akaike, 2000).
In the nervous system, nNOS has been found in nervous related tissues including, hypothalamus, pineal gland, brain, and spinal cord and NO is a crucial messenger in the central nervous system (Džoljić, Grabatinić, & Kostić, 2015). nNOS is dependent to the NMDA receptor to function (Dagdeviren, 2017). Glutamate that is released from the pre-synaptic neuron increases the influx of Ca2+ in post-synaptic neurons and leads to the direct activation of nNOS, which is anchored to NMDA with post-synaptic density protein, and initiates NO production (Calabrese et al., 2007; Ghasemi, Claunch, & Niu, 2019). The produced NO can diffuse back to the pre-synaptic neuron to activate the sGC (Reis, Albuquerque, Maron‐Gutierrez, Silva, & Neto, 2017). The activated sGC converts GTP to cGMP in the pre-synaptic neuron, and functions in different mechanisms. For example, cGMP inhibits the activity of gamma-aminobutyric acid-mediated transmission and activation of a synaptic vesicle glycoprotein that functions in the fusion of vesicles released from pre-synaptic neuron (Bidmon et al., 2006; Wang, Mergia, Koesling, & Mittmann, 2017).
In the endovascular system, NO is produced by eNOS. The functional state of eNOS is a homodimer located at caveolae regions on the cell cytoplasm and interacts with a well-known eNOS inhibitor Cav-1 protein. Each monomer of eNOS contains N-terminal oxygenase and C-terminal reductase regions. When ligands such as Ca2+ agonists, histamine and ATP, binds to the G-protein coupled receptor (GPCR) (Eroglu,
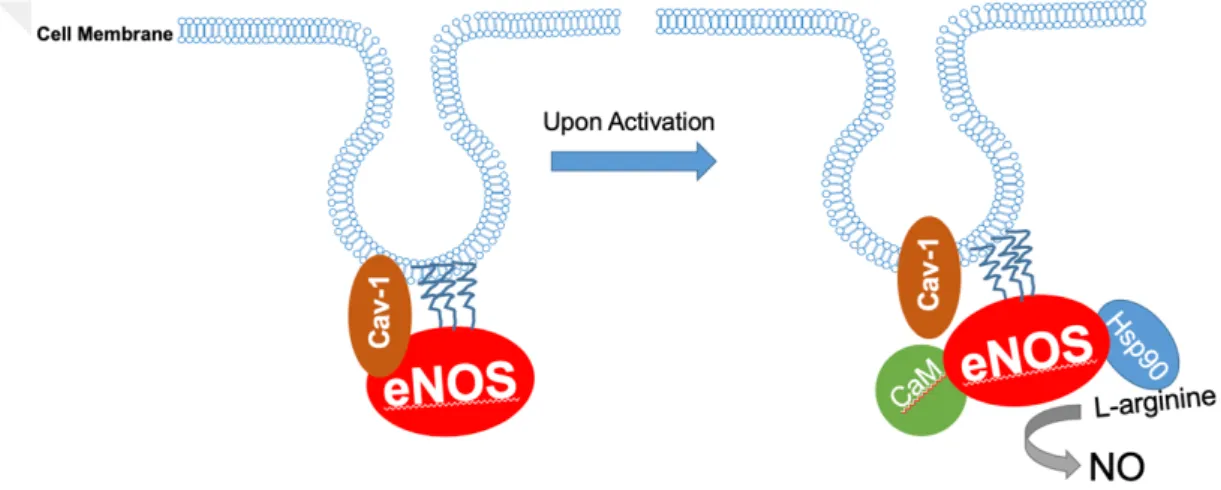
7 Saeedi Saravi, Sorrentino, Steinhorn, & Michel, 2019; Sriram, Laughlin, Rangamani, & Tartakovsky, 2016), it activates Phospholipase C, which hydrolyzes phosphatidylinositol 4,5-bisphosphate and generates inositol 1,4,5-triphosphate (IP3) and diacylglycerol (Billups, Billups, Challiss, & Nahorski, 2006). The IP3 further binds to the IP3 receptor located at the surface of the endoplasmic reticulum (ER) and initiates the Ca2+ release from ER (Nakayama et al., 2010). Released Ca2+ activates calmodulin (CaM), which is an important protein to start NO production. Activated CaM binds to its target on eNOS with heat shock protein 90 (Hsp90) (Figure 2.1) (Z. Chen et al., 2018; Y. Su, 2014), disassociates Cav-1, leading to the alignment of the oxygenase and reductase regions of eNOS (Shu et al., 2015).
Figure 2.1: Schematic representation of eNOS in physiological conditions. The inactive state of eNOS is co-localized with Cav-1 protein at caveolae. Upon activation, eNOS interacts with the active state of CaM and Hsp90 Proteins and
produces NO from L-arginine.
The conformational change permits the electron transfer donated from nicotinamide adenine dinucleotide phosphate (NADPH) flow to flavin adenine dinucleotide (FAD), flavin mononucleotide (FMN), and finally to Heme group (Gliozzi et al., 2019). Oxidized heme group, triggers NO production from L-Arginine and oxygen (Figure 2.2). (Rafikov et al., 2011). NO produced from the endothelial cell can easily diffuse into smooth muscle cells and stimulates sGC (Melichar et al., 2004), which initiates the production of cGMP. cGMP in smooth muscle cells activates vasodilation and inhibits inflammation, apoptosis, remodeling, and platelet formation (Stasch, Pacher, & Evgenov, 2011).
8 Figure 2.2: 3D representation of homodimer eNOS with its interacting proteins and co-factors (Shu et al., 2015). Upon stimulation with Ca2+, the eNOS homodimer is able to accept an electron from NADPH. The received electron shifts through FAD and FMN regions until the heme group. When the heme group is reduced with the
electron, it leads to NO production from L-Arginine.
Besides, post-translational modifications also occur on eNOS to maintain its inactive state and for correct localization. The N-terminus of eNOS has three acylation regions, G2, C15, and G26 amino acid residues. G2 provides localization of eNOS to caveolae, specifically to the Cav-1 protein by a process called myristoylation. C15 and C26 are covalently bound to fatty acids, with a process called palmitoylation, which increases the hydrophobicity of the protein and provides subcellular trafficking (Rocks et al., 2005; Yeh, Duncan, Yamashita, & Michel, 1999)
2.3 Genetically Encoded Fluorescent Biosensors
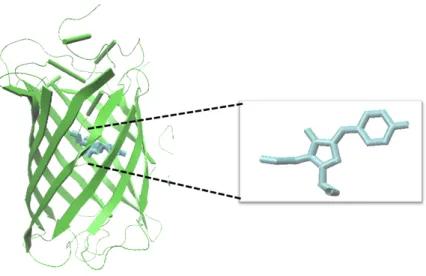
The field of genetically encoded biosensors (GEB), roots to the discovery of the fluorescent protein (FP) described in the 1960s from jellyfish, Aequorea Victoria (Shimomura, Johnson, & Saiga, 1962). A. Victoria was found to emit green light due to two closely associated proteins; green fluorescent protein (GFP) and aequorin. At first, GFP was discovered as aequorin associated, a 240 amino acid protein that contains a chromophore formed by the three amino acids Serine-Tyrosine-Glycine between the residues 65-67 (Figure 2.3) (Tsien, 1998).
9 Figure 2.3: 3D representation of the Green Fluorescent Protein (GFP). GFP is a
protein with a barrel structure which has the ability to emit green light upon stimulation. The green light is generated due to the chromophore, which is composed
of Serine-Tyrosine-Glycine as shown in the figure (F. Yang, Moss, & Phillips, 1996).
Aequorin, however, is a 189 amino acid bioluminescent calcium-binding protein that contains Ca2+ binding sites (Dikici et al., 2009). When Ca2+ is available and binds to the specific residues on aequorin, the protein undergoes a conformational change, leading to the oxidation of chromophore, emitting blue light (470 nm) (Baubet et al., 2000). Due to the proximity of aequorin and GFP under natural conditions, the emission light generated by aequorin is transferred to GFP, by a phenomenon called Fluorescent resonance energy transfer (FRET) (Tsuji, 2010). The principle of the FRET activated GFP is shown in Figure 2.4.
Figure 2.4: Schematic representation of the mechanism of light emission by aequorin upon activation with Ca2+. Upon activation of aequorin with Ca2+, aequorin emits blue light (470nm) and due to the proximity to the GFP, the emitted
10 The discovery of these two proteins was revolutionary in the field of fluorescent microscopy, protein engineering, and GEBs. Roger Tsien, Martin Chalfie and Osamu Shimamura were awarded the Nobel Prize in the field of chemistry in 2008 for the discovery and development of GFP. Since the identification of GFP, in the 1990s, Roger Tsien has expanded his studies into engineering novel GEBs (Tsien, 1980). First, his team has focused on native GFP, and exploited random mutagenesis experiments to generate various FP variants with different spectral properties that all were derived from the wild-type GFP. Early studies yielded new blue-shifted FPs such as the cyan-colored CFP that contained a Y66W mutation, a blue FP with a Y66H mutation in the chromophore (Heim, Prasher, & Tsien, 1994), and a yellow FP variant (YFP) that was generated by introducing a mutation at position Q69K (Tsien, 1998). Furthermore, his team has generated an enhanced GFP (EGFP), by changing the Serine, S65, to a Threonine. This approach yielded a brighter response over the native GFP, which became the widely used FP in the field of fluorescent proteins (Heim, Cubitt, & Tsien, 1995).
It was Roger Tsien again who recognized the potential of FPs and generated the first GEB for Ca2+, referred to as Chameleons (Miyawaki et al., 1997). In the last two decades, scientists advanced different types and classes of GEBs to image different targets such as; metabolites including malonyl-CoA, lactate, and pyruvate, neurotransmitters such as dopamine, gamma-aminobutyric acid (GABA), glutamate (Leopold, Shcherbakova, & Verkhusha, 2019; Marvin et al., 2019). Besides, GEBs has been also developed to measure intracellular pH fluctuations (Hanson et al., 2002), cellular signals (W. Lin, Mehta, & Zhang, 2019), ions like Ca2+ (Miyawaki et al., 1997), H2O2 (Pak et al., 2020), NO (Eroglu et al., 2016), and cell cycle proteins (Sakaue-Sawano et al., 2017). GEBs can be classified in 6 different classes as shown in Table 2.1.
11 Table 2.1: List of 6 different classes of GEBs
1. FRET-based biosensors which undergo a conformational change 2. FRET-based biosensors for enzymatic activity
3. FRET-based biosensors for enzymatic cleavage 4. Translocation based probes
5. Single FP based intensiometric probes 6. Single FP based ratiometric probes
FRET-based biosensors are composed of two fluorophores with an at least 30% overlapping excitation-emission spectrum (Zadran et al., 2012). One of these proteins referred to as the FRET donor, which is excited in the first phase, and the second protein referred to as the FRET acceptor, which emits light from the energy transferred from the donor. To generate FRET, the distance between the two FPs must be between 2-8 nm (Niekamp et al., 2019). A typical FRET-based biosensor is made of CFP/YFP, or BFP/GFP, or GFP/OFP FRET pair. Between the two fluorophores, the sensory domain is sandwiched, which undergoes conformational rearrangement upon activation and bring two FPs close, optimally in a concentration-dependent and reversible manner. (Figure 2.5, A). (Bajar, Wang, Zhang, Lin, & Chu, 2016) FRET-based biosensors for enzymatic activity are composed of a single protein structure containing sensory protein with double FP. When the substrate binds to the sensory protein, it undergoes a conformational change, thus bringing two FPs close for FRET (Figure 2.5, B) (Vogel, Van der Meer, & Blank, 2014). FRET-based biosensors for enzymatic cleavage sensors are composed of a sensory protein fused with double FP. Upon treatment with an enzyme, the sensory protein degrades and reduces the FRET signal (Figure 2.5, C) (Faccio & Salentinig, 2017).
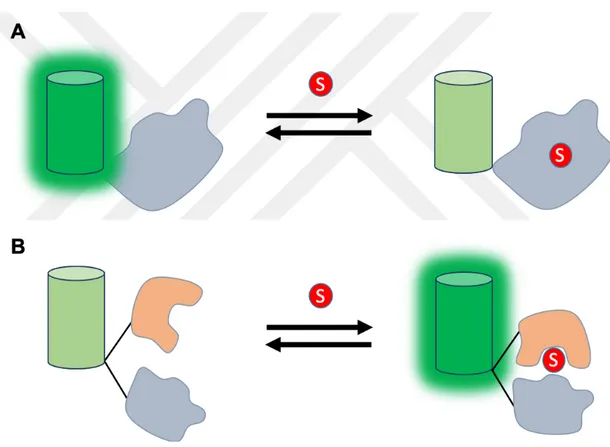
12 Figure 2.5: Schematic representation of FRET-based sensors: (A) Substrate
binding to the sensory domain between the two FPs leads to a conformational change, separating two FPs, thus reducing the FRET signal. (B) FRET increases
upon activation with the substrate and (C) FRET is reduced if the sensor is enzymatically cleaved.
Single FP-based sensors are fused to one, two, or more sensory domains (Tainaka et al., 2010). This principle can be exploited to visualize translocation events by generating FP containing chimera targeted to a specific locale (Snapp, 2005). Single FP based biosensors have also been designed that permit intensiometric and ratiometric readouts in real-time (Newman & Zhang, 2014). Location-specific biosensors are simply FP tagged versions of the target protein (Figure 2.6) (Keppler, Pick, Arrivoli, Vogel, & Johnsson, 2004).
13 Figure 2.6: Schematic representation of translocation based single FP probes.
GFP fused with the target protein leads GFP into a desired location and provides location-specific information.
Intensiometric biosensors can be further divided into two groups. This kind of probes provide an emission in only one single wavelength, that can be either lead to gain of intensity or lead to loss of intensity upon activation by the analyte. The great advantage of this principle is that several spectrally distinct biosensors can be used for multichromatic imaging. However, the disadvantage compared to double FP based FRET biosensors is that a single wavelength readout bears the danger of artificial effects, such as cell movement, cell contraction, local pH fluctuations, and other disruptions caused by optically interfering parameters. (Figure 2.7, A). To overcome these limitations, new approaches such as circularly permuted FPs (cpFPs) were developed (Baird, Zacharias, & Tsien, 1999). cpFPs are rearranged versions of normal FPs by changing the locations of C terminus and N terminus and connected with the desired sensory protein (Figure 2.7, B) (Kostyuk, Demidovich, Kotova, Belousov, & Bilan, 2019). This approach enables the sensory protein to act as a switch, thus increasing the intensity of emitted light from the FP. (Figure 2.7, B) (Tebo et al., 2018). A significant drawback of intensiometric cpFP-based biosensors is that they only provide information by the change in the intensity of the biosensor. Therefore, it becomes difficult to determine if the signals changed due to analyte concentration, photobleaching, or biosensor concentration in a single cell. Ratiometric cpFP-based biosensors, however, have two different excitation or emission maxima and provides opposing fluorescent signals upon activation with an analyte. Hanson et al. generated
14 dual-emission GFP (deGFPs) variants by creating mutations in specific chromophore locations. S65T provides the dual emission property to the biosensor, due to changing the proton locations. deGFPs contain two absorption bands as wild type GFP. However, the natural and excited FP intensity ratio was highly dependent on the microenvironmental factors such as pH. at lower pH levels, the biosensor has a maximum emission at 400nm, creating a blue signal and at higher pH levels, creating a green signal with maxima at 500nm (Hanson et al., 2002). Ratiometric cpFP signals thus offer a more precise, unbiased results and eliminate the distortions of unnecessary data caused by the single-cell movement, photobleaching, and nonuniform concentration of the biosensor in each cell.
Figure 2.7: Schematic representation of Intensiometric and ratiometric single FP biosensors. A) Single FP based intensiometric sensors decrease the intensity of the FP upon substrate binding to the sensory domain of the sensor B) cpFPs contain a
sensory protein which increases the intensity of the FP upon substrate binding. 2.3.1 Genetically Encoded Calcium Indicators
The field of Ca2+ imaging has emerged with Roger Tsien and his colleagues’ technological advances in the field of genetically encoded biosensors. Other than the first natural Ca2+ sensor, aequorin, Tsien’s team has successfully generated chemical biosensor that is a selective fluorescent indicator for Ca2+ termed as Fura
(2-[6-[Bis[2-15 [(acetyloxy)methoxy]-2-oxoethyl]amino]-5-[2-[2-[bis[2-[(acetyloxy)methoxy]-2-oxoethyl]amino]-5-methylphenoxy]ethoxy]-2-benzofuranyl]-5-oxazolecarboxylic acid (acetyloxy)methyl ester). Notably, Fura and its derivatives are still one of the most commonly used Ca2+ indicators utilized in life-sciences (Grynkiewicz, Poenie, & Tsien, 1985). Despite many advantages such as providing ratiometric read-outs, high selectivity and sensitivity, Fura and similar chemical indicators are often less suitable for subcellular imaging because of their non-targetability. In 1999, Tsien and his team designed developed, and generated a novel class of genetically encoded Ca2+ sensors which they termed Cameleons. Cameleons are the first genetically encoded FRET-based biosensors composed of either a CFP or blue fluorescent protein (BFP) as a FRET donor fused to a CaM with CaM-binding domain of myosin light chain kinase (M13) proteins as sensory protein and a yellow fluorescent protein (YFP) as a FRET acceptor. In the presence of Ca2+, CaM and M13 undergo a conformational change, leading to the donor FP to come close to acceptor YFP, generating FRET (Miyawaki et al., 1997). Later in 1999, the team had studied the circularly permutated versions of GFP (cpGFP) and found that adding the CaM protein between the cpGFP, the sensor was able to generate a fluorescent signal in the presence of Ca2+ (Baird et al., 1999). The developed sensors had inadequate signal intensity, which made it harder to measure Ca2+. To eliminate this low single-to-noise ratio, Nakai et al. generated a new single FP biosensor with cp enhanced GFP (cpEGFP) and CaM, referred to as GCaMP (Nakai, Ohkura, & Imoto, 2001). Lastly, in 2011, to accelerate the development of GCaMPs, Zhao et al. used directed protein evolution techniques with different screening technologies to identify new GCaMP-type indicators produced by Escherichia coli colonies. The team has produced a variety of different colored GCaMPs and named as Genetically Encoded Ca2+ indicators for optimal imaging (GECO) with Blue (B-GECO) and Red (R-GECO) variants (Figure 2.8). These biosensors turned out to be more selective to Ca2+, and have provided an expanded pallet of different colored Ca2+ sensors that permitted scientists to image Ca2+ in different spectral properties for multispectral imaging (Zhao et al., 2011)
16 Figure 2.8: 3D representation of R-GECO and B-GECO. GECO sensors are
composed of mutated versions of cpEGFP, linked with CaM and CaM binding domain of myosin light chain kinase (M13). The left panel shows the 3D structure of the Red variant of GECO and the right panel shows the 3D image of the Blue variant
of GECO. White spheres indicate the Ca2+ ions. 2.3.2 Genetically Encoded Nitric Oxide Biosensors
Pearce and his colleagues generated the first-ever genetically encoded NO biosensor with CFP and YFP tagged human type IIa metallothionein (hMTIIa) (Pearce et al., 2000). Metallothioneins are a cysteine-rich metal-binding protein (Rigby Duncan & Stillman, 2006), which is suggested to be highly crucial for zinc (Zn2+) homeostasis, as it can interact with seven Zn2+ molecules (St Croix et al., 2002). NO, however, has been shown to interact with MTs and trigger the release of bound metal ions (Khatai, Goessler, Lorencova, & Zangger, 2004). Due to these features of MTs, the authors generated a novel FRET-based biosensor containing hMTIIa, which they termed FRET-MT. According to their studies, the addition of NO led to a decrease of the FRET signal, by increasing the distance between two FPs (Pearce et al., 2000). Later, NO was successfully detected with FRET-MT in cultured sheep pulmonary endothelial cells (St Croix et al., 2002)
Chronologically, the second-ever genetically encoded NO biosensor was developed by Sato et al. termed as A Fluorescence indicator for NO with a signal amplifier (NOA-1) (Moritoshi Sato, Hida, & Umezawa, 2005). Since sGC is the primary receptor for NO (Montfort, Wales, & Weichsel, 2017), the team had generated NOA-1 with both, the alpha and beta subdomain of sGC and fused it with a known FRET-based cGMP biosensor (CGY) (M. Sato, Hida, Ozawa, & Umezawa, 2000). Upon NO binding to the heme group in the beta subunit of sGC activates the enzyme, thus increases the production of cGMP from GTP. Because the sensor is fused to CGY, which is a FRET-biosensor, the produced cGMP can be simultaneously detected upon formation. This approach allowed to indirectly measure NO concentrations in single cells by exploiting the reaction cascade caused by NO. The authors claim that NOA-1
17 can detect NO levels in a low nanomolar range down to 0.1nM in a reversible manner. However, NOA-1 sensors are two large fusion proteins that must be co-expressed in each cell. To generate a correct signal, equal amounts of each protein must be present (Moritoshi Sato et al., 2005). To overcome this situation, Sato et al. have generated the cell-based sensor named Piccel (Moritoshi Sato, Nakajima, Goto, & Umezawa, 2006). Piccels are generated by pig-kidney delivered cell line (PK15) because these cells endogenously express sGC (Ye, Rubakhin, & Sweedler, 2008), therefore to create a cell-based indicator, the team only transfected cells with CGY. The authors claim that Piccels were capable to detect NO in a picomolar level. Furthermore, the team has also tried to detect NO produced in vascular endothelial cells. For that, the Piccel sheet was prepared on a coverslip and transferred into the endothelial cells, which were grown in a glass dish. Upon stimulation with ATP, NO produced from the endothelial cells diffused into the Piccel sheet, generating a signal. However, the team found that if the distance between the Piccel sheet and endothelial cell was greater than 60µm, the response obtained from the Piccel sheet has disappeared (Moritoshi Sato et al., 2006). Both NOA-1 and Piccel turned to be capable to measure NO indirectly.
In 2013, a group at the University of California came up with an idea of generating a single FP-based biosensor, which is selectively sensitive to the unstable peroxynitrite (ONOO-) (Z. J. Chen, Ren, Wright, & Ai, 2013). ONOO- is generated by superoxide anions and NO, and it is considered as an essential molecule in redox biology functioning in different physiological and pathological conditions including inflammation, neurogenerative disorders, and ischemia (Khan, Alam, Zafaryab, & Rizvi, 2017; Pacher, Beckman, & Liaudet, 2007). It has been known that boronic acid organic dyes selectively reacts with ONOO-, generating phenolic constructs with high fluorescent property (Sikora, Zielonka, Lopez, Joseph, & Kalyanaraman, 2009). By using this approach, the team has location specifically introduced a boronic acid moiety to cpGFP, called pnGFP. In the presence of ONOO-, it generates phenolic products that yield a strong fluorescent signal allowing to image ONOO-. However, one of the major drawbacks of this sensor is the irreversible response to ONOO-. Since ONOO- is produced by the reaction of NO with superoxide anions (Beckman & Koppenol, 1996), the biosensor has been exploited to visualize NO indirectly.
18 In 2016, a new genetically encoded FRET-based biosensor, named sNOOOpy (Sensor for NO3−/NO2−in physiology), allowed the visualization of nitrate and nitrite in single living cells. sNOOOpy is composed of two microorganismal nitrate assimilation system genes, NasS and NasT, fused with Venus and CFP, respectively (Hidaka et al., 2016). These two subunits are known to function in NO3−absorption and digestion in the root nodule bacterium Bradyhizobium japonicum (Luque-Almagro et al., 2017). It was found that these two genes create a stable structure in the absence of the NO3−, giving the possibility of creating a biosensor (Sánchez et al., 2014). In the absence of the NO3−, NasS-Venus and CFP-NasT form a stable complex generating FRET. Upon exposure to NO3−or NO2−FRET decreases due to the NO3−/NO2−binding to NasS-Venus. With this generated biosensor, the authors showed in HeLa cells NO3−and NO2− uptake mechanisms with exogenously applied NO3− / NO2− and proved that the sensor can also be used for real-time cell imaging (Hidaka et al., 2016). Notably, NO3−and NO2−are stable byproducts of NO and can be used as a surrogate for real-time NO imaging.
In the same year, a new class of single FP-based genetically encoded biosensors were developed that permit direct detection of NO with high spatial and temporal resolution. The authors termed these tools as geNOps, which stands for genetically encoded nitric oxide probe. To generate geNOps, the team has first studied the NO binding proteins of different organisms, to find the suitable NO binding proteins and also can change the fluorescence intensity. In geNOps, the cyclic guanylyl cyclase-activating factor (GAF) domain of an E. coli, which is an anaerobic NO reductase transcription regulator (NorR) gene was fused with a FP (Figure 2.9). Generating differently colored FPs to the GAF domain yielded a colorful palette of new biosensors that permit multichromatic imaging in a given cell. Because geNOps are single FP based, the spectral read-out of the probes is intentiometric. As discussed before, intensiometric probes bear the risk to yield false-negative results due to the optical interference of local pH changes.
19 Figure 2.9: 3D protein structure of Intensiometric geNOps. The upper panel shows the enhanced Green fluorescent and Cyan variants of geNOps. Lower panel
Indicates the working mechanism of geNOps. When NO gets in contact with the GAF domain, it decreases the fluorescent intensity, thus providing a tool for NO imaging. All images were generated with I-TASSER, a server for protein structure
and function predictions (Roy, Kucukural, & Zhang, 2010; J. Yang et al., 2015; Zhang, 2008).
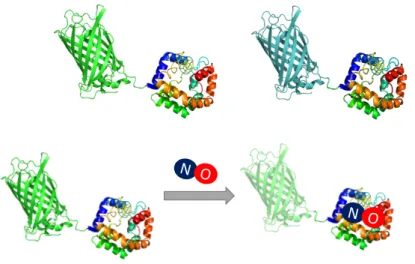
Ratiometric geNOps, however, contains two FP’s, GAF domain, plus a linker sequence (Figure 2.10). The linker sequence provides one FP to be in a distant location, preventing the quenching of the FP when NO binds to the GAF domain. At the resting state, the ratiometric geNOps provides an equal response from the two FPs. Upon activation with NO, the proximity FP quenches, but not the distant one, thus provide a ratiometric signal (Eroglu et al., 2016).
Figure 2.10: 3D protein structure of ratiometric geNOps. Ratiometric geNOps are composed of 2 FP’s, GAF domain, and a linker. Upon activation with NO, there is a
decrease in the closer, rather the other one still emits fluorescent as before, thus providing a ratiometric result.
N O N O
N O
20
MATERIALS and METHODS
3.1 Molecular Cloning
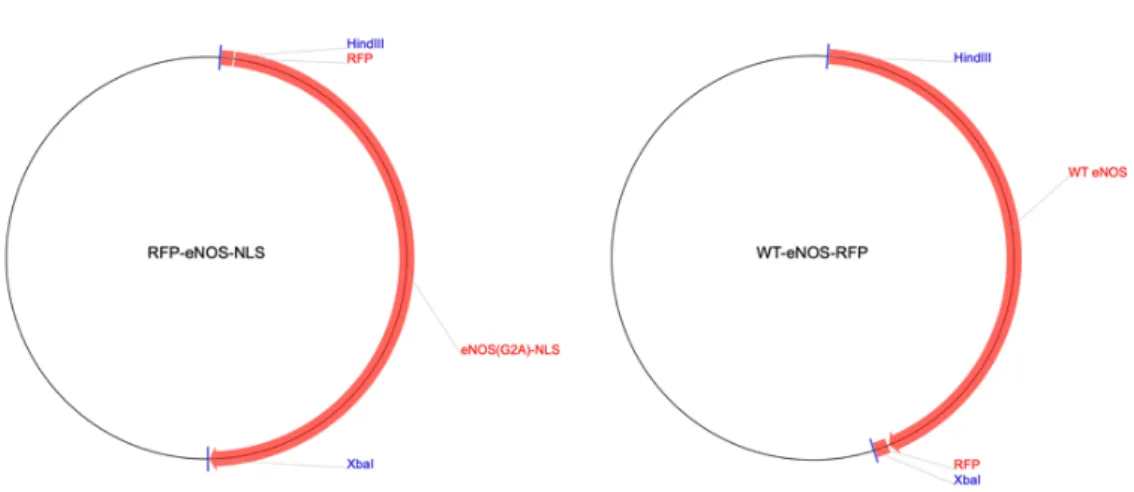
Each construct used in these studies including the NLS-eNOS-RFP (Figure 3.1, Right panel), WT-eNOS-RFP (Figure 3.1, Left panel), G-geNOp, O-geNOp-NES, R-GECO-NLS (Figure 3.2, Right Panel) and R-GECO-UT (Figure 3.2, Left Panel) were received on a filter paper. All constructs were cut around the indicated border on the filter paper, placed in different 1,5 ml Eppendorf tubes, and incubated in 30 µl of DEPC water to dissolve the plasmids from the filter paper. Tubes were then centrifuged at 13,000 rpm for 1 minute and subsequently preserved at 4 °C. At least 16 hours later, plasmids were transformed into competent E. Coli (NEB Order C2987I) using a heat shock procedure according to the manufacturer’s protocol. 100 ng of plasmid DNA were used from each construct and 50 µl of competent bacteria was placed on ice for 30 minutes. The transformation was done by heat shock at 42°C for 30 seconds. Cells were then placed on ice for an additional 5 minutes. 900 µl SOC medium was added and incubated at 37°C in an orbital shaker for 1 hour. Cells were then plated onto a selection plate of LB agar supplemented with 100 µg/mL ampicillin and incubated at 37°C overnight. Individual colonies were inoculated with LB broth supplemented with ampicillin. For the constructs which were received from Addgene in form of bacterial agar stabs, single bacterial colonies were obtained using an inoculation loop and overnight incubation on a selection plate. Single bacterial colonies were then picked and inoculated for 16 hours at 37°C in an orbital shaker. After incubation, bacteria were centrifuged at 4700 rpm for 15 minutes at 4°C. The supernatant was removed, and plasmids were isolated according to Qiagen plus MIDI prep kit (12943; Qiagen). Isolated plasmid DNA was eluted with 30µL nuclease-free water and purity was confirmed spectroscopically by determining the ratio at 260nm and 280nm. Samples were considered as pure DNA when the ratio A230:260:280 yielded a value of 1.85. Correct size insertion was determined by enzymatic digestion using the enzymes, HindIII, NotI, XbaI, and BamHI, followed by gel electrophoresis on a 1.2% agarose gel. G-geNOps that were digested with XbaI and NotI expected to have an insert size of 1250 bp. WT-eNOS-RFP digested with HindIII and BamHI yielded an insert size of 4448 bp.
21 Figure 3.1: Vector maps of red tagged eNOS variants: The right panel shows the
map of nuclear targeted version of red tagged eNOS and the left panel shows the wild type version of red tagged eNOS (Iwakiri et al., 2006).
Figure 3.2: Vector maps of R-GECOs: The right panel shows the map of nuclear targeted version of GECO and the left panel shows the cytosolic version of
R-GECO (Zhao et al., 2011). 3.2 Cell Culture
Preserved HEK293 cells (ATCC® CRL-1573™) at the vapor phase of liquid nitrogen were placed in a water bath until completely dissolved. To dilute the DMSO, 9 ml of fresh DMEM, supplemented with 10% of Fetal Bovine Serum (FBS) and 1% penicillin/streptomycin (complete medium) was added to HEK293 cell in freezing medium (complete medium supplemented with 10% DMSO). Cells were then seeded on a 10 mm cell culture dish and placed in a humidified growth chamber supplemented with 5% CO2 at 37°C. Confluent cells were passaged to maintain their progressive growth. Cells were washed with phosphate buffer saline (PBS), and then treated with 1x Trypsin and incubated at 37°C for 3 to 5 minutes. Trypsin was deactivated by
22 adding 5 ml of complete medium. Cells were counted with a hemocytometer and the approximate cell number was found with the formula; the number of cells counted from the 4 corners / 4 x 10,000 x dilution factor. 500,000 cells were seeded in a new 10 mm cell culture dish. The old medium was replaced by a fresh full medium every second day. Before transfection, HEK293 cells were maintained in complete medium at 5% CO2 and 37°C until 60% confluency was reached. For imaging experiments, 30,000 HEK293 cells were seeded onto a 6-well plate one day before the transfection on a 30 mm diameter and 0,1 thick cover glass (Asistent, Germany). 1-hour before transfection, the old complete medium was replaced with a fresh complete medium. PolyJet™ in vitro DNA transfection reagent (SL100688; SignaGen) was used for the transfection of HEK293 cells with the purified plasmids. For each well, 1 µg of plasmid DNA needed with 3 µl PolyJet reagent in a 100 µl serum, antibiotic, and phenol-free high-glucose (4.5 mM) medium. To mix the plasmid DNA with the Polyjet reagent mix for efficient transfection, two Eppendorf tubes were prepared. One Eppendorf tube contained 3 µg of plasmid DNA with 150 ul serum-, antibiotic-, and phenol-free high-glucose (4.5 mM) medium, and other tube contained 3 µl Polyjet reagent with the same medium. Immediately after adding the Polyjet to the second tube, all mix was pipetted in the second tube and directly added onto the plasmid DNA containing tube. The transfection mix was incubated at room temperature for 15 minutes. After 15 minutes of incubation, the transfection mix was dropwise added to the cells in complete medium and incubated in a humidified growth chamber supplemented with 5% CO2 at 37°C for 3 hours. After incubation, the medium is aspirated, and fresh complete medium was added. Cells were placed in a humidified growth chamber supplemented with 5% CO2 at 37°C until imaging experiments typically 24 to 48 hours.
3.3 Buffer Solutions
All chemicals for preparing the buffers were obtained from NeoFroxx GmbH-Labochem International, Germany. A HEPES-based loading buffer was prepared to preserve cells outside of the humidified incubator without changing their physiological conditions. To prepare a HEPES based loading buffer, 10 mM HEPES, 2 mM CaCl2, 138 mM NaCl, 1 mM MgCl2, 5 mM KCl, 2.6 mM NaHCO3, 0.44 mM KH2PO4, 0.34
23 mM Na2HPO4, 10 mM Glucose, 1% penicillin/streptomycin, 0.1% of amino acids, 0.1% vitamins in ddH2O was used and pH was adjusted to 7.42 by adding NaOH.
During the experiments, cells were perfused either containing or lacking Ca2+ buffers. Ca2+ containing buffer was composed of 10 mM HEPES, 2 mM CaCl
2, 138 mM NaCl, 1 mM MgCl2, 10 mM D-Glucose, 5 mM KCl, pH adjusted to 7.42 with NaOH. Ca2+ lacking buffer is composed of 10 mM HEPES, 10 mM EGTA, 138 mM NaCl, 1 mM MgCl2, 10 mM D-Glucose, 5 mM KCl, pH adjusted to 7.42 with NaOH.
Additionally, geNOps are iron(II) ion-dependent due to their non-heme iron domain that functions as the active site for NO binding. For this purpose, we added 1 mM iron (II) fumarate and 1 mM ascorbic acid to a Ca2+ containing buffer and vigorously stirred on a magnetic stirrer in dark for at exactly 2 hours until the iron (II) fumarate and ascorbic acid completely dissolved and the color changed to yellowish. To retard the unsolved iron(II) fumarate, the buffer was filtered with a 0.22 µm syringe filter and refrigerated in a dark place for up to one week. Before imaging experiments, geNOps transfected cells were first incubated in a prewarmed iron(II) buffer for exactly 20 minutes, following two wash steps with a HEPES-based loading buffer. Cells were further incubated for two hours in the same buffer until the imaging experiment to allow the cells to equilibrate to the ambient temperature and conditions. In all of the experiments, cells were stimulated with either 100 µM ATP (Sigma-Aldrich, A6419-5G) or 10 µM 3-(2-Hydroxy-1-methyl-2-nitrosohydrazino)-N-methyl-1-propanamine (NOC-7) (Santa Cruz Biotechnology,146724-84-7) prepared in the either containing or lacking Ca2+ buffers according to the experiment.
3.4 Fluorescence Imaging and Image Analysis
Transfected HEK293 cells were placed into a perfusion chamber, which was connected to a homemade and gravity-based superfusion system. The chamber was connected from one end to the perfusion system to provide different buffers containing various agonists, small compounds, and inhibitors. The other end of the perfusion chamber was connected to a peristaltic pump to remove the perfusion buffer (Figure, 3.3).
24 Figure 3.11: Schematic representation of gravity-based perfusion system: the
perfusion system was composed of gravity-based perfusion system connected to perfusion chamber located on the microscope. The other end of the perfusion chamber connected to the waste with the peristaltic pump for the removal of the
buffer. ATP: Adenosine triphosphate.
Imaging experiments were performed on a Zeiss Axiovert A1 inverted microscope with Axiovert charged-coupled device (CCD) camera, equipped with a Colibri 2 LED light source. For the green G-geNOps imaging experiments, the filter set 38 HE, containing a dichroic mirror with 495 LP, excitation filter (470/40 BP), and emission filter (525/50 BP) was used. G-geNOps were excited at 477 nm wavelength. For calcium imaging experiments using the red FP based R-GECOs the filter set 43 with a dichroic 570 LP, excitation filter (545/25 BP), and emission filter (605/70 BP) was used. R-GECO’s were excited with 575 nm wavelength. In all experiments, the following set up was used; 10% intensity used for the excitation light, camera binning was set to 4x4 to reduce phototoxicity. Time-laps were recorded every 3 seconds. For high-resolution images, camera binning was set to 1x1. Exposure was set between 50 ms to 800 ms, this was dependent on the expression efficiency of the respective biosensors. After live-cell imaging experiments, each cell was selected as a region of interest (ROI) with Zeiss’s Zen Pro program (Carl Zeiss, Germany) with an additional ROI covering a cell-free region to record the background signal. Collected data were exported to an Excel sheet for data processing. Background values were subtracted from the signals obtained from each cell. Baseline values were selected to obtain a one-phase decay plot. The model of one-phase-decay expressed as Y = (Y0 – Plateau) * exp(-K*X) + Plateau. Y0 value referred to as the value at the beginning of the experiment. X is the independent variable (time), the plateau is the Y value in infinite
Bu ffe r AT P NO C-7
25 time point and K is the rate constant, which determines the sharpness of the curve. After obtaining the one-phase decay curve according to the baseline values, it was used as the baseline for every time point in the experiment. Data values obtained from the experiment were analyzed with 1-Y/Y0 formula to normalize the NO signals.
3.5 Statistical Analysis
Statistical analysis was performed using GraphPad Prism 7.0 (GraphPad Software, Inc., San Diego, CA). Live-cell imaging results were analyzed using open-access image analysis software, Fiji, and Zeiss’s Zen Pro program. All experiments were performed in 3 technical replicates. Maximum NO signals from each individual cell were found for Student’s t-test. For all analyses, p<0.05 was considered as significant.
26
RESULTS
4.1 Characterization of G-geNOps and O-geNOps in Responses to Exogenously Applied NO in Single Human Embryonic Kidney Cells
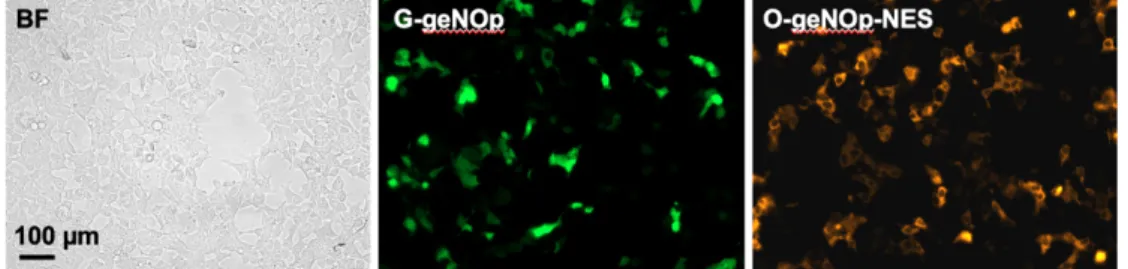
geNOps are genetically encoded NO probes for real-time imaging of NO for single cells and subcellular locales. Here we have characterized for the first time an exclusively cytosolic-targeted O-geNOp along with the well-established G-geNOp, which is a non-targeted variant. For the characterization and testing of the functionality of the new geNOps variant, we decided to use the human embryonic kidney cell line HEK293 (Figure 4.1, left panel). This cell-line is a well-characterized, robust, and easy-to-transfect mammalian cell-line, which turned to be excellent for the characterization of genetically encoded biosensors. Moreover, these cells lack an enzyme - such as NOS - that can synthesize NO, which is an important feature that allows studying NO signals of differentially targeted eNOS as shown later. To test the functionality of the O-geNOp-NES we compared the new biosensor with the well-established geNOps. Consistent with former studies (Eroglu et al., 2016), G-geNOps showed robust fluorescence in HEK293 cells 24 hours after transfection (Figure 4.1, middle panel). As expected, the exclusively cytosolic-targeted O-geNOp-NES showed correct localization to the cytosol and a similar fluorescence intensity compared to G-geNOp (Figure 4.1, right panel).
Figure 12.1: Transfection efficiency of cytosolic targeted and untargeted geNOps. Representative wide-field images of HEK293 cells in the bright field mode (left panel) or expressing the green variant of geNOps (G-geNOps, middle panel), or expressing the cytosolic targeted orange geNOps variant (O-geNOps-NES, right
panel). Expression profiles were determined on different days with different passages of HEK293 cells expressing the respective geNOp variants.
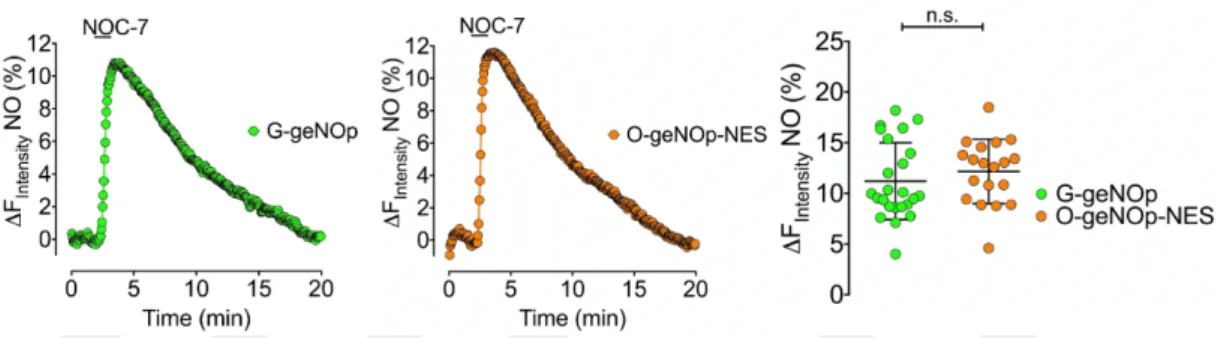
Next, we tested the fluorescence signal changes of G-geNOp and O-geNOp-NES in response to an exogenously applied NO-donor, termed NOC-7. For this purpose, we used an in-house-made and gravity-based superfusion system to apply and withdraw the compounds using a perfusion chamber connected to a vacuum pump. As
27 shown in Figure 4.2, the administration of NOC-7 evoked an instant and strong geNOps response within the first minute. Withdrawing the compound led to a total recovery of the signal back to the baseline. As expected, cytosolic targeting of O-geNOps did not affect the NO responsiveness of the biosensor (Figure 4.2). Moreover, the O-geNOps biosensor showed the same NO profile as G-geNOps. However, to our surprise, the G-geNOps amplitude evoked by 10 µM NOC-7 was not significantly different compared to the O-geNOps. This observation is in contrast to the initial results published in the first article describing geNOps (Eroglu et al., 2016). In the first paper published in 2016, the maximum response of G-geNOps was shown to be almost 100% stronger as the O-geNOps variant. Our data, however, clearly show no significant difference between the two variants, indicating that either targeting the biosensors to the cytosol may alter the performance of the sensor.
Figure 13: Representative time course of exogenously applied NOC-7 signals in HEK293 cells. The left panel shows NO signals of HEK293 cells expressing
G-geNOp in response to 10 µM NOC-7. The middle panel shows the same experimental condition, using the orange and cytosolic variant of geNOps. The right
panel shows scatter dot-blot representing the statistical comparison between the maximum response to exogenously applied NOC7 of G-geNOps (n=3/29) and
O-geNOps (n=3/19). Student’s t-test was performed, p = 0,3861.
Next, we attempted to image NO signals derived from differentially targeted endothelial nitric oxide synthase (eNOS). HEK293 cells are an excellent model system to study NOS derived NO profiles as shown in multiple studies before as these cells lack an enzyme that can generate NO. Thus, we co-transfected HEK293 cells with O-geNOps-NES and eNOS-GFP, which is a chimera of the wild-type eNOS fused to a green fluorescent protein (GFP). As shown in Figure 4.3, both constructs showed strong expression levels, indicating that cells tolerate the overexpression of both constructs. However, analysis of the excitation and emission profiles of the enhanced GFP (EFGP) and monomeric Kusabira Orange κ (mKOκ)- based FP showed significant overlap in the excitation and emission profile. This spectral overlap makes
28 the constructs eNOS-GFP and O-geNOp-NES less suitable for multispectral imaging because of the risk for spectral bleed through. A spectral crosstalk may lead to artificial or false-positive responses.
Figure 14: Co-imaging of eNOS-GFP and O-geNOps. Representative widefield images showing HEK293 cells co-expressing eNOS-GFP (left panes) and O-geNOps-NES (middle panel). The right panel shows the excitation and emission spectra of EGFP with mKOκ fluorescent proteins. Cells were imaged with a 20x air
objective.
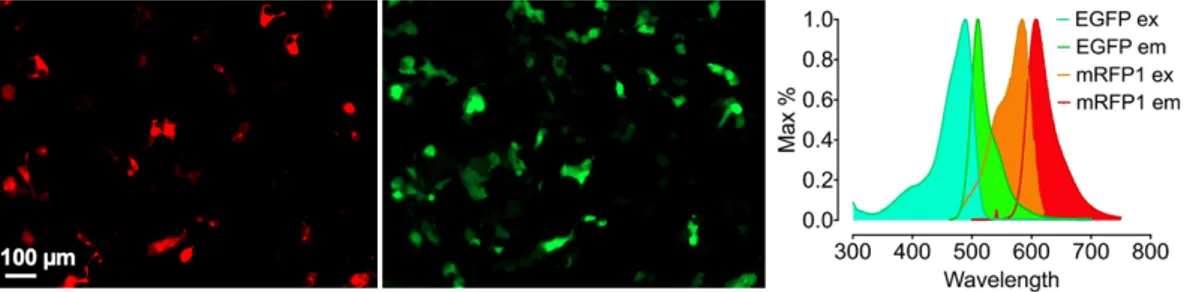
To prevent spectral bleed-through, which corresponds to about 30% to each channel respectively for the GFP and OFP based construct (Figure 4.3, right panel), we next tested co-imaging of WT-eNOS-RFP and G-geNOp. As shown in Figure 4.4, both constructs showed a clear transfection efficiency. Besides, the spectral overlap between EGFP emission and mRFP1 was minimal due to the large distance between the excitation and emission maxima of the constructs (Figure 4.4). For the next multichromatic imaging studies we used henceforth, the RFP tagged eNOS and GFP based geNOp.
Figure 15: Co-imaging of eNOS and geNOps. Representative widefield images showing HEK293 cells co-expressing eNOS-RFP (left panel) and G-geNOps (middle
panel). Excitation and emission spectra of used mRFP1 and EGFP. Cells were imaged with a 20x air objective.
29 4.2 Intracellular Calcium Imaging Using Genetically Encoded Calcium
Indicators – The -GECOs
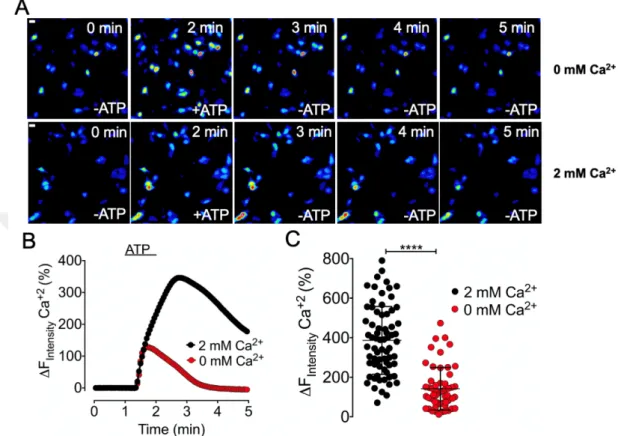
Under physiological conditions, intracellular Ca2+ modulates the endothelial and neuronal NOS (eNOS and nNOS). Thus, to study NO production derived from subcellular localized eNOS in vitro, we first characterized the intracellular Ca2+ profiles in HEK293 cells in response to pharmacological agonists. Among various agonists, we decided to use the well-characterized IP3-generating agonist Adenosine triphosphate (ATP). For the visualization of intracellular Ca2+, we exploited the RFP variants of the untargeted GECOs (R-GECO-UT). Notably, the R-GECOs are red-shifted intensiometric probes permitting co- imaging with the blue-red-shifted geNOps (Eroglu et al., 2019). To characterize the intracellular Ca2+ profiles in HEK293 cells, we used two different imaging-buffers, containing or lacking Ca2+. As shown in the micrographs in Figure 4.5 A, under both conditions, in the presence and absence of extracellular Ca2+, the administration of ATP evoked a strong GECO-signal. Post-image-analysis unveiled that the initial Ca2+ increase was similar for both conditions, in the presence and absence of extracellular Ca2+. However, after removal of the agonist from the imaging-media, the intracellular Ca2+-signals in cells imaged in the absence of extracellular Ca2+ showed a significantly faster recovery of the GECO signal compared to the group imaged in the presence of extracellular Ca2+ (Figure 4.5, B). The faster recovery of the GECO signal may be caused by the lack of extracellular Ca2+, which prevents the Ca2+ influx from extracellular space, leading to a faster recovery of GECO signal. Overall, no significant difference between the maximum responses in the presence or the absence of extracellular Ca2+ was observed (Figure 4.5, C). Notably, R-GECOs are intensiometric probes lacking the ability to quantitatively measure intracellular Ca2+. Therefore, other than ratiometric biosensors, we can only relatively quantify and compare intracellular Ca2+ changes (Figure 4.5, C).