Sayı 17, S. 860-865, Aralık 2019
© Telif hakkı EJOSAT’a aittir
Araştırma Makalesi
www.ejosat.com ISSN:2148-2683No. 17, pp. 860-865, December 2019
Copyright © 2019 EJOSAT
Research Article
Comparison of DNA Extraction Protocols for PCR-based Techniques
in Wheat
Özlem Ateş Sönmezoğlu
1*, Begüm Terzi
11Karamanoğlu Mehmetbey University, Faculty of Engineering, Department of Bioengineering, Karaman, Turkey, (ORCID: 0000-0002-3423-7095)
(İlk Geliş Tarihi 13 Kasım 2019 ve Kabul Tarihi 7 Aralık 2019) (DOI: 10.31590/ejosat.646491)
ATIF/REFERENCE: Sönmezoğlu, Ö. A. & Terzi, B. (2019). Comparison of DNA Extraction Protocols for PCR-based Techniques in Wheat. Avrupa Bilim ve Teknoloji Dergisi, (17), 860-865.
Abstract
Molecular biology and genetic studies requires high quality DNA isolated from plants. Therefore, isolation of pure and high quality DNA in a short time is important. However, since different plants have different chemical composition, in even close species need specific genomic DNA isolation protocol. There are a large number of protocols for wheat. Therefore, which method is more applicable, safer and easier should be determined. For this purpose three DNA extraction protocols were used. The DNA samples extracted from these protocols were compared for their purity and concentrations. The quality and amount of DNA obtained was determined by NanoDrop Microvolume Spectrophotometer (A260/280 absorbance) and agarose gel electrophoresis. Additionally DNAs extracted were amplified by polymerase chain reactions (PCR) and the suitability of isolated DNAs for PCR reactions were also determined. The results show that with the CTAB DNA extraction methods were extracted the highest DNA concentrations in wheat (Triticum avestivum L.) compared to other protocols.
Keywords: DNA isolation, Wheat, PCR, SSR, CTAB.
Buğdayda PCR’a Dayalı Teknikler için DNA Ekstraksiyon
Protokollerinin Karşılaştırılması
Öz
Moleküler biyoloji ve genetik çalışmalar, bitkilerden izole edilmiş yüksek kaliteli DNA gerektirir. Bu nedenle, saf ve yüksek kalitede DNA'nın kısa sürede izolasyonu önemlidir. Bununla birlikte, farklı bitkiler farklı kimyasal bileşime sahip olduklarından, yakın türlerde bile spesifik genomik DNA izolasyon protokolüne ihtiyaç vardır. Buğday için çok sayıda protokol vardır. Bu nedenle, hangi yöntemin daha uygulanabilir, daha güvenli ve daha kolay olduğu belirlenmelidir. Bu amaçla üç DNA ekstraksiyonu protokolü kullanılmıştır. Bu protokollerden elde edilen DNA örneklerinin saflıkları ve konsantrasyonları karşılaştırılmıştır. Elde edilen DNA'nın kalitesi ve miktarı NanoDrop mikro-hacim spektrofotometre (A260/280 absorbans) ve agaroz jel elektroforezi ile belirlenmiştir. Ayrıca, ekstrakte edilen DNA'lar polimeraz zincir reaksiyonları (PCR) ile amplifiye edilmiş ve izole edilmiş DNA'ların PCR reaksiyonları için uygunluğu da belirlenmiştir. Sonuçlar buğdayda (Triticum avestivum L.) diğer protokollere kıyasla CTAB DNA ekstraksiyon yöntemi ile en yüksek DNA konsantrasyonlarının elde edildiğini göstermiştir.
Anahtar Kelimeler: DNA izolasyonu, Buğday, PCR, SSR, CTAB.
* Corresponding Author: Karamanoğlu Mehmetbey University, Faculty of Engineering, Department of Bioengineering, Karaman, Turkey, ORCID: 0000-0002-3423-7095, [email protected]
1. Introduction
Plant DNA isolation is a basic requirement for molecular plant breeding, genetic engineering and genome characterization. The degree of quality and purity required of DNA extracted varies to application. High quality DNA is required for molecular analysis of plants. The requested quality of DNA is essential for the success of the molecular study. The selection of genomic DNA isolation method depends on what the applications of the DNA after isolation. Different methods are available to isolate DNA from plants. The purity, source, quantity and quality of DNA should be considered before genomic DNA extraction. DNA can be isolated a short time is important. Success of the DNA isolation is measured by quality and usefulness of obtained DNA.
High-resolution genetic mapping, map-based cloning of genes, or marker-assisted mapping used for selection of agronomically important properties are required DNA isolation of large number of plants in a short period. Therefore, one of the most important factors that restrict marker-assisted selection in wheat is the DNA isolation of large populations. Polymerase chain reaction (PCR) based SSR markers provide more intraspecific polymorphism in wheat than RFLP method (Plaschke et al 1995, Röder et al 1995). There are a large number of specific DNA isolation protocols for plant species. However, these protocols are different in terms of labour, time and cost. Some extracted DNA contains the remains of different substances. Thus, PCR also effected negatively.DNA extraction protocols successfully applied to many different plant species available (Dilworth and Frey 2000, Doyle and Doyle 1987, Paris and Carter 2000). A most of the studies in wheat molecular biology are need to do selection by PCR in plant samples (Chai et al 2006).
DNA isolation is more difficult in cereal crops, because of the non-cellulose components in the leaf cell wall and the high starch and protein ratio. Thus it is very necessary to establish a rapid, simpleandefficient DNA isolation protocol in wheat. However, these protocols must be optimized prior to their application. Researchers often modify a protocol from different protocols to obtain desired quality DNA (Varma et al 2007).
The purpose of this study was to compare the relative efficacy of three DNA extraction methods and oneof them commercial DNA extraction kit. Although these methods any kit have been tested separately by different researchers on various biological samples, this study further extends the knowledge by direct comparison and application to PCR. Obtaining high quality DNA depends on the type of chemicals and the isolation protocols used.
2. Material and Method
2.1. Plant material
Fresh leaft issue of wheat (Triticum aestivum L.) grown under greenhouse conditions was used for this study. For the extraction of DNA, the first two leaves of wheat seedlings of two weeks were used in equivalent amounts (100-150 mg). Leaf samples were ground into powder using liquid nitrogen.
2.2. DNA extraction
2.2.1. CTAB extraction
Genomic DNA was isolated from leaf samples for the CTAB based method with some modifications according to Doyle and Doyle 1987. The sample was mixed with CTAB buffer (2% CTAB 20 g CTAB/L, 20 mM EDTA, 100 mM Tris-HCl pH 8.0, 1.4 M NaCl, 0.2% Mercaptoethanol) and was vortexed after adding one unit of proteinase K to each sample. 10% SDS added then the samples were incubated for 60 min at 60C, after the incubation 1 U (20 mg/ml) proteinase K was added to the mixed. Added equal volume of chloroform/isoamylalcohol (24:1), mixed for about 15 min, then the samples were subjected to centrifugation at 16.000 xg for 10 min and supernatants were transferred to new centrifuge tubes. Precipitated DNA with 2/3 volume of cold isopropanol centrifuged at 10.000 xg for 20 min. Supernatants were discarded, pellets were dried at room temperature and added 1X TE buffer, then leave dovernight at 4C.The samples were incubated for 3 h at 65 °C and 20 μL RNase A (10 mg/mL) was added then incubated 1 h again. For extra pure isolation, added 400 ml chloroform/isoamylalcohol, and after centrifuged 10.000 xg for 10 min. The upper phase was transferred to new tube that was containing 100 l of 1.2 M NaCl. Sample mix was mixed with 0.6 volume of isopropanoland centrifuged at 20.000 xg for 10 min. The supernatant was discarded, and the pellet was dried then washed carefully with 500 ml of 70% ethanol without damaging the pellet. The DNA was then dissolved in 100 l of water. This method lasted 6 hours for a total of 2 days with the extra purification step for 10 samples.
2.2.2. Rapid salt-extraction
This method was modified based on the rapid salt DNA extraction of reported by Aljanabi and Martinez (1997). About 100-150 g fresh leaf tissue was used these method and it were homogenized with 400 L sterile homogenization salt buffer (0.4 M NaCl, 10 mM Tris-HCl pH 8.0 and 2 mM EDTA pH 8.0). 80 l of 10% SDS (2% final concentration) and 20 mg/ml proteinase K were added to the milled sample tubes and it were mixed well. Sample tubes were incubated at 60 °C for 2 hours, then 350 ml of 5 M NaCl was added, and vortexed 30 s at 20.000 xg. The samples were centrifuged for 30 min at 10.000 g and the supernatant was taken to fresh clean tubes. Equal volume of isopropanol was added to each sample and it were mixed well then incubate at -20 °C. The
centrifugation step was repeated at 10.000 g for 20 min at 4°C. The pellet was washed with 70% ethanol then allowed to dry. DNA was suspended with 100 l of ddH2O. The modified rapid salt DNA extraction method was lasted 3 h for 10 wheat leaf samples.
2.2.3. Plant genomic DNA isolation kit
The Thermo Scientific GeneJET Plant Genomic DNA isolation kit, commercially developed for the isolation of genomic DNA from tissues of various plants pecies, was used for wheat leaf samples in this study. Wheat DNA was isolated using a plant genomic DNA isolation kit according to the manufacturer's instructions. This DNA isolation kit uses silica based membrane technology in the form of a suitable spin column. In this extraction procedure, buffer conditions were prepared to remove carbohydrates, phenolic compounds and other plant metabolites. Silica based membrane design has been developed to provide adsorption of genomic DNA. In this method of isolation, the time for 10 samples is about 1-1.5 hours.
2.3. Spectrophotometric analyses
In the calculation of the purity (A260/280), (A60/A230) of genomic DNA samples, DeNovix NanoDrop Microvolume Spectrophotometer and 2 l DNA was used of each sample.
2.4. Agarose gel electrophoresis
DNA was visualized in 1% agarose gel electrophoresis (agarose, for molecular biology, SIGMA, gels for genomic and amplified DNA). For electrophoresis 1X Tris-Borate EDTA (TBE) buffer and 10 mg / mL Ethidium bromide (EtBr) were used. A constant voltage of 100 V was applied to the samples for 1 hour. ChemiDoc MPI maging system (Bio-Rad Laboratories Inc., Germany) was used to visualize DNA bands in agarose gel electrophoresis.
2.5. PCR amplification
In the last decade, SSR (microsatellite) markers play an increasing role in genetic and molecular studies (Yadav and Chand 2018). Randomly selected SSR markers known to be associated with drought in wheat were randomly selected from the previously reported SSR markers (Somers et al 2004, Sönmezoğlu and Terzi 2018). The sequences of the SSR marker used in the study are F-CGATACAAGGAAGACCAGCC and R-GGTTCGTCTGGTTCGCAAGT. For the SSR markers used, the DNA amplification reaction was performed in a total volume of 25 µl. For the PCR reaction mix, 10X Taq Buffer (2.5 μl), 2 μl of 10 mM dNTP mixture, 2 μl of MgCl2, 0.5 μl forward primer, 0.5 μl of reverse primer, 0.5 units of Taq polymerase (Thermo Fisher USA) and 3 μl template DNA were used then the volume was completed to 25 μl. PCR thermal cycling conditions were initial denaturation at 94 °C for 5 min, followed by 37 cycles of denaturing at 94 °C for 30 s, annealing at 58 °C for 30 s, extension at 72 °C for 45 s, with a final extension at 72 °C for 6 min. The amplified products were separated on 2% agarose gels and in 1X TBE buffer, electrophoresis was applied at 100 watt constant power for hours and DNA fragments were visualized under UV transilluminator using ChemiDoc MP Imaging system.
3. Results and Discussion
CTAB-based methods have been first introduced for extraction of DNA from plant leaves (Murray and Thompson 1980, Doyle and Doyle 1987). These methods were then modified to remove other impurities such as polysaccharides and phenolic compounds found in plant tissues (Sahu et al 2002, Khalik et al 2002, Abdel-Latif and Osman 2017). Several different DNA extraction methods used require long incubations, multiple precipitation steps, and ethanol washes to produce high purity genomic DNA, although PCR amplification is effective in isolating appropriate DNA. These additional applications reduce the overall yield and result in failure in the production of large amounts of high quality DNA.
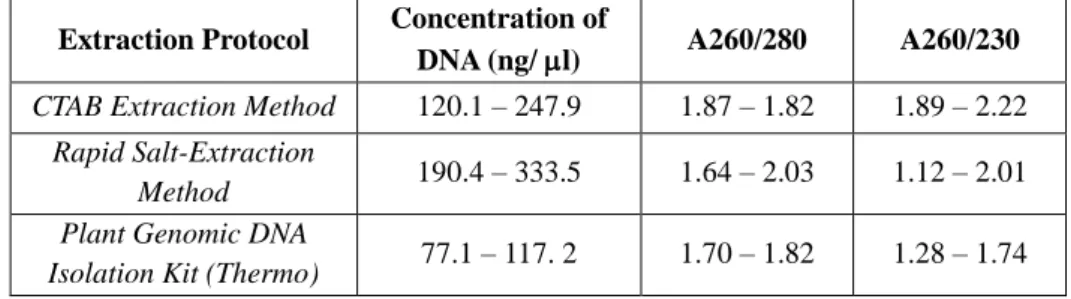
Because mature plant leaves contain higher amounts of polysaccharide and polyphenols, it is the first choice of young and fresh leaves of the plant to obtain better quality DNA (Sahu et al 2002). In this study, DNA from fresh leaf of wheat was extracted with three different methods. Quality analyzes for each extracted DNA sample were made by agarose gel images and NanoDrop Microvolume measurements. 260/280 ratio gives information about the purity and quality of DNA. For a quality DNA extraction, this ratio is expected to be the closest value to 1.8. A ratio of 1.8 is a degree of DNA showing high purity in the absence of protein and phenolic compounds. As this ratio approaches 2, RNA contamination is found. For each method, experiments were carried out with the same samples, three replications were used and all samples were suspended in the last extraction step with water. Table 1 summarizes the DNA quality and purity range obtained for all samples using three extraction methods. It was determined that 260/280 ratio changed between 1.64 and 2.03 and the 260/230 ratio changed between 1.12 and 2.28.
Table 1. Comparison of DNA concentration and purity extracted with different methods
Extraction Protocol Concentration of
DNA (ng/ l) A260/280 A260/230
CTAB Extraction Method 120.1 – 247.9 1.87 – 1.82 1.89 – 2.22
Rapid Salt-Extraction
Method 190.4 – 333.5 1.64 – 2.03 1.12 – 2.01 Plant Genomic DNA
260/280 ratio was determined in the CTAB extraction method in the optimum purity range (1.82 - 1.87). For salt extraction method, values higher than 1.8 are generally obtained (1.89 - 2.03). The 260/280 ratio between 1.93 and 2.27 is the level of contamination at the insignificant levels resulting from protein and polysaccharides (Pervaiz et al 2015). In the commercial kit extraction method, this ratio is at least 1.70 and the highest 1.82 range shows the optimum DNA purity rate and a small amount of protein contamination. A purity ratio of> 1.9 indicates the presence of RNA in the sample, while a ratio of <1.7 in several DNA samples extracted by the commercial kit method indicates the presence of proteins in these samples (Abdel-Latif and Osman 2017).
Cristina et al (2017) were tested four DNA isolation methods (SDS1, SDS2, SDS3 and CTAB) for wheat, barley and rye samples in their study. The DNA quality was determined by gel electrophoresis, PCR reactions and spectrophotometric measurements. They also used SSR and ISSR markers in PCR reactions for with the genotypic studies. Their results showed that, a A260/280 ratio was between 1.6-1.9, and the concentrations ranged between 20-194 ng/l. According to electroforetic results, SDS2 method was showed better DNA fragments but for the spectrophometric results CTAB method had better A260/280 ratio. These results are agreement with our findings which showed that CTAB method was better A260/A280 ratio.
The 260/230 ratio is a second factor in the determination of DNA purity. High absorbance at 230 nm can result from carbohydrates and some organic solvents such as phenol. For a pure nucleic acid, 260/230 values are generally higher than 260/280 (~1.8). The expected 260/230 values for pure nucleic acid range of from 2.0 to 2.2. This rate is lower than expected indicates the presence of contaminants. In CTAB extraction method 260/230 ratio was measured between 1.89 and 2.22. These values are higher than the measured 260/280 for CTAB extraction and are in the expected range except for one sample. High amounts of β-mercaptoethanol have been reported to be successful in eliminating polyphenols (Khanuja et al 1999). Therefore, in the CTAB protocol, mercaptaethanol was used for high quality extraction of DNA. The addition of NaCl together with CTAB in high concentrations is known to be effective in removing polysaccharides in plant tissue (Moreira and Oliveira 2011). For rapid salt and commercial kit extraction method, 260/230 is generally less than 2, except for a few samples. According to these results, although differences used in the extraction method and the phenolic chemicals, there are phenol residues or carbohydrate pollution at the nucleic acid concentration in rapid salt and commercial kit methods.
The degree of purity alone is not sufficient for successful DNA amplification, as well as the concentration values, need consideration (Abouseadaa et al 2015). As indicated in Table 1, the DNA concentration values are sufficient for each of the three extraction methods and the highest values for the two extraction methods belong to the salt extraction method (333.5 - 190.43 ng/l). The lowest concentration values in the three extraction methods belong to the commercial kit DNA extraction (77.1 - 117.2 ng/l).
If the comparison of all three methods time; with the extra purification step CTAB DNA extraction method has lasted 5 to 6 h, rapid salt DNA extraction method 3 h, and isolation of commercial DNA extraction kit took ~1 h for about 10 samples.
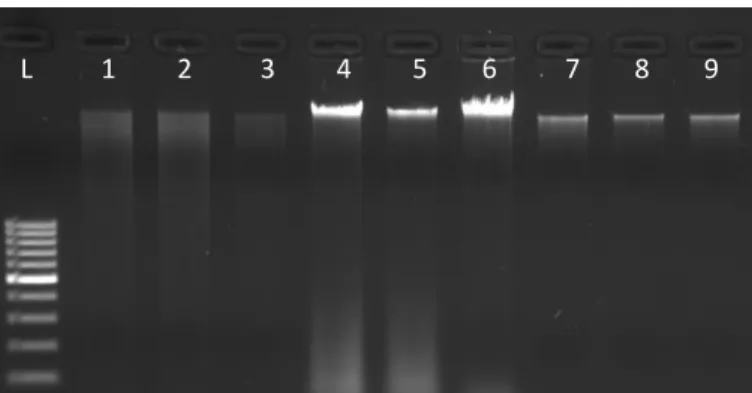
Agarose gel electrophoresis found in almost all molecular biology laboratories is an effective and inexpensive way of separating nucleic acids (Lee et al 2012). DNA samples obtained from three different DNA isolates were visualized in 1% agarose gel electrophoresis. According to the DNA samples shown in Figure 1, high molecular weight, clear and single DNA bands were observed for all extraction methods. However, band profiles originating from protein contamination are observed in the DNA samples of the rapid salt extraction method.
Figure 1. Agarose gel electrophoresis of DNA extracted using different methods of extraction. L, 100 bp Ladder (Thermo); Lane 1,
Lane 2, and Lane 3 shows the isolated DNA by the CTAB method described by Doyle and Doyle [4]; Line 4-6 shows rapid salt DNA extraction method described by Aljanabi and Martinez [8]; The line 7 to 9 shows the isolated DNA by GeneJET Plant Genomic DNA isolation kit respectively.
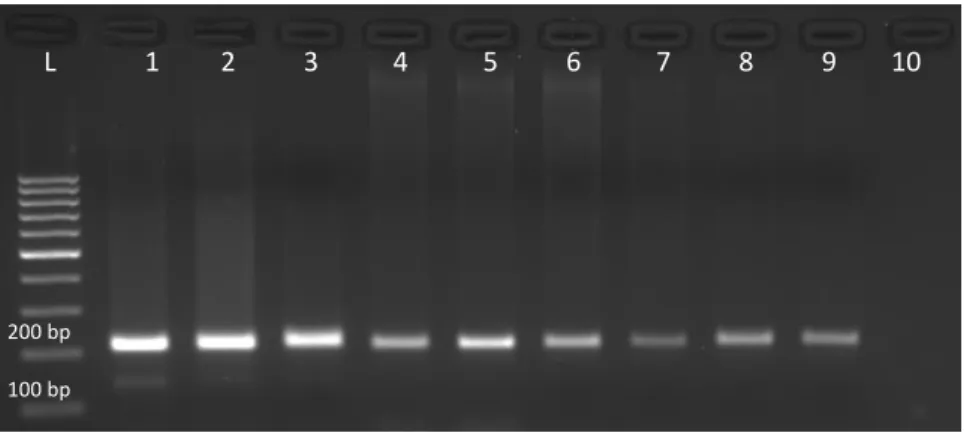
For PCR methods, the DNA should be of sufficient quality and concentration (Sönmezoğlu and Keskin 2015). The results of PCR amplification of genomic DNA isolated from wheat using three different extraction methods show in Figure 2. According to the agarose gel image obtained by PCR reaction, the most bright and dense bands were belong to the CTAB reaction and the bands, while the lowest density and clarity were DNA samples of commercial kit isolation. This is because the concentrations of DNA samples of the CTAB reaction are higher than the kit extraction method. Nevertheless, in the SSR study, clean PCR bands were observed for all
three DNA extraction methods according to the known base pair range (~200 bp) of the genetic marker used. No inhibition of Taq DNA polymerase activity was observed in any isolation protocol for the PCR reaction.
Figure 2. Agarose gel electrophoresis of PCR products of wheat DNA samples extracted with different methods. CTAB extraction
method (lines 1-3), Rapid salt DNA extraction method (lines 4-6), and commercial DNA extraction method (lines 7-9). Line 10, Negative control; Line L, marker 100 bp DNA Ladder (Thermo).
4. Conclusions and Recommendations
In this study, three different DNA isolation protocols which can be used efficiently in SSR based PCR reaction in wheat were compared. Among the isolation protocols used in the study, the modified CTAB method was found to be effective in obtaining better quality DNA. Although the highest value in terms of DNA quality belongs to the CTAB method, no contamination was found in the PCR performed with commercial kit and rapid salt extraction and also clean and desired band profiles were obtained. It is important to obtain DNA of appropriate quality for PCR and other molecular techniques in a short time in breeding studies involving marker assisted selection methods, in particular where large species populations are used. For this purpose, the commercial kit DNA extraction method is more advantageous in that it allows more DNA isolation in a shorter time. The salt DNA extraction method is advantageous in that it allows for a safer and less costly genomic DNA extraction by eliminating the use of expensive liquid nitrogen and environmentally hazardous phenol. However, in this study, lower quality DNA was obtained with salt prococol than other methods. For this reason, it may be advisable to add extra purification steps for obtaining high quality DNA.
References
Abdel-Latif, A., & Osman, G. (2017). Comparison of three genomic DNA extraction methods to obtain high DNA quality from maize. Plant Methods, 13(1), 1.
Abouseadaa, H. H., Osman, G. H., Ramadan, A. M., Hassanein, S. E., Abdelsattar, M. T., Morsy, Y. B., & Gad, A. A. (2015). Development of transgenic wheat (Triticum aestivum L.) expressing avidin gene conferring resistance to stored product insects. BMC plant biology, 15(1), 183.
Aljanabi, S. M., & Martinez, I. (1997). Universal and rapid salt-extraction of high quality genomic DNA for PCR-based techniques. Nucleic acids research, 25(22), 4692-4693.
Chai, J. F., Liu, X., & Jia, J. Z. (2006). A rapid isolation method of wheat DNA suitable for PCR analysis. Journal of Plant Genetic Resources, 7(2), 246-248.
Cristina, D., Ciuca, M., & Cornea, C. P. (2017). Comparison of four genomic DNA isolation methods from single dry seed of wheat, barley and rye. AgroLife Scientific Journal, 6(1), 84-91.
Dilworth, E., & Frey, J. E. (2000). A rapid method for high throughput DNA extraction from plant material for PCR amplification. Plant Molecular Biology Reporter, 18(1), 61-64.
Doyle J.J., & Doyle J. L. (1987). A rapid DNA isolation procedure for small quantities of fresh leaf tissue, Phytochem. Bull., 9, 11-15. Kadry, A. K., Gamal, O., & Waeil, A. A. (2012). Genetic diversity and taxonomic relationships of some'Ipomoea'species based on
analysis of RAPD-PCR and SDS-PAGE of seed proteins. Australian Journal of Crop Science, 6(6), 1088.
Khanuja, S. P., Shasany, A. K., Darokar, M. P., & Kumar, S. (1999). Rapid isolation of DNA from dry and fresh samples of plants producing large amounts of secondary metabolites and essential oils. Plant Molecular Biology Reporter, 17(1), 74-74.
Lee, P. Y., Costumbrado, J., Hsu, C. Y., Kim, Y. H. (2012). Agarose gel electrophoresis for the separation of DNA fragments. Journal of Visualized Experiments, (62), 3923.
Moreira, P. A., & Oliveira, D. A. (2011). Leaf age affects the quality of DNA extracted from Dimorphandra mollis (Fabaceae), a tropical tree species from the Cerrado region of Brazil. Genetics and Molecular Research, 10(1), 353-358.
L 1 2 3 4 5 6 7 8 9 10
200 bp
Murray, M. G., & Thompson, W. F. (1980). Rapid isolation of high molecular weight plant DNA. Nucleic acids research, 8(19), 4321-4326.
Paris, M., & Carter, M. (2000). Cereal DNA: a rapid high-throughput extraction method for marker assisted selection. Plant Molecular Biology Reporter, 18(4), 357-360.
Plaschke, J., Ganal, M. W., & Röder, M. S. (1995). Detection of genetic diversity in closely related bread wheat using microsatellite markers. Theoretical and Applied Genetics, 91(6-7), 1001-1007.
Pervaiz, Z. H., Turi, N. A., Khaliq, I., Rabbani, M. A., & Malik, S. A. (2011). Methodology: a modified method for high-quality DNA extraction for molecular analysis in cereal plants. Genetics and molecular research: GMR, 10(3), 1669-1673.
Röder, M. S., Plaschke, J., König, S. U., Börner, A., Sorrells, M. E., Tanksley, S. D., & Ganal, M. W. (1995). Abundance, variability and chromosomal location of microsatellites in wheat. Molecular and General Genetics MGG, 246(3), 327-333.
Sahu, S. K., Thangaraj, M., & Kathiresan, K. (2012). DNA extraction protocol for plants with high levels of secondary metabolites and polysaccharides without using liquid nitrogen and phenol. ISRN Molecular Biology, 2012.
Somers, D. J., Isaac, P., & Edwards, K. (2004). A high-density microsatellite consensus map for bread wheat (Triticum aestivum L.). Theoretical and Applied Genetics, 109(6), 1105-1114.
Sönmezoğlu, Ö. A., & Keskin, H. (2015). Determination of genetically modified corn and soy in processed food products. Journal of Applied Biology & Biotechnology, 3, 32-37.
Sönmezoğlu, Ö. A., & Terzi, B. (2018). Characterization of some bread wheat genotypes using molecular markers for drought tolerance. Physiology and molecular biology of plants, 24(1), 159-166.
Varma, A., Padh, H., & Shrivastava, N. (2007). Plant genomic DNA isolation: an art or a science. Biotechnology Journal: Healthcare Nutrition Technology, 2(3), 386-392.
Yadav, M. K., & Chand, P. (2018). Assessment of Genetic Diversity among Twenty Indian Wheat (Triticum aestivum L.) Cultivars using Simple Sequence Repeat (SSR) Markers. Int. J. Curr. Microbiol. App. Sci, 7(3), 1708-1717.