ORIGINAL RESEARCH
ADULT BRAIN
Prognostic Value of Dynamic Susceptibility Contrast-Enhanced
and Diffusion-Weighted MR Imaging in Patients with
Glioblastomas
X G. C¸oban, S. Mohan, F. Kural, S. Wang, D.M. O’Rourke, and H. PoptaniABSTRACT
BACKGROUND AND PURPOSE: Prediction of survival in patients with glioblastomas is important for individualized treatment planning.
This study aimed to assess the prognostic utility of presurgical dynamic susceptibility contrast and diffusion-weighted imaging for overall survival in patients with glioblastoma.
MATERIALS AND METHODS: MR imaging data from pathologically proved glioblastomas between June 2006 to December 2013 in 58
patients (mean age, 62.7 years; age range, 22– 89 years) were included in this retrospective study. Patients were divided into long survival (ⱖ15 months) and short survival (⬍15 months) groups, depending on overall survival time. Patients underwent dynamic susceptibility contrast perfusion and DWI before surgery and were treated with chemotherapy and radiation therapy. The maximum relative cerebral blood volume and minimum mean diffusivity values were measured from the enhancing part of the tumor.
RESULTS: Maximum relative cerebral blood volume values in patients with short survival were significantly higher compared with those
who demonstrated long survival (P⬍ .05). No significant difference was observed in the minimum mean diffusivity between short and long survivors. Receiver operator curve analysis demonstrated that a maximum relative cerebral blood volume cutoff value of 5.79 differen-tiated patients with low and high survival with an area under the curve of 0.93, sensitivity of 0.89, and specificity of 0.90 (P⬍ .001), while a minimum mean diffusivity cutoff value of 8.35⫻ 10⫺4mm2/s had an area under the curve of 0.55, sensitivity of 0.71, and specificity of 0.47
(P⬎ .05) in separating the 2 groups.
CONCLUSIONS: Maximum relative cerebral blood volume may be used as a prognostic marker of overall survival in patients with
glioblastomas.
ABBREVIATIONS:EGFR⫽ epidermal growth factor receptor; GBM ⫽ glioblastoma; MD ⫽ mean diffusivity; MDmin⫽ minimum mean diffusivity; rCBV ⫽ relative cerebral blood volume; rCBVmax⫽ maximum relative cerebral blood volume
G
lioblastomas (GBMs) are the most common malignant tu-mors of the central nervous system in adults, representing 50% of all gliomas and 20% of all intracranial solid lesions.1Theprognosis of GBM is poor, and median overall survival is⬍1 year.2Even in optimal conditions (young patients treated by
rad-ical surgery, radiation therapy, and chemotherapy), death usually occurs within 2 years.3,4Several factors, both clinical (age,
perfor-mance status) and therapeutic (extent of surgery, radiation
ther-apy, chemotherapy), as well as specific tumor characteristics such as location and nature (de novo or secondary from a low-grade glioma)5,6have been studied as potential prognostic markers of
overall survival with variable degrees of sensitivity and specificity. Recently, tumor genetics is also being investigated as a prognostic index.7,8
Conventional MR imaging is widely used as the technique of choice for GBM diagnosis and also has an important role in mon-itoring disease progression and response to therapy for patients with GBM. Additional advanced imaging techniques, such as rel-ative cerebral blood volume (rCBV) obtained from dynamic sus-ceptibility contrast perfusion imaging, have been used to predict glioma grade9-11and assess treatment response.12A recent
re-port10indicated that maximum relative cerebral blood volume
(rCBVmax) can be used as a predictive marker of progression-free
survival in patients with gliomas, regardless of the tumor grade. Similar to perfusion imaging, diffusion-weighted imaging has also been used for diagnosis of tumors. Tumors with high
cellu-Received August 29, 2014; accepted after revision December 14.
From the Department of Radiology (G.C¸., F.K.), Baskent University School of Medi-cine, Ankara, Turkey; and Departments of Radiology (G.C¸., S.M., F.K., S.W., H.P.) and Neurosurgery (D.M.O.), University of Pennsylvania, Philadelphia, Pennsylvania. G. C¸oban and S. Mohan contributed equally to this work.
Please address correspondence to Harish Poptani, PhD, Department of Cellular and Molecular Physiology, University of Liverpool, 2/012 Nuffield Building, Crown St, Liverpool L69 3BX, UK; e-mail: [email protected]
Indicates article with supplemental on-line tables. http://dx.doi.org/10.3174/ajnr.A4284
larity demonstrate restricted diffusion and thus low mean diffu-sivity (MD) or apparent diffusion coefficient, which inversely cor-relates with tumor cellularity.13,14Areas with minimum mean
diffusivity (MDmin) reflect the sites of highest cellularity, and
tu-mors with a low MD tend to have a poor prognosis.15-18
Radiation therapy and chemotherapy with temozolomide have become the standard of care in the treatment of GBM and have demonstrated increased survival benefits in patients with newly diagnosed GBM.19However, several clinical trials,
includ-ing blockinclud-ing the tyrosine kinase activity of epidermal growth fac-tor recepfac-tor (EGFR),20,21using competitive and noncompetitive
kinase inhibitors in combination with radiation and temozolo-mide,20,21and using monoclonal antibodies,20are also
investigat-ing the treatment of GBMs. The exact value of each of these ther-apeutic strategies remains investigative though. The overall survival of patients with glioblastomas varies significantly,17,18
and it is imperative to know which patients will do better or worse, preferably before initiation of treatment, by using a noninvasive imaging method, so as to tailor fit the therapy for the best man-agement and hopefully increased survival. We have evaluated the role of DSC-MR imaging and DWI as potential prognostic imag-ing markers in patients with GBM with an eventual goal of usimag-ing these parameters in the selection of the optimal treatment option for these patients.
MATERIALS AND METHODS
MR Imaging
This retrospective study was approved by the institutional review board and was compliant with the Health Insurance Portability and Accountability Act. A total of 564 treatment-naïve patients diagnosed with GBM at the University of Pennsylvania from June 2006 to December 2013 were retrospectively reviewed. Because we were interested in evaluating the role of perfusion-weighted imaging and diffusion-weighted imaging, we excluded the cases in which the PWI or DWI scans were not available. In addition, we analyzed the pretreatment MR imaging scans of only those pa-tients who had gross total resection of their tumors so that the extent of surgery was not a confounder in the analysis. Further-more, we also excluded all GBMs with oligodendroglial features. Of the 564 cases reviewed, 58 patients (32 men and 26 women; mean age, 62.71⫾ 13.2 years; age range, 22–89 years) with a pathologically proved GBM met our inclusion criteria and were included in the study. After surgery, all the patients were treated with chemotherapy and radiation therapy.
We used a 15-month overall survival as the cutoff to evaluate rCBVmaxand MDminas predictive markers because several
previ-ous studies have reported a median overall survival time of 12–15 months for patients with GBM.2,18,19Thus, the 58 patients in our
study were divided into 2 groups: patients having long survival (n⫽ 30, patients who had an overall survival of ⱖ15 months) and short survival (n⫽ 28, patients who had an overall survival of ⬍15 months). The survival time was calculated as the time (in months) from the initial date of diagnosis until the date of death. The clinical symptoms, survival duration, Karnofsky score, and lesion diameter of the patients demonstrating short and long survival are reported in On-line Tables 1 and 2. The MR images acquired before surgery (⬍1 week) were evaluated in this study.
All MR images were obtained on a 3T clinical MR imaging system (Tim Trio; Siemens, Erlangen, Germany), equipped with a 12-channel phased array head coil. The imaging protocol in-cluded a 3-plane scout localizer, axial 3D T1-weighted magneti-zation-prepared rapid acquisition of gradient-echo images by us-ing the followus-ing parameters: TR, 1760 ms; TE, 3.1 ms; TI, 950 ms; matrix size, 192⫻ 256; FOV, 25 ⫻ 25 cm2; and 1-mm section
thickness; and FLAIR images with TR, 9420 ms; TE, 141 ms; TI, 2500 ms; matrix size, 192⫻ 256; and 3-mm thick contiguous sections with no gap. DWI data were acquired by using a single-shot spin-echo echo-planar imaging sequence with parallel imag-ing by usimag-ing a generalized autocalibratimag-ing partially parallel acqui-sition and an acceleration factor of 2. Other sequence parameters were as follows: FOV⫽ 22 ⫻ 22 cm2; b⫽0, 1000 s/mm2; section
thickness, 3 mm; number of sections, 40; acquisition time, 8 minutes.
For dynamic susceptibility contrast imaging, a bolus of gado-benate dimeglumine (MultiHance; Bracco Diagnostics, Prince-ton, New Jersey) was injected as the preloading dose of 0.07 mmol/kg. The preloading dose was administered to reduce the effect of contrast agent leakage on CBV measurements. A DSC T2*-weighted gradient-echo, echo-planar sequence was obtained during the second 0.07-mmol/kg bolus of intravenous contrast agent. The injection rate was 5 mL/s for all patients and was im-mediately followed by a bolus injection of saline (total of 20 mL at the same rate). DSC sequence parameters included the following: TR/TE, 2000/45 ms; FOV, 22 ⫻ 22 cm2; in-plane resolution,
1.72⫻ 1.72 ⫻ 3 mm3; slab of 20 sections covering the tumor
region; and acquisition time of 1 minute 38 seconds. A long TR and a low flip angle were used to reduce the effect of changes in T1 relaxation from contrast agent leakage.22Post-contrast-enhanced
T1-weighted MPRAGE images were acquired after completion of the DSC sequence.
Image Processing
The rCBV was calculated from PWI data by using the intravascu-lar indicator dilution algorithms described previously.23-25Data
processing was performed by using PWI Task Card (Massachu-setts General Hospital, Boston, Massachu(Massachu-setts) on a Leonardo workstation (Siemens). MD maps were automatically generated by using the software tools available on the scanner by using a monoexponential fit to the multiple b-value images. Measure-ments were obtained by 2 radiologists (G.C¸. and F.K., with⬎4 years of experience reading brain MR imaging). We meticulously chose multiple ROIs from the enhancing part of the tumor, avoid-ing areas of cerebral blood vessels, calcifications, hemorrhage, and CSF-filled sulci to measure a reliable CBV value as proposed ear-lier.26-27The ROIs were drawn and chosen in agreement by the 2
readers, thereby reducing any interobserver variability. The com-monly used rCBVmaxparameter
28was computed by calculating
the mean CBV values from 3 circular ROIs measuring 30 –50 mm2
from areas of visually high CBV as reported previously.26-27For
normalization, 3 circular ROIs of the same size were drawn in the contralateral normal-appearing white matter. A similar analysis method was used to investigate the minimum mean diffusivity. Three circular ROIs measuring 30 –50 mm2from the visually
low-est MD values were used to compute MDmin, representing high
cellularity as reported previously.13,17
Statistical Analysis
The long and short survival patient groups were compared by using a Student t test. A P value⬍ .05 was considered significant. A receiver operating characteristic analysis was performed to eval-uate the predictive power of rCBVmaxand MDminfor overall
sur-vival. Areas under the curve were computed. A cutoff value for each parameter was determined by maximizing the sum of sensi-tivity and specificity. Kaplan-Meier survival curves were used to characterize and compare the groups with high-versus-low rCBVmax
and high-versus-low MDminin terms of overall survival. All
sta-tistical analyses were conducted by using PASW Statistics, Ver-sion 18 (IBM, Armonk, New York).
RESULTS
Representative images of patients with GBM with long and short survival are shown in Fig 1. The contrast-enhanced T1-weighted images and FLAIR images from these patients look similar, showing heterogeneous peripheral enhancement and extensive surrounding FLAIR signal abnormality. All tumors showed prominent enhancement after IV contrast
administra-tion. The patient with short survival demonstrated higher rCBVmax compared with the patient who exhibited long
survival.
The rCBVmaxvalues of patients with short survival (9.90⫾
4.01) were significantly higher compared with those of long sur-vival (4.78⫾ 1.30, P ⬍ .05). There was no significant difference in the MDminvalues between the 2 groups: 0.80⫾ 0.17 versus 0.75 ⫾
0.15⫻ 10⫺3mm2/s (Table).
Receiver operating characteristic analysis indicated that a rCBVmaxcutoff value of 5.79 was the best parameter for
predict-ing overall survival with an area under the curve of 0.93, sensitivity of 0.89, specificity of 0.90, positive predictive value of 0.89, and negative predictive value of 0.90 (Fig 2 and Table). The MDmin
cutoff value of 8.35⫻ 10⫺4mm2/s, on the other hand, showed
only a modest area under the curve of 0.55, sensitivity of 0.71, specificity of 0.47, positive predictive value of 0.56, and negative predictive value of 0.64 (Fig 2 and Table). A combination of rCB-Vmaxand MDmindid not improve the prediction capability and
had an area under the curve (0.93) similar to that of rCBVmax.
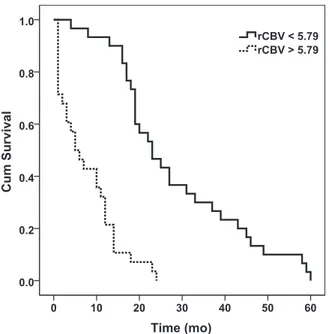
Kaplan-Meier survival curves demonstrated that GBMs with low rCBVmax(⬍5.79) had a median survival time of 23 ⫾ 3.4 months,
whereas GBMs with high rCBVmax(ⱖ5.79) had a median survival
time of 5⫾ 1.9 months (Fig 3). There was a significant difference in patients with high rCBVmaxand low
rCBVmax(P⬍ .001). For the DWI
mea-surements, GBMs with low MDmin
(⬍8.35 ⫻ 10⫺4mm2/s) had a median
survival time of 14 ⫾ 2.0 months, whereas GBMs with high MDmin
(⬎8.35 ⫻ 10⫺4mm2/s) had a median
sur-vival time of 18⫾ 1.4 months, and there was no significant difference between the 2 groups (P⬎ .05) (Fig 4).
DISCUSSION
Our study suggests that pretreatment rCBVmax can be used as a prognostic
marker for overall survival in patients with GBM. In particular, patients with high pretreatment rCBVmax
demon-strated lower survival in comparison with patients with low pretreatment rCBVmax, who exhibited longer survival
of⬎15 months. These results could have a potential clinical benefit and in the future may aid in individualized treat-ment planning because patients with high pretreatment rCBVmaxcan be
of-fered upfront alternative treatment FIG 1. Representative MR images and parametric maps from patients with GBM. The top row
(A–D) shows images from a 66-year-old woman with GBM who survived for⬎58 months after gross total resection of her GBM in the left temporo-occipital lobe. Representative MR images from a 75-year-old man with a GBM in the left parietal lobe with only a 5-month survival are shown (E–H). Images of both patients demonstrate heterogeneous peripheral enhancement (A and E) and extensive surrounding FLAIR signal abnormality (B and F) on axial contrast-enhanced T1-weighted and FLAIR images, respectively. The patient with short survival has a higher CBV (G) (rCBVmax⫽ 12.22) in comparison with the patient with long survival (C) (rCBVmax⫽ 3.57). The MD maps from these patients (D and H) do not show any difference (6.50⫻ 10⫺4mm2/s versus 6.80⫻
10⫺4mm2/s).
Averageⴞ SD, sensitivity, specificity, PPV, and NPV of pretreatment rCBVmaxand MDminin patients with GBM demonstrating long (>15 mo) survival and short (<15 mo) survival
Long Survival (n = 30) Short Survival (n = 28)
Cutoff AUC Sensitivity Specificity PPV NPV
Meanⴞ SD Meanⴞ SD
rCBVmax 4.78⫾ 1.30 9.90⫾ 4.01a 5.79 0.93 0.89 0.90 0.89 0.90
MDmin(10⫺3mm2/s) 0.80⫾ 0.17 0.75⫾ 0.15 0.83 0.55 0.71 0.47 0.56 0.64 Note:—NPV indicates negative predictive value; PPV, positive predictive value; AUC, area under the curve.
aP⬍ .01.
strategies, including bevacizumab, immunotherapy, or other therapies targeted toward increased survival.
Conventional imaging characteristics of GBM, including loca-tion, size, and degree of enhancement; necrosis; and extent of edema, have been studied for prediction of survival.9-11,29-36
Al-though contrast enhancement is generally used to estimate the extent of the tumor, it is clear from the literature that convtional radiologic findings, such as the absence of contrast en-hancement, are not only poor predictors of tumor grade but may
or may not be prognostic factors for either survival or progres-sion-free survival.12,37PWI is increasingly being used to assess
microvascular changes associated with the tumor grade, and it is widely used to assess tumor angiogenesis and microvascula-ture.34,35,38 Law et al30suggested that rCBV measurements in
low-grade gliomas correlated more accurately with time to pro-gression than the initial histopathologic grading of the tumor. Although Oh et al18suggested that rCBV had no predictive value
with respect to the prognosis in GBM, they evaluated GBM tu-mors after surgical resection; thus, it is unclear whether the extent of surgery played a role in determining the prognostic value in their study.18Bisdas et al11reported that there was no correlation
among CBV, World Health Organization grade, and progression-free survival in a mixed population of gliomas. Similar to ours, findings of Mangla et al32were that rCBV was useful for
predict-ing progression-free survival in anaplastic astrocytomas, but not for grade III tumors with oligodendroglial components.
We observed that an rCBVmaxthreshold value of 5.79 was the
best predictor for overall survival with a very high sensitivity and specificity. In other words, this threshold was evaluated as a prog-nostic index of survival in GBM and not for predicting tumor grade, for which a much lower rCBV threshold was reported by Bisdas et al11(4.2), Lev et al29(1.5), Law et al31(1.75), and Mangla
et al32(2.55).
High-grade brain tumors are usually associated with high cel-lularity and therefore exhibit low MD values.15-17Previous
stud-ies15,16,39reported that MD
minwas a sensitive marker for
prog-nosis and survival. The cutoff MD values used in these studies were 0.74⫻ 10⫺3mm2/s, 0.90⫻ 10⫺3mm2/s, 0.93 ⫻ 10⫺3
mm2/s, and 1.00⫻ 10⫺3mm2/s, respectively.15-18Higano et al16
studied 37 malignant astrocytic tumors, including 22 GBMs, and reported a significant negative correlation between MDminand
FIG 2. Receiver operative characteristic curves of rCBVmax(solid line)
by using a rCBVmaxcutoff value of 5.79. The area under the curve was 0.93. The receiver operating curve of MDmin(dotted line) by using a
cutoff value of 8.35⫻ 10⫺4mm2/s demonstrated only a modest area
under the curve of 0.55.
FIG 3. Kaplan-Meier curves for patients with low (⬍5.79, solid line)
and high (ⱖ5.79, dotted line) rCBVmax. GBMs with low rCBVmaxhad a
median survival time of 23⫾ 3.4 months, whereas GBMs with high rCBVmaxhad a median survival time of 5⫾ 1.9 months (P ⬍ .001). Cum
indicates cumulative.
FIG 4. Kaplan-Meier curves for patients with GBM with low
(⬍0.835 ⫻ 10⫺3mm2/s, solid line) and high (ⱖ0.835 ⫻ 10⫺3mm2/s,
dotted line) MDmin. GBMs with a low MDminhave a median survival
time of 14⫾ 2.0 months, whereas GBMs with a high MDminhave a median survival time of 18⫾ 1.4 months. There is no significant differ-ence between the 2 groups (P⬎ .05). Cum indicates cumulative.
Ki-67, which may explain the poor prognosis of patients with lower MDmin. The authors of that study also reported that the
MDmin (0.834⫻ 10⫺3mm
2/s) of GBM was significantly lower
than the MDmin(1.06⫻ 10⫺3mm2/s) of anaplastic astrocytomas.
In another study, Murakami et al15studied 79 malignant
supra-tentorial astrocytic tumors, including 50 patients with GBMs, and observed that patients with an MDminof⬎1.00 ⫻ 10⫺3mm
2/s
had better outcomes than patients with an MDminofⱕ1.00 ⫻
10⫺3mm2/s. Yamasaki et al39reported that MD
minalso predicted
overall survival in patients with GBMs who did not have a com-plete- or near-total resection of their tumors. We did not observe an MDmincutoff value that could differentiate patients having
short or long survival (Fig 4). However, in comparison with these previous studies, we studied a homogeneous population of pa-tients with GBMs who had undergone gross total resection of their tumors, which may partially explain the difference in our results.
Because GBM is composed of prominent necrosis, nuclear atypia, cellular proliferation, and microvascular hyperplasia, the extent of necrosis and the amount of edema have been shown to negatively correlate with survival.5,40 Immunohistochemical
staining for p53, Ki-67, and EGFR is generally used for differential diagnosis and grading of these tumors.41Previous studies have
shown that abnormal microvasculature may be associated with increased endothelial cellularity, proliferation, and tumor grade.42,43Tumors with increased EGFR, Ki-67, and p53 staining
are more invasive and exhibit a more malignant phenotype. A tumor-specific mutant of the EGFR, EGFRvIII, causes constitu-tive upregulation of the tyrosine kinase activity of the receptor and is frequently expressed in primary GBMs. EGFR signaling has, therefore, been the target for GBM therapy. It is also possible that rCBV measurements are revealing changes in microvascular attenuation that precede malignant transformation44and may be
indicative of poor prognosis as demonstrated in our study. Previous survival analysis studies for patients with brain tu-mors have evaluated several factors: tumor grade, extent of resec-tion, radiation dose, age, and Karnofsky score.5,6Based on the
results of some prospective clinical trials that evaluated patients with gliomas, the important prognostic factors for predicting out-come in gliomas are the extent of surgical resection, histologic results, and size of the lesion.12,45,46Tumors not involving
elo-quent regions of the brain undergo gross total resection because it has been shown that maximal resection improves survival in pa-tients with gliomas.12,45,46 Preoperative knowledge of the
rCBVmaxof a tumor may help to determine whether to biopsy or
to resect, the aggressiveness of resection, the use of pre-/postop-erative adjuvant radiation therapy and chemotherapy, and the frequency of follow-up examinations.
Although our study indicates the role of pretreatment rCBVmaxas a potential imaging biomarker for predicting survival
in GBM, the results should be interpreted in light of the limita-tions of the study. One was the use of hand-drawn ROIs for data analysis, which, though being simple and straightforward, tend to be subjective. Future studies involving semiautomated segmenta-tion routines47,48may be needed to analyze the data more
objec-tively without any user bias. In addition, we did not evaluate other perfusion variables from the DSC data, such as cerebral blood
flow and mean transit time values. Increasing the TR is only one of the methods to reduce the effects of T1, but it comes with a penalty of increased acquisition time. In addition to the simplistic mea-surements of MDmin, other parameters from diffusion imaging
can be computed, such as fractional anisotropy and radial and axial diffusivity. It would be desirable to perform a multivariate analysis by using these varied imaging parameters to evaluate whether these additional parameters further increase the sensitiv-ity and specificsensitiv-ity in the overall prognosis of patients with GBM. The study was performed retrospectively, and the sample size for the Kaplan-Meier analysis was relatively small. The survival of patients with GBM can also be affected by other factors such as the location, tumor size, and Karnofsky score. A larger sample size would be necessary to perform a Kaplan-Meier analysis of the rCBVmaxaccounting for these confounding factors. We have
lim-ited the number of confounders, including selection of pure GBM (excluding patients with oligodendroglial features) and selection of patients with near-total resection of the mass, and restricted the analysis to tumors with a similar initial size in the 2 groups. A prospective study on a larger cohort of patients with GBM needs to be performed to further establish rCBV as a marker for overall survival in GBM.
CONCLUSIONS
Our results indicate that pretreatment rCBVmaxmay be a used as
a sensitive prognostic marker for overall survival in patients with glioblastomas.
Disclosures: Donald M. O’Rourke—UNRELATED: Medicolegal opinions, clinical neu-rosurgery only; Grants/Grants Pending: National Institutes of Health,* Comments: 1) RO1 and R21 applications on glioblastoma pathobiology and imaging; 2) Celldex Ther-apeutics sponsored imaging research, EGFRvIII and glioblastoma; Patents (planned, pending or issued): issued US patent,* Comments: EGFR/radiation treatment, issued December 1, 2009, US patent No. 7,625,558. Harish Poptani—UNRELATED: Consul-tancy: American College of Radiology, Image Metrix; Grants/Grants Pending: Na-tional Institutes of Health.* *Money paid to the institution.
REFERENCES
1. Ohgaki H, Kleihues P. Epidemiology and etiology of gliomas. Acta
Neuropathol 2005;109:93–108
2. Behin A, Hoang-Xuan K, Carpentier AF, et al. Primary brain
tu-mours in adults. Lancet 2003;361:323–31
3. Stark AM, Nabavi A, Mehdorn HM, et al. Glioblastoma multiforme:
report of 267 cases treated at a single institution. Surg Neurol
2005;63:162– 69
4. Kleihues P, Ohgaki H. Primary and secondary glioblastomas: from
concept to clinical diagnosis. Neuro Oncol 1999;1:44 –51
5. Lacroix M, Abi-Said D, Fourney DR, et al. A multivariate analysis of
416 patients with glioblastoma multiforme: prognosis, extent of re-section of rere-section and survival. J Neurosurg 2001;95:190 –98
6. Mangiola A, Maira G, De Bonis P, et al. Glioblastoma multiforme in
the elderly: a therapeutic challenge. J Neurooncol 2006;76:159 – 63
7. Galanis E, Buckner J, Kimmel D, et al. Gene amplification as a
prog-nostic factor in primary and secondary high-grade malignant glio-mas. Int J Oncol 1998;13:717–24
8. Shinojima N, Tada K, Shiraishi S, et al. Prognostic value of epidermal
growth factor receptor in patients with glioblastoma multiforme. Cancer Res 2003;63:6962–70
9. Law M, Young RJ, Babb JS, et al. Gliomas: predicting time to
pro-gression or survival with cerebral blood volume measurements at dynamic susceptibility-weighted contrast-enhanced perfusion MR imaging. Radiology 2008;247:490 –98
10. Spampinato MV, Schiarelli C, Cianfoni A, et al. Correlation between AJNR Am J Neuroradiol 36:1247–52 Jul 2015 www.ajnr.org 1251
cerebral blood volume measurements by perfusion-weighted mag-netic resonance imaging and two-year progression-free survival in gliomas. Neuroradiol J 2013;26:385–95
11. Bisdas S, Kirkpatrick M, Giglio P, et al. Cerebral blood volume
mea-surements by perfusion-weighted MR imaging in gliomas: ready for prime time in predicting short-term outcome and recurrent dis-ease? AJNR Am J Neuroradiol 2009;30:681– 88
12. Bampoe J, Bernstein M. The role of surgery in low grade gliomas.
J Neurooncol 1999;42:259 – 69
13. Murakami R, Hirai T, Sugahara T, et al. Grading astrocytic tumors
by using apparent diffusion coefficient parameters: superiority of a one versus two-parameter pilot method. Radiology 2009;251:
838 – 45
14. Bode MK, Ruohonen J, Nieminen MT, et al. Potential of diffusion
imaging in brain tumors: a review. Acta Radiol 2006;47:585–94
15. Murakami R, Sugahara T, Nakamura H, et al. Malignant
supraten-torial astrocytoma treated with postoperative radiation therapy: prognostic value of pretreatment quantitative diffusion-weighted MR imaging. Radiology 2007;243:493–99
16. Higano S, Yun X, Kumabe T, et al. Malignant astrocytic tumors:
clinical importance of apparent diffusion coefficient in prediction of grade and prognosis. Radiology 2006;241:839 – 46
17. Nakamura H, Murakami R, Hirai T, et al. Can MRI-derived factors
predict the survival in glioblastoma patients treated with postoper-ative chemoradiation therapy? Acta Radiol 2013;54:214 –20
18. Oh J, Henry RG, Pirzkall A, et al. Survival analysis in patients with
glioblastoma multiforme: predictive value of choline-to-N-acety-laspartate index, apparent diffusion coefficient, and relative cere-bral blood volume. J Magn Reson Imaging 2004;19:546 –54
19. Stupp R, Mason WP, van den Bent MJ, et al. Radiotherapy plus
con-comitant and adjuvant temozolomide for glioblastoma. N Engl J Med 2005;352:987–96
20. Paul I, Bhattacharya S, Chatterjee A, et al. Current understanding on
EGFR and Wnt/-catenin signaling in glioma and their possible crosstalk. Genes Cancer 2013;4:427– 46
21. Yiin JJ, Hu B, Schornack PA, et al. ZD6474, a multitargeted inhibitor
for receptor tyrosine kinases, suppresses growth of gliomas ex-pressing an epidermal growth factor receptor mutant, EGFRvIII, in the brain. Mol Cancer Ther 2010;9:929 – 41
22. Johnson G, Wetzel SG, Cha S, et al. Measuring blood volume and
vascular transfer constant from dynamic, T(2)*-weighted contrast-enhanced MRI. Magn Reson Med 2004;51:961– 68
23. Knopp EA, Cha S, Johnson G, et al. Glial neoplasms: dynamic
con-trast-enhanced T2*-weighted MR imaging. Radiology 1999;211:
791–98
24. Rosen BR, Belliveau JW, Buchbinder BR, et al. Contrast agents and
cerebral hemodynamics. Magn Reson Med 1991;19:285–92
25. Rosen BR, Belliveau JW, Vevea JM, et al. Perfusion imaging with
NMR contrast agents. Magn Reson Med 1990;14:249 – 65
26. Spampinato MV, Wooten C, Dorlon M, et al. Comparison of
first-pass and second-bolus dynamic susceptibility perfusion MRI in brain tumors. Neuroradiology 2006;48:867–74
27. Wetzel SG, Cha S, Johnson G, et al. Relative cerebral blood volume
measurements in intracranial mass lesions: interobserver and in-traobserver reproducibility study. Radiology 2002;224:797– 803
28. Wang S, Kim S, Chawla S, et al. Differentiation between
glioblas-tomas, solitary brain metastases, and primary cerebral lymphomas using diffusion tensor and dynamic susceptibility contrast-en-hanced MR imaging. AJNR Am J Neuroradiol 2011;32:507–14
29. Lev MH, Ozsunar Y, Henson JW, et al. Glial tumor grading and
outcome prediction using dynamic spin-echo MR susceptibility mapping compared with conventional contrast-enhanced MR: confounding effect of elevated rCBV of oligodendrogliomas. AJNR Am J Neuroradiol 2004;25:214 –21
30. Law M, Oh S, Babb JS, et al. Low-grade gliomas: dynamic
suscepti-bility weighted contrast-enhanced perfusion MR imaging-predic-tion of patient clinical response. Radiology 2006;238:658 – 67
31. Law M, Yang S, Babb JS, et al. Comparison of cerebral blood volume
and vascular permeability from dynamic susceptibility contrast-enhanced perfusion MR imaging with glioma grade. AJNR Am J Neuroradiol 2004;25:746 –55
32. Mangla R, Ginat DT, Kamalian S, et al. Correlation between
progres-sion free survival and dynamic susceptibility contrast MRI perfu-sion in WHO grade III glioma subtypes. J Neurooncol 2014;
116:325–31
33. Hirai T, Murakami R, Nakamura H, et al. Prognostic value of
perfu-sion MR imaging of high-grade astrocytomas: long-term follow-up study. AJNR Am J Neuroradiol 2008;29:1505–10
34. Cha S, Tihan T, Crawford F, et al. Differentiation of low grade
oli-godendrogliomas from low-grade astrocytomas by using quantita-tive blood-volume measurements derived from dynamic suscepti-bility contrast-enhanced MR imaging. AJNR Am J Neuroradiol
2005;26:266 –73
35. Essock-Burns E, Philips JJ, Molinaro AM, et al. Comparison of
DSC-MRI post-processing techniques in predicting microvascular histo-pathology in patients newly diagnosed with GBM. J Magn Reson Imaging 2013;38:388 – 400
36. Morita N, Wang S, Chawla S, et al. Dynamic susceptibility contrast
perfusion weighted imaging in grading of non-enhancing astrocy-tomas. J Magn Reson Imaging 2010;32:803– 08
37. Wu WC, Chen CY, Chung HW, et al. Discrepant MR spectroscopic
and perfusion imaging results in a case of malignant transforma-tion of cerebral glioma. AJNR Am J Neuroradiol 2002;23:1775–78
38. Nelson SJ. Assessment of therapeutic response and treatment
plan-ning for brain tumors using metabolic and physiological MRI. NMR Biomed 2011;24:734 – 49
39. Yamasaki F, Sugiyama K, Ohtaki M, et al. Glioblastoma treated with
postoperative radiochemotherapy: prognostic value of apparent diffusion coefficient at MR imaging. Eur J Radiol 2010;73:532–37
40. Pierallini A, Bonamini M, Pantano P, et al. Radiological assessment
of necrosis in glioblastoma: variability and prognostic value. Neu-roradiology 1998;40:150 –53
41. Ru P, Williams TM, Chakravarti A, et al. Tumor metabolism of
ma-lignant gliomas. Cancers 2013;5:1469 – 84
42. Miyagami M, Katayama Y. Angiogenesis of glioma: evaluation of
ultrastructural characteristics of microvessels and tubular bodies (Weibel-Palade) in endothelial cells and immunohistochemical findings with VEGF and p53 protein. Med Mol Morphol 2005;
38:36 – 42
43. Kapoor GS, Gocke TA, Chawla S, et al. Magnetic resonance
perfu-sion weighted imaging defines angiogenic subtypes of oligodendro-glioma according to1p19q and EGFR status. J Neurooncol 2009;
92:373– 86
44. Abdulrauf SI, Edvardsen K, Ho KL, et al. Vascular endothelial
growth factor expression and vascular density as prognostic mark-ers of survival in patients with low-grade astrocytoma. J Neurosurg
1998;88:513–20
45. Shaw EG, Tatter SB, Lesser GJ, et al. Current controversies in the
radiotherapeutic management of adult low-grade glioma. Semin Oncol 2004;31:653–58
46. Stupp R, Baumert BG. Promises and controversies in the
manage-ment of low-grade glioma. Ann Oncol 2003;14:1695–96
47. Xie K, Yang J, Zhang ZG, et al. Semi-automated brain tumor and
edema segmentation using MRI. Eur J Radiol 2005;56:12–19
48. Kaus MR, Warfield SK, Nabavi A, et al. Automated segmentation of